Batseba Alfonsina Suripatty![]() | Ebedly Lewerissa*
| Ebedly Lewerissa*![]() | Pudja Mardi Utomo
| Pudja Mardi Utomo![]() | Krisma Lekitoo
| Krisma Lekitoo![]() | Julanda Noya
| Julanda Noya![]() | Yusuf Komendi
| Yusuf Komendi![]() | Jacob Manusawai
| Jacob Manusawai![]() | Agustinus Murdjoko
| Agustinus Murdjoko![]() | Resti Ura’
| Resti Ura’![]() | Yulizar Ihrami Rahmila
| Yulizar Ihrami Rahmila![]() | Evelin Parera
| Evelin Parera![]() | Andreas Aprilano Thomas Suli
| Andreas Aprilano Thomas Suli![]()
© 2024 The authors. This article is published by IIETA and is licensed under the CC BY 4.0 license (http://creativecommons.org/licenses/by/4.0/).
OPEN ACCESS
Sago as a source of starch has an important role as a food ingredient. The sago starch used by Papuan people consists of various varieties and so far, the public does not understand the contents of each sago variety. The aim of this research is to determine the diversity of sago varieties and determine the sago starch content in several sago varieties in Kainui. This research used a sample plot method measuring 25 m × 25 m with 16 plots which functioned to obtain data on the distribution of sago ready to be harvested. The harvested sago tree is measured for its length, diameter, base, middle and tip to 1 meter, then skinned and shredded. The sago pith is grated, squeezed and the starch is extracted then put into an aqua bottle. Various protein contents were calculated using the AOAC 2006 formula. The results of the research showed that five varieties of sago were found with different growth and varietal diversity. The results of the analysis show that the best quality of sago starch is the sago amin variety with a value of 92.3%, the highest water content is found in the sago amin variety, the lowest ash content is in the sago manoari variety 0.07%. The highest starch production was in the sago hawar variety at 99.34%, while the highest amylose content was found in the sago hawar variety with a value of 25.91%. This study provides recommendations to sago farmers in Papua about five sago varieties in Kainui with the best nutritional content in each sago variety, namely the Amin sago variety and also to the Kainui Regional Government as a basis for policy making for future sago starch processing.
starch content, nutritional analysis, Papua, varieties of sago, Yapen
Significant concern regarding the issue of food security globally is an important problem that is also felt by the indigenous people of Papua. Papuan indigenous people are still very dependent on rice, which is a widely imported commodity. During the global pandemic, Papuan indigenous people faced problems with food supply and food security [1].
Sago (Metroxylon spp.) is naturally distributed in almost every island or archipelago in Indonesia with the largest area concentrated in Papua, while semi-cultivated sago is found in Maluku, Sulawesi, Kalimantan and Sumatra. The place of growth and genetic diversity of sago varies greatly. Based on the results of exploration and identification of sago accessions in Kehiran Village, Jayapura, Irian Jaya, 20 types of sago (local names) were found, of these, 9 types of sago are spiny sago, and 11 are thornless sago [2]. The sago tree (Metroxylon sagu Rottb.) is one of the main sources of edible starch that has become part of the local culture in Papua and West Papua provinces in Indonesia [3, 4].
Based on the location of its natural distribution, each sago tree produces different sago starch yields. Production efficiency will be higher on land that is not waterlogged. This is also consistent with the dry weight of starch in one sample of 13.89 grams of flooded land, 9.59 grams of temporarily flooded land and 10.93 grams of flooded land, but the starch content on flooded land remains lower (79.17%) than the other two lands [5]. The results of the analysis by study [6] showed that the carbohydrate content of Sago Tuni flour (Metroxylon rumphii) was 89.13%, Sago Ihur flour (Metroxylon sylvester) was 76.03% and Sago Molat flour (Metroxylon sagus Rottbol) was 88.6%. The difference in the carbohydrate content of the three types of sago flour can be caused by several factors
The importance of sago as a staple food has not changed in some areas such as Siberut Island in western Sumatra, eastern Indonesian archipelago: Maluku and Papua [7]. In Kainui, various sago varieties live in their respective habitats and are consumed by the local community. Some sago accessions that live in the Kainui-Yapen area and have high economic value include: sago wewa accession, sago makbon accession, sago hawar accession, sago manoari accession and sago amin accession.
Although sago is a food commodity for local communities in Papua which in this position is often debated when used as an alternative energy raw material, but because it is estimated that the potential production of sago is much greater than the consumption of sago starch as a raw material in domestic food (only 210 tons per year or 4-5% of the potential production of sago). Sago as a source of starch has an important role as a food ingredient [8].
The diversity of sago in Kainui has not been explored and the existing varieties have not been well characterized so that the data is not yet accurately available, so that the sago starch used so far by the Papuan people comes from various varieties and so far the community has not understood the content in each variety. Thus, they do not know which variety will be used as a reference for a good starch source in terms of its nutritional content. The purpose of this study is to determine the diversity of sago varieties and determine the nutritional content of sago starch contained in several varieties in Kainui, so that this data will be a consideration and basic data for policy makers in determining good varieties to be developed as superior sago plants in West Papua.
2.1 Material
The material used during the research was sago trees which were inventoried as trees that were ready to be harvested. The sago tree will then be cut into several sections 1 meter long to be used as sago starch samples.
2.2 Research procedure
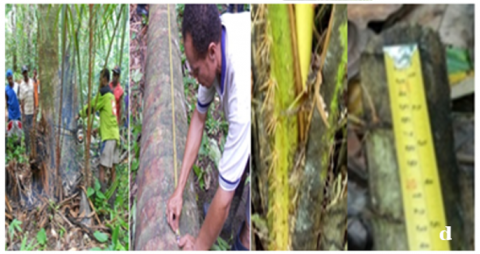
Primary data collection was carried out in the research area using the quadratic method. The quadratic method is a method that uses sample plots [9]. The sample plot with a size of 100 m × 100 m (1 Ha) consists of 1 (one) observation plot (with a total observation area in the field of 1 Ha). In one sample plot, the plot is divided into sub-plots which aim to make it easier to make observations in the field, with a size of 25 m × 25 m. The number of observation subplots in the field is 16 plots which are further divided into observation radius based on growth phase. The layout of the observation procedure (inventory and identification of sago varieties) as shown in Figure 1.
1. Sago trees are inventoried based on their growth rate, including height, diameter, healthy stems, leaf sheaths that are short when compared to the previous sheaths, the shoots do not form midribs but form fruit, the sago trees start to produce flowers and the average age is 9 years to be ready harvest.
2. Sago trees are selected randomly and then identified based on their thorns, leaves, bark and roots.
3. Sago trees that are found based on their qualifications are then cut down. After that, the length of the tree stem, stem diameter, base, middle and tip were measured at 1 meter. Then the tree stem is cut in the middle and ends, then skinned and the pith is grated. After grating, the pith is squeezed and the starch is taken, then put into 650 ml aqua bottles, 3 bottles per variety, closed tightly and stored, then the sago starch samples are analyzed in the laboratory.
Figure 1. Layout of the sago variety observation plot
2.3 Data analysis
a. Water content [10]
The sago starch sample was weighed at 200-205 mg on a zinc plate which was known to have an initial weight. Starch samples were baked at 200℃ for 6 hours. The zinc plate was cooled in a desiccator for 30 minutes. The sample is weighed until a constant weight is obtained. Water content can be calculated using the formula:
Humidity level $=\frac{\mathrm{w} 2-\mathrm{w} 1}{\mathrm{w} 0} \times 100 \%$
where,
w1 = Final weight (Sample and dry cup)
w2 = Weight of empty cup
w0 = Sample weight
b. Ash content [10]
The sago starch sample was weighed at 200-205 mg in a porcelain glass. The sample in porcelain is then put into an electric furnace. The furnace is stirred for 6 hours with temperature increments of 120℃-550℃. Samples in porcelain cups were cooled in a desiccator for 1 hour. The sample is then weighed and repeated until a constant weight is obtained. Ash content is obtained by the formula:
Ash content $=\frac{\mathrm{w} 1-\mathrm{w} 2}{\mathrm{w} 0} \times 100 \%$
where,
w1 = Final weight (Sample and dry cup)
w2 = Weight of empty cup
w0 = sample weight
c. Amylose content [10]
An 80-mesh sago starch sample is required for amylose analysis. The purity of sago starch will indicate the level of amylose contained in the starch. The sample was weighed 100 mg into a 100 ml volumetric flask, then added 1 ml each of 95% ethanol and 9 ml of 1 N NaOH. The measuring flask was heated in 95℃ water bath for 10 minutes. The measuring flask is removed and cooled for 20-30 minutes. The sample was diluted with distilled water to a volume of 100 ml. The samples in the diluted volumetric flask were pipetted 5 ml each into a 100 ml volumetric flask and added 2 ml of iodine solution (0.2 g of iodine and 2.0 g of iodine pot in 100 ml of distilled water solution) and 1 ml of acetic acid solution 1 N. The solution is diluted again with distilled water to 100 ml.
The color of amylose was measured using a 620 nm spectrophotometer. A standard curve was prepared in the same way, but with standard amylose. Next, the amylose concentration in the sample is determined with the help of a standard curve.
3.1 Diversity of sago varieties
The research (Table 1) results show that the diversity of sago types in Kainui consists of 5 (five) varieties, where each variety has different growth and production abilities.
Table 1. Diversity of sago varieties in Kainui
|
No. |
Variety Name |
Thorny/No Thorny |
|
1 |
Metroxylon sago variety Amin |
Thorny |
|
2 |
Metroxylon sago variety Hawar |
Thorny |
|
3 |
Metroxylon sago variety Makbom |
Thorny |
|
4 |
Metroxylon sago variety Manoari |
Thorny |
|
5 |
Metroxylon sago variety Wewa |
Thorny |
Source: Results of 2020 research data processing.
The identification results of the number of leaves, leaf width and leaf length of the five different sago varieties are as seen in Table 2.
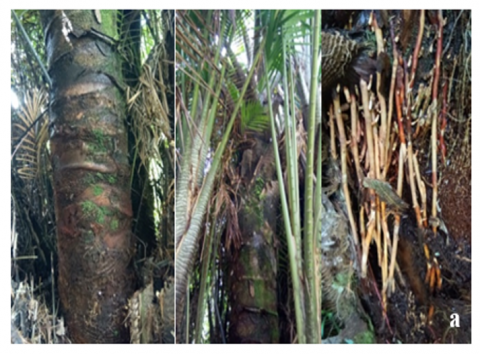
Identification of the spines of the five sago varieties shows that each variety is similar, namely in the color of the spines which are generally brown but different from one another, namely the length of the spines and the shape of the spines, as shown in Figure 2, Table 3 and Table 4.
Figure 2. Identified sago varieties (a) amin variety, (b) hawar variety, (c) makbom variety, (d) manoari variety, (e) wewa variety
Source: Research results in 2021.
Table 2. Leaf identification of sago varieties
|
No. |
Variety |
Amount Child Leaf Number of Leaflets (Sheet) |
Long Child Leaves (cm) Leaflet Length (cm) |
Wide Child Leaf Leaflet Width (cm) |
Distance Between Bone Child Leaf |
||||||||
|
Base |
Middle |
End |
Base |
Middle |
End |
Base |
Middle |
End |
Base |
Middle |
End |
||
|
1 |
Amin |
68 |
89 |
- |
82 |
174 |
57.4 |
3.9 |
8.9 |
3.3 |
4.7 |
11.4 |
3.6 |
|
2 |
Hawar |
70 |
71 |
- |
28 |
121 |
28.3 |
2.4 |
7.7 |
2.2 |
5.5 |
12.3 |
4.7 |
|
3 |
Makbom |
56 |
57 |
- |
93 |
134 |
66 |
2.5 |
8.5 |
3.7 |
8.4 |
10 |
8.6 |
|
4 |
Manoari |
53 |
52 |
- |
70 |
177 |
59 |
2.1 |
9.4 |
3.3 |
7.8 |
10.8 |
6.2 |
|
5 |
Wewa |
69 |
70 |
- |
57 |
132 |
40 |
0.4 |
8.2 |
2.0 |
2.4 |
8.3 |
7.4 |
Source: 2021 research results.
Table 3. Identification of sago variety spines from growth stage
|
No. |
Variety |
Seedling |
Sapling |
Pole |
|||||||||
|
Long Thorn |
Distance Between Thorn |
Long Thorn |
Distance Between Thorn |
Long Thorn |
Distance Between Thorn |
||||||||
|
Base |
Middle |
End |
Base |
Middle |
End |
Base |
Middle |
End |
|||||
|
1. |
Amin |
9.8 |
3.8 |
16.4 |
6.2 |
5.3 |
3.7 |
12,7 |
2.6 |
8,9 |
4,2 |
12 |
3.9 |
|
2. |
Hawar |
0.9 |
4.1 |
21.2 |
6 |
11 |
5 |
30 |
- |
2,5 |
8.7 |
42 |
- |
|
3. |
Makbom |
- |
- |
- |
- |
8,5 |
- |
- |
- |
2,5 |
4.7 |
- |
- |
|
4. |
Manoari |
7.1 |
4.1 |
21.2 |
6 |
5.5 |
2.7 |
14,8 |
1 |
6,3 |
12.8 |
30 |
2 |
|
5. |
Wewa |
0.9 |
5,6 |
36.6 |
4.3 |
6.5 |
6 |
29 |
10.5 |
0.7 |
14 |
32 |
9.3 |
Source: Results of research data processing in 2021.
Table 4. Identification of thorn shape and thorn color of the five sago varieties
|
Variety |
Seedling |
Stake |
Pole |
|||
|
Form Thorns |
Color Thorns |
Form Thorns |
Thorn Color |
Form Thorns |
Thorn Color |
|
|
Amin |
Cluster, scatter base fronds, next thorns lined up on back midrib until end leaf |
Chocolate |
Clustered, circular, spread on base midrib, while ± 1 m from base thorns group lined up on the back midrib to direction end leaf |
Chocolate |
Clustered, circular, spread on base midrib, while ± 1 m from base thorns group lined up on the back midrib to direction end leaves. Thorn small on back stick child leaf |
Chocolate |
|
Hawar |
Clustered, spread at the base fronds, next thorns lined up on back midrib in the same direction to end leaf |
Chocolate reddish on stem shoots midrib, meanwhile midrib other thorns colored chocolate |
Clustered, spread at the base fronds, next thorns lined up on back midrib in the same direction to end leaf |
Chocolate |
Clustered, spread at the base fronds, next thorns lined up on back midrib in the same direction to end leaf |
Chocolate |
|
Makbom |
Thorn short appears 2 on the back base midrib, the next frond is thornless |
Red chocolate |
Thorn short clustered, circular, spread at the base midrib whereas thorns long group on the side base midrib, long limit thorns from base until size 164cm on base midrib |
Chocolate |
Thorn small Clustered, circular, spread on base midrib, while ± 1-2 m from base thorns group lined up on the back midrib until limit leaf 5th ie _ size 390 cm, meanwhile furthermore to direction end leaf No there is thorns |
Chocolate |
|
Manoari |
Clustered, spread at the base fronds, next thorns lined up on back midribs way end leaf |
Chocolate reddish on stem shoots midrib whereas midrib other thorns colored chocolate |
Clustered, circular, spread on base midrib, while ± 1 m from base thorns group lined up on the back midrib to direction end leaf |
Chocolate |
Clustered, circular, spread on base midrib, while ± 1 m from base thorns group lined up on the back midrib to direction end leaf |
Chocolate |
|
Wewa |
Clustered, spread at the base fronds, next thorns lined up on back midrib to end leaf |
Chocolate |
Clustered alternately, spread out evenly ground midrib to near the tip of the leaf, while ± 1 m from base thorns lined up on the back midrib to direction end leaf |
Chocolate |
Clustered, circular alternating, spread out on base midrib, while ± 1 m from base thorns group lined up on the back midrib to direction end leaf |
Chocolate |
Source: 2021 Research Data Processing Results.
Table 5. Identification of sago variety stems
|
Variety |
Long Stem |
Stem Diameter without Skin |
Thick Skin |
Stem Shape |
Stem Color |
Root Color |
Color Leaf |
Color Midrib |
||
|
Base |
Middle |
End |
||||||||
|
Amin |
8 |
40 |
4 |
3.9 |
3 |
round |
Slightly dark brown |
Brown, brass, reddish |
Green |
Green, gray, yellowish |
|
Hawar |
11 |
40 |
3,2 |
3 |
2,1 |
round |
Chocolate |
Reddish light brown |
Green |
Base midrib green, brown, gray, so on until to end leaf green yellowish |
|
Makbom |
9 |
55 |
4 |
3 |
2.8 |
round |
Chocolate a little reddish |
Reddish brown |
Dark green |
Green, gray, yellow |
|
Manoari |
8.20 |
42 |
4,3 |
4,2 |
2,9 |
round |
Slightly blackish brown |
Reddish brown |
Reddish brown |
Yellowish green |
|
Wewa |
15 |
50 |
4 |
3 |
1.9 |
round |
Chocolate |
Yellowish Green |
Reddish brown |
The base of the midrib is green, brown, gray, next |
3.2 Quality of sago flour
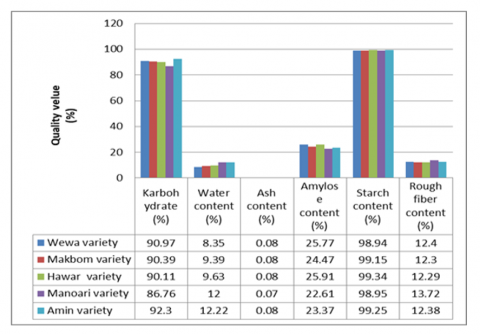
The results of the analysis of the quality of sago flour can be seen in Figure 1-Figure 8.
3.2.1 Carbohydrate content
Figure 3. Carbohydrates produced from various sago varieties
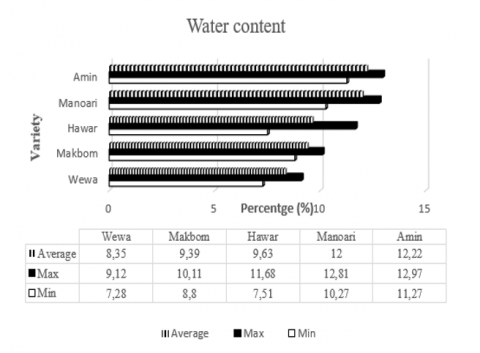
3.2.2 Water content
Figure 4. Water content of sago starch produced by five sago varieties
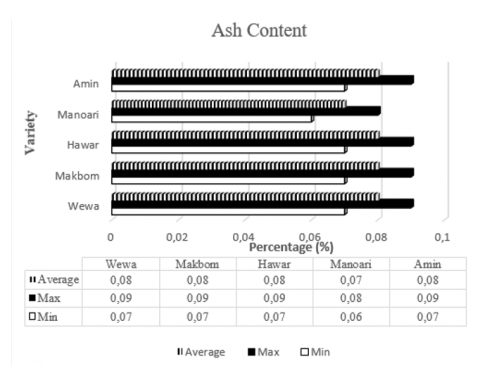
3.2.3 Ash content
Figure 5. Ash content produced from five varieties of sago
3.2.4 Sago starch content
Figure 6. Sago starch content from production of various sago varieties
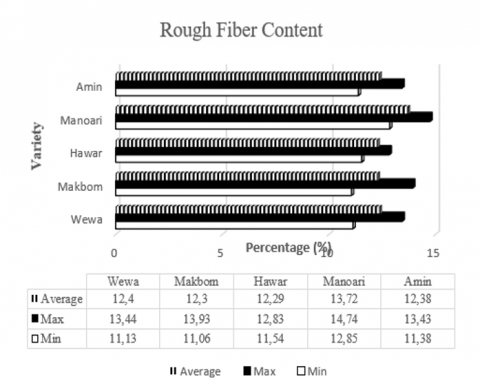
3.2.5 Rough fiber content
Figure 7. Rough fiber content produced by various types of sago
3.2.6 Amylose content
Figure 8. Amylose content of five sago varieties
The recapitulation of test results on the quality of sago flour can be seen in Figure 9.
Figure 9. Comparison of the quality of 5 varieties of sago flour
The identification of species diversity found in Kainui natural forest found five varieties (Table 1) where each variety is found with its growth forming clumps and each variety of sago found has a different number of tillers according to its growth phase. This is as explained by study [6], that the sago found grows in clumps with different growth phases naturally. The five varieties found have in common that all are categorized as spiny sago varieties.
The crown shape of the five sago varieties found in Kainui is quite varied. Most varieties have a straight and upright crown shape. This is explained by study [11], that the crown shape of sago accessions found in South Sorong Regency varies and the accession has an upright crown shape. This can be seen from the difference in leaf shape of the five different varieties, namely the number of leaflets and leaflet width (Table 2).
Table 5 shows that the wewa variety has better stem height (13 m - 15 m and diameter 67cm - 80cm) than other varieties. However, not always the height and diameter of the stem is better for producing sago protein, but in terms of producing more sago starch than other varieties, as produced by this research, one variety, namely Wewa, with a height of 15 cm, a diameter of 50 cm produces as much wet sago starch. 430 kg. In the Kainui natural forest, the wewa variety is dominated, followed by the blight variety and other varieties. In line with the research of [11] that in the natural forest of West Papua found the average stem height is 13.3 m and a diameter of 40.4 cm. This is because there has been a change in the ecosystem with human intervention with a silviculture system, namely intensive maintenance.
The quality of sago starch is determined based on the color of the starch produced, this, as produced in this study, is white, meaning that the sago starch results are very good and contains high carbohydrates, namely 92.3%, a higher value according to study [1] that the results of research from the Institute of Nutrition, Mahidol University (2014) and the United States Department of Agriculture (2018) show that the carbohydrate value obtained is 86.3, thus it will be a reference to be used as a basis for decision making by farmers and local governments for the development of sago varieties in the future. When the pith was opened, most of the sago cores observed were pink in color. It was explained by study [12] that the higher the sulfur content in the soil, the lower the L value (color brightness) and the darker the starch color. The results of this study indicate that the value of Sulphur in the soil where sago is planted is lower, so the color of sago starch is white. The analysis showed that the best sago starch content in the sago hawar variety was 99.34% and the lowest in the sago wewa variety was 98.94% (Figure 3).
The blighted sago variety grows in a low-density environment and is influenced by its growing location, as explained by study [13] that plant density greatly affects the growth and productivity of sago plants. The growing environment will supply a variety of organic and mineral materials that are transported by the roots of the breath will make the composition of the carbohydrate content in sago even higher. This is in accordance with the opinion of study [14] that the suitable environment for planting sago is a muddy area where the breath roots are not submerged, rich in minerals and organic matter.
The study [15] state that the water content in food will affect the appearance, texture and taste of food. Moisture content is the water content contained in the material, expressed in percent. Water is very influential on good or bad food. Water content affects the stability of an ingredient when stored. Water content also greatly affects food quality [15], such as texture, odor and appearance. High water content has the potential to be attacked by microorganisms. The lower the water content in starch, the better the quality of sago starch. By study [16], the moisture content of sago starch through conventional drying method was 13.69%. This means that the water content is higher than the results of laboratory analysis (Figure 4 and Figure 9) highest 12.22%. The research results from study [17] explain that the water content of sago starch produced in the Sukabumi area is higher, namely 15.07%. This means that the water content obtained in the Kainui natural forest is better because it meets SNI standards. The habit of sago farmers in Papua after harvesting sago, starch that is still wet is only placed in tumang, a container made of sago leaf fronds. This is what makes sago starch quickly damaged by microorganisms.
The amount of ash content in the six treatments has met the quality standard of sago starch (SNI 3729: 2008), which is a maximum of 0.5%. The difference in ash content of the sago starch produced is not too significant. This happens because the ash content in a material comes from the material itself. The results of the sample analysis of the five sago varieties (Figure 5) show the lowest ash content in the manoari sago variety of 0.07% and the highest in the hawar sago variety of 0.8%. This is different from the research results from study [17] which obtained an ash content of 0.15%. Also, by study [18], the ash content obtained from Bengkali was 0.437% and from Inhil was 0.116%. Also, according to study [19] the ash content produced from Merbau District is 0.408%. Study [18] stated that ash content in food generally comes from the food itself. The composition of sago flour is strongly influenced by the physical conditions of the soil where sago grows and develops.
Based on study [18], sago (Metroxylon sp.) growing on waterlogged land, in acidic conditions and containing high concentrations of sulfur will produce starch with high ash content. Based on study [10], the condition of South Sorong sago, precisely Sayal Village, generally grows on mineral soil with flooded land, both temporarily and permanently waterlogged.
Starch content is the amount of starch contained in the material expressed in percent. Starch is a polysaccharide synthesized from green plants through photosynthesis. Starch has a granular crystalline form that has a size and shape depending on the type of plant. Starch is used as a thickener and stabilizer in food. The analysis shows that the highest sago starch produced from the tested varieties is the hawar variety with an average value of 99.34% and the lowest in the wewa variety which is 98.94% (Figure 6). This is due to differences in starch content in various varieties and affected sago trees [19] based on the productivity activity of each tree. High lighting in the blight variety habitat compared to the wewa habitat.
Crude fiber is part of food that cannot be hydrolyzed by chemicals. Based on study [19], crude fiber is part of food that cannot be hydrolyzed by strong acids or bases, the chemicals used to determine crude fiber content are sulfuric acid (H2SO4 1.25%) and sodium hydroxide (NaOH 3.25%). The results in Figure 7 show that the value of crude fiber produced from various varieties of sago is not hydrolyzed properly so that the value is still higher than the quality standard of sago starch (SNI 3729: 2008), which is a maximum of 0.5%.
The results of the analysis (Figure 8) show that the highest amylose content is in the blight variety and amylopectin in the makbom variety. Based on study [16], the amylose component is related to water absorption and the perfection of the product gelatinization process, while the amylopectin component will determine the swelling power (ability of starch to expand) and starch solubility. Based on study [20], sago starch contains about 27% amylose and 73% amylopectin. Study [16] reported that high amylose content causes the development of starch granules to occur at higher temperatures, so that starch with a high amylose content has a lower developmental power than starch that has a lower amylose content.
As a result of research exploring sago varieties found in Kainui Yapen, five varieties were obtained, including: Amin variety sago, Makbom variety sago, Wewa variety sago, Manoari variety sago, and Hawar variety sago. Protein analysis related to the starch content of the five sago varieties, where the highest starch content was found in the sago hawar variety with a value of 99.34%. The sago farming community in Kainui does not yet know the best quality of sago that will be used as food for consumption. The results of this research reveal the best quality of sago for the needs of the community and are used as a basis for consideration by the regional government, especially the Regional Food Crops Service of Papua Province, to take food policies in Papua in the future, namely planning to develop the cultivation of hawar sago varieties by creating nurseries for hawar sago plants and carrying out silvicultural measures. (maintenance) in sago fields. This research has not revealed the ecology of all sago varieties found, therefore further research needs to be carried out regarding the ecology of each variety and its productivity.
[1] Sidiq, F.F., Coles, D., Hubbard, C., Clark, B., Frewer, L.J. (2021). Sago and the indigenous peoples of Papua, Indonesia: A review. Journal of Agriculture and Applied Biology, 2(2): 138-149. https://doi.org/10.11594/jaab.02.02.08
[2] Morphologi dan Potensi beberapa jenis tanaman Sagu. https://repository.pertanian.go.id/server/api/core/bitstreams/4cc33ae2-e077-42de-8f08-c0c5146b952f/content, accessed on Feb. 23, 2024.
[3] Yater, T., Tubur, H.W., Meliala, C., Abbas, B. (2019). Short communication: A comparative study of phenotypes and starch production in sago palm (Metroxylon sagu) growing naturally in temporarily inundated and non inundated areas of south Sorong, Indonesia. Biodiversitas Journal of Biological Diversity, 20(4): 1121-1126. https://doi.org/10.13057/biodiv/d200425
[4] Dimara, P.A., Purwanto, R.H, Sunarta, S., Wardhana, W. (2021). The spatial distribution of sago palm landscape Sentani watershed in Jayapura District, Papua Province, Indonesia. Biodiversitas, 22(9): 3811-3820. https://doi.org/10.13057/biodiv/d220926.
[5] Khalik, M.N, Bahrun, A., Safuan, L.O. (2017). Hubungan kadar hara N, P, K tanah dan jaringan tanaman terhadap pertumbuhan dan produksi tanaman sagu (Metroxylon sagu Rottb. Berkala Penelitian Agronomi, 5(2). https://doi.org/10.33772/bpa.v5i2.7562
[6] Huwae, B.R., Duri, S., Namun, R. (2014). Analisis kadar karbohidrat tepung beberapa jenis sagu yang dikonsumsi masyarakat maluku. BIOPENDIX: Jurnal Biologi, Pendidikan Dan Terapan, 1(1): 61-66. https://doi.org/10.30598/biopendixvol1issue1page61-66
[7] Tjokrokusumo, D. (2018). Potency of sago (Metroxylon spp.) crops for food diversity. Biodiversity International Journal, 2(3): 239-240. https://doi.org/10.15406/bij.2018.02.00066
[8] Dahlan, S.A., Saman, W.R., Mokodompit, K.A., Pakaya, A., Hikmawati, S.R., Muti, S. (2022). Identifikasi kadar air sagu kering dan sagu basah setelah penyimpanan dan pengeringan. In Seminar Nasional Mini Riset Mahasiswa, 1(2): 107-113.
[9] Safitri, A., Wahid, I., Khairaddaraini, K., Mulyadi, M. (2018). Analisis Vegetasi tumbuhan habitus tiang dan pohon di kawasan pegunungan Deudap Pulo Aceh Kabupaten Aceh Besar. In Prosiding Seminar Nasional Biotik, 6(1).
[10] Official methods of analysis of AOAC International - 20th edition, 2016. https://www.techstreet.com/standards/official-methods-of-analysis-of-aoac-international-20th-edition-2016?product_id=1937367, accessed on Jan. 26, 2024.
[11] Dewi, R.K. (2015). Karakterisasi berbagai aksesi sagu (Metroxylon Spp.) di kabupaten sorong selatan, Papua Barat. Doctoral dissertation. Bogor Agricultural University (IPB).
[12] Konuma, H., Rolle, R, Boromthanarat, S. (2012). Color characteristics of sago starch as they relate to the growth environment of the sago palm (Metroxylon sagu Robb). Journal of Agricultural Technology, 8(1): 273-287.
[13] Dewi, R.K., Bintoro, M.H. (2016). Karakter morfologi dan potensi produksi beberapa aksesi sagu (Metroxylon spp.) di kabupaten Sorong Selatan, Papua Barat. Indonesian Journal of Agronomy, 44(1): 91-97. https://doi.org/10.24831/jai.v44i1.12508
[14] Suripatty, B.A., Poedjirahajoe, E., Pudyatmoko, S., Budiadi, B. (2016). Pertumbuhan Sagu (Metroxylon sp) Di Hutan Alam Papua. Jurnal Hutan Pulau-Pulau Kecil, 1(2): 151-159.
[15] Sundari, D., Almasyhuri, Lamid, A. (2015). Effect of cooking process of composition nutritional substances some food ingredients protein source. Media Penelitian Dan Pengembangan Kesehatan, 25(4): 235-242.
[16] Jading, A., Tethool, E., Payung, P., Gultom, S. (2011). Bertenaga surya dan biomassa physicochemical characteristics of sago starch obtained from. Reaktor, 13(3): 155-164.
[17] Widaningrum, W., Purwati, A.Y., Munarso, S.J. (2005). Kajian terhadap sni mutu pati sagu. Jurnal Standardisas, 7(3): 91-98. https://doi.org/10.31153/js.v7i3.34
[18] Konuma, H., Rolle, R., Boromthanarat, S. (2013). Correlation of browning of starch extracted from sago palm (Metroxylon sagu Rottb.) to the phenolic content and ecosystem conditions of growth. Journal of Agricultural Technology, 9(1): 193-200.
[19] Manatar, J.E., Pontoh, J., Runtuwene, M.R. (2012). Analisis kandungan pati dalam batang tanaman aren (Arenga pinnata). Jurnal Ilmiah Sains, 12(2): 89-92. https://doi.org/10.35799/jis.12.2.2012.560
[20] Tirta, P.W., Indrianti, N., Ekafitri, R. (2013). Potensi tanaman sagu (Metroxylon sp.) dalam mendukung ketahanan pangan di Indonesia. Pangan, 22(1): 61-78.