Sabahudin Vrtagic*![]() | Bachar Mourched
| Bachar Mourched![]()
© 2025 The authors. This article is published by IIETA and is licensed under the CC BY 4.0 license (http://creativecommons.org/licenses/by/4.0/).
OPEN ACCESS
This study presents a machine learning framework for predicting gold prices by integrating diverse financial indicators, including the NASDAQ-100 index (^NDX), Bitcoin (BTC-USD), and gold futures (GC=F). Using daily high prices from February 2020 to May 2024, the approach incorporates robust preprocessing techniques such as the Box-Cox transformation and Principal Component Analysis (PCA) to address skewness, kurtosis, and multicollinearity, to reduce dimensionality while retaining 96.37% of the variance. A Genetic Algorithm-optimized Multi-Layer Perceptron (MLP) regression model achieved high predictive accuracy with an R² score of 0.98, an RMSE of 23.48 USD, and an MAE of 17.38 USD. Permutation importance analysis highlighted PC1 and PC2 as the most significant predictors, collectively capturing over 96% of the dataset's variance. The results emphasize the effectiveness of integrating stock indices, cryptocurrencies, and traditional financial variables for gold price prediction. This research offers practical applications for investors and policymakers by offering insights into market trends, enhancing decision-making, and bridging traditional and emerging markets in financial forecasting.
gold price prediction, machine learning, Principal Component Analysis (PCA), genetic algorithm, deep learning, financial indicators
The prediction of gold prices is a crucial aspect of financial forecasting, given gold's role as a reliable investment and a key economic indicator. Traditional forecasting models have largely depended on macroeconomic indicators and historical price data.
However, with the emergence of digital currencies and advanced machine learning techniques, opportunities have arisen to enhance prediction accuracy by integrating diverse financial variables, including cryptocurrencies, stock indices, and commodity prices. This section reviews the literature on gold price prediction, emphasizing various methodologies, their comparative performance, and the growing incorporation of novel financial indicators.
Machine learning techniques have been extensively applied across diverse fields for predictive modeling, including financial and material science applications. For instance, previous studies have demonstrated the integration of machine learning with physical simulation tools like COMSOL Multiphysics to design sensors for water salinity prediction and diesel adulteration detection, leveraging genetic algorithms and neural networks for optimal parameter tuning [1, 2]. These applications underscore the potential of combining domain-specific simulations with machine learning to achieve high predictive accuracy and robust performance in dynamic environments. Similarly, hybrid methodologies incorporating neural networks and optimization algorithms have shown promise in enhancing predictive capabilities, particularly when addressing high-dimensional data as in our work [3, 4]. The integration of these advanced techniques serves as a foundation for furthering the scope of predictive modeling in financial and engineering domains.
Early studies in gold price prediction relied on conventional statistical and machine learning models. Weng et al. [5] introduced a genetic algorithm regularization online extreme learning machine (GA-ROSELM), which incorporated variables such as crude oil and silver prices. This model outperformed traditional approaches, including ARIMA, support vector machines (SVM), and extreme learning machines (ELM). Similarly, Chandar et al. [6] demonstrated the superiority of ELM over other models by integrating data from gold, silver, crude oil, and the S&P 500 index. Complementing these findings, studies comparing LSTM, random forest regression, and linear regression identified LSTM models as particularly effective for handling historical price data due to their ability to capture temporal dependencies [7].
Machine learning techniques have further diversified prediction methodologies. The association rules algorithm and the G,M(1,1) model effectively mined influential factors from recent data for precise predictions [8]. Livieris et al. [9] extended these efforts by developing a hybrid deep learning model combining convolutional neural networks (CNN) and LSTM layers. This hybrid model improved performance by effectively capturing both short and long term dependencies. Random forest regression has also emerged as a popular choice, with studies highlighting its superior accuracy over decision trees and linear regression [10].
Comparative analyses of machine learning models have provided valuable insights. Yang et al. [11] evaluated ANN, LSTM, and SVR models, finding that SVR excelled in incorporating cryptocurrency data into gold price prediction. Other research revealed that ARIMA outperformed linear regression and random forest regression for predicting gold prices [12]. The integration of silver prices and S&P 500 indices in random forest regression models has further enhanced prediction accuracy [13]. Advanced hybrid models, such as CNN-RNN combinations, have also been explored, with RNN demonstrating notable performance in gold price forecasting [14, 15]. Studies comparing machine learning models, including linear regression, random forest, and SVM, found SVM to perform best with an R² index near 0.99, emphasizing eigenvalues' impact on prediction accuracy [16]. A review highlighted XGBoost with SHAP values as highly accurate and interpretable, while ANN effectively forecasted gold price fluctuations [17-19]. Ensemble models, such as ARIMAX and Extra Tree Regressor, outperformed individual methods, demonstrating strong predictive accuracy [20, 21]. Sadorsky [22] employed tree-based classifiers, including bagging, stochastic gradient boosting, and random forests, to predict the price direction of gold and silver ETFs, with random forests demonstrating the highest accuracy. Additionally, various ensemble models, such as a hybrid bagging ensemble, were evaluated to forecast the future momentum of gold and silver stock prices, achieving notable prediction accuracy [23]. These results underscore the growing relevance of ensemble approaches in financial forecasting. In a separate study, Vrtagic et al. [24] explored the application of ensemble methods in financial forecasting, further highlighting their effectiveness in improving prediction accuracy and robustness.
The growing influence of cryptocurrencies has prompted researchers to investigate their impact on gold price prediction. Studies have identified dynamic relationships between gold and cryptocurrencies, particularly during periods of financial uncertainty. Adebola et al. [25] employed fractional integration and co-integration techniques to reveal a limited but notable equilibrium relationship between gold and cryptocurrencies. Similarly, research during the COVID-19 pandemic highlighted an increasing correlation between Bitcoin and gold, positioning Bitcoin as "digital gold" [26-28]. Ji et al. [29] further explored the interconnectedness between gold and cryptocurrencies, noting significant volatility spillovers during financial turbulence.
Advanced methodologies have continued to uncover intricate relationships between financial variables. GARCH and copula models have shown time-varying correlations between Bitcoin, gold, and indices such as the S&P 500 [27]. Hybrid models combining cryptocurrency data with traditional indicators have consistently demonstrated improved accuracy, underscoring the evolving role of digital assets in financial forecasting [30-37]. Pearson correlation analyses have also emphasized the predictive value of relationships between cryptocurrency prices and gold [38, 39].
Despite the progress achieved in gold price prediction, most studies have focused on isolated financial indicators or specific cryptocurrencies. Our research addresses this gap by integrating a comprehensive range of variables, including NASDAQ-100 index (^NDX), Bitcoin (BTC-USD), and gold futures (GC=F). The NASDAQ-100 index (^NDX), Bitcoin (BTC-USD), and gold futures (GC=F) are uniquely positioned as predictive indicators due to their ability to capture diverse market dynamics. The NASDAQ-100 reflects economic confidence and risk sentiment, Bitcoin represents the speculative behavior of emerging digital markets, and gold futures provide direct insights into the supply and demand for gold. Integrating diverse financial indicators bridges traditional and emerging markets, offering a holistic and reliable approach to financial forecasting by enhancing predictive accuracy and reducing noise. Our methodology leverages the interconnected dynamics of assets such as the NASDAQ-100, Bitcoin, and gold futures—an integration not previously explored in the context of gold price prediction. This unique combination reinforces the importance of holistic modeling in modern financial forecasting and offers valuable insights for investors and policymakers.
Furthermore, the application of advanced preprocessing techniques—such as the Box-Cox transformation and Principal Component Analysis (PCA)—addresses multicollinearity and ensures dimensionality reduction with minimal information loss. By employing a Genetic Algorithm-optimized Multi-Layer Perceptron (MLP), we deliver a robust and scalable framework that achieves superior predictive performance, paving the way for innovative applications in financial prediction.
The remainder of this paper is structured as follows: Section 2 describes the dataset and preprocessing steps, including Box-Cox transformation and PCA. Section 3 outlines the methodology, focusing on the GA-optimized MLP regression model. Section 4 presents the results, including performance metrics and insights from permutation importance analysis. Section 5 discusses the findings in relation to existing literature and identifies limitations and areas for improvement. Finally, Section 6 concludes the paper and proposes directions for future research.
In this study, a dataset of daily high prices from 1 February 2020 to 31 May 2024 for selected financial assets was utilized to explore their potential as predictors in modeling gold price fluctuations. The dataset includes daily high prices for the NASDAQ-100 index (^NDX), Bitcoin (BTC-USD), and gold futures (GC=F), which collectively represent diverse asset classes. In modeling, high values over four consecutive days are used as input features to capture short-term trends and dependencies that influence the target variable, GC_price. A four-day window helps the model identify short-term patterns that may predict near-future movements in GC_price. This window also smooths out daily fluctuations, providing a more stable input that reduces overfitting risks and noise. Including multiple indices (^NDX, BTC-USD, GC=F) over four days enables the model to assess both cross-correlations and lagged effects, improving predictive accuracy. This data configuration is shown in Table 1 and it offers a balance between temporal detail and data stability, ideal for short-term regression models.
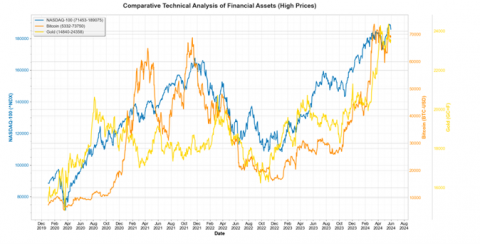
The NASDAQ-100 index, comprising leading technology companies, offers insights into stock market trends and investor sentiment, often displaying an inverse relationship with gold during market downturns. Bitcoin, as a digital asset and alternative store of value, exhibits varying correlation patterns with gold, reflecting shifts in risk tolerance among investors. Gold futures provide a direct measure of the target variable's high price movements. By preprocessing data points, we reduce variance from differing price magnitudes, allowing the model to focus on trend relationships rather than absolute values. The comparative visualization underscores the potential of these assets to capture dynamic market interactions, thereby serving as robust inputs for machine learning models predicting gold prices. Figure 1 presents a targeted visualization of daily high prices for the NASDAQ-100 index (^NDX), Bitcoin (BTC-USD), and gold futures (GC=F), focusing on the specific high points of each asset over time to reveal potential correlations and trends relevant to gold price movements.
The selection of high prices in the visualization allows a clear comparison of peak values, emphasizing moments when assets reach their upper trading thresholds, which are often associated with heightened market activity. This targeted view helps illustrate how peaks in technology stocks (^NDX) and cryptocurrency (BTC-USD) may correspond with shifts in gold futures pricing, supporting the hypothesis that certain asset highs may act as predictive signals for gold. More clarification is provided in the upcoming section.
The choice of a four-day window was validated through comparative analysis of multiple window lengths, including three, four, and five days. The four-day window was found to balance the trade-off between capturing sufficient temporal dependencies and minimizing noise or overfitting. A three-day window resulted in lower predictive accuracy, likely due to insufficient data to capture meaningful patterns, while a five-day window introduced redundant information that increased multicollinearity and reduced model efficiency. The selected window length ensures that short-term trends are adequately represented without compromising the model's robustness and interpretability.
The comparative analysis of NASDAQ-100, Bitcoin, and gold high prices reveals distinct market dynamics and potential predictive relationships during periods of economic volatility (Figure 1). Bitcoin demonstrates nonlinear price behavior that deviates significantly from traditional market indicators such as the NASDAQ-100, particularly evident during the mid-2022 market correction and the subsequent recovery phase in early 2023. Of particular interest is the observed tendency for Bitcoin price movements to occasionally align with or even precede shifts in gold prices during heightened market uncertainty, suggesting Bitcoin's emerging role as a potential leading indicator for broader market sentiment shifts. This phenomenon is most pronounced during the transition periods between market regimes, where Bitcoin exhibited characteristic volatility spikes ahead of more gradual responses in gold prices. These empirical observations challenge conventional asset classification frameworks and indicate that Bitcoin may occupy a unique position in the modern investment landscape—alternating between risk-asset behaviors during stable market conditions and safe-haven characteristics during periods of systemic stress, albeit with significantly amplified volatility compared to traditional stores of value.
Table 1. Four days input-output dataset sample
|
Interval_1_^NDX_High |
Interval_1_BTC-USD_High |
Interval_1_GC=F_High |
Interval_2_^NDX_High |
Interval_2_BTC-USD_High |
Interval_2_GC=F_High |
|
8843.65 |
7413.715 |
1552.7 |
8849.98 |
7781.867 |
1580 |
|
8849.98 |
7781.867 |
1580 |
8872.47 |
8178.216 |
1576.3 |
|
8872.47 |
8178.216 |
1576.3 |
8953.55 |
8396.738 |
1604.2 |
|
Interval_3_^NDX_High |
Interval_3_BTC-USD_High |
Interval_3_GC=F_High |
Interval_4_^NDX_High |
Interval_4_BTC-USD_High |
Interval_4_GC=F_High |
GC_price |
|
8872.47 |
8178.216 |
1576.3 |
8953.55 |
8396.738 |
1604.2 |
1555.7 |
|
8953.55 |
8396.738 |
1604.2 |
9004.55 |
8082.296 |
1555.7 |
1558.8 |
|
9004.55 |
8082.296 |
1555.7 |
9024.87 |
8166.554 |
1558.8 |
1558 |
Figure 1. Comparative analysis of the three indicators ^NDX, BTC, GC=F
To ensure the robustness of the dataset, we conducted extensive sensitivity analysis on window lengths and transformation parameters. The selected four-day window not only captures short-term temporal dependencies but also reduces noise, as evidenced by the explained variance of 96.37% using PCA. This approach offers a streamlined yet powerful representation of market dynamics, which is critical for maintaining predictive stability in volatile financial markets. Initially, the dataset was examined using a range of statistical and visualization techniques to assess its distributional properties, feature relationships, and potential issues affecting model performance. Histograms shown in Figure 2 reveal that some features have skewed distributions. Notably, the GC_price variable displays a right-skewed pattern, suggesting that transformations, such as logarithmic scaling, may enhance symmetry and improve suitability for modeling which is the output or target variable in this study.
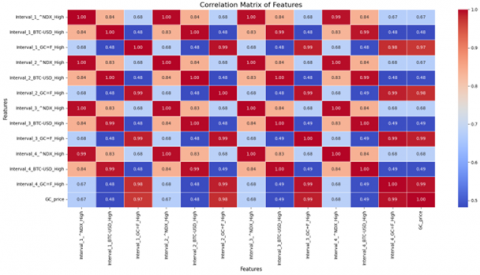
As it is shown in Figure 3, the correlation heatmap highlights strong relationships between certain features, particularly those sharing similar names across different intervals (e.g., Interval_X_GC=F_High), with correlation coefficients approaching ±1. This suggests redundancy, which may introduce multicollinearity, impacting predictive stability.
Figure 2. Features distribution of input-output data
Figure 3. Four days and GC price correlation matrix
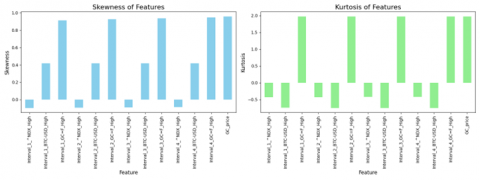
Figure 4. Skewness and kurtosis features and target variables
Figure 5. Skewness and kurtosis features after preprocessing
Figure 4 shows that several features exhibit positive skewness, particularly GC_price, which has a skewness of 0.96, indicating a concentration of lower values with a long tail toward higher values. Additionally, high kurtosis in GC_price (1.97) suggests heavy tails and the presence of potential outliers, which may affect model accuracy. In contrast, some features, such as Interval_X_BTC-USD_High, display low kurtosis, indicating a flatter distribution.
Overall, the data contains some skewed and kurtosis features, with notable correlations that may lead to redundancy. Addressing these through transformations, feature selection, and outlier management is advised to enhance model fit and prediction accuracy. To address this, highly correlated features could be either removed or combined, potentially enhancing model robustness.
The data preprocessing involved applying the Box-Cox transformation, which significantly reduced the skewness of the highly skewed feature GC_price, which had a skewness of 0.958 before the transformation. After applying the Box-Cox transformation, the skewness for this feature dropped to 0.0368, bringing it much closer to normal distribution. The Box-Cox transformation also improved the skewness of other features related to GC=F_High at different intervals, with the skewness values shifting from positive values to values closer to zero (for example, from 0.91 to -0.034 for Interval_1_GC=F_High). The transformation uses a lambda value that varies slightly across different features, indicating that each feature requires a different adjustment to correct for skewness. These lambda values (e.g., -1.68 for Interval_1_GC=F_High) reflect the optimal power transformation that best normalizes the data for each specific feature.
The Figure 5 demonstrates the impact of preprocessing on the distribution of features through Box-Cox transformations. After applying Box-Cox transformations, skewness values are minimized, bringing the distributions closer to symmetry, while kurtosis values move closer to zero, indicating a shift towards a more normal, bell-shaped distribution. This transformation standardizes the data, reducing outliers’ influence and enhancing data consistency, which is essential for model performance and reliability in subsequent analyses. The line represents the density curve or a smoothed representation of the distribution of skewness or kurtosis. It provides a continuous view of the probability density, helping to visualize the general shape and spread of the distribution. The blue bars represent the histogram of skewness or kurtosis values for the features. Each bar shows the count of features (on the y-axis) that fall into specific ranges of skewness or kurtosis values (on the x-axis).
The outlier detection method identified a significant number of outliers in the GC_price data, with all 1103 rows flagged as outliers using the interquartile range (IQR) method. Although Box-Cox normalization effectively reduces skewness, additional steps may be required to address outliers separately to enhance model accuracy.
Finally, after applying scaling (standardization), the skewness remains very low for the transformed data, particularly for GC_price, with a skewness value of 0.0457, which is almost negligible. The kurtosis value (0.367) also indicates that the data distribution is fairly close to normal, as typical kurtosis values for a normal distribution are close to 0. In summary, applying the Box-Cox transformation has successfully reduced skewness and improved the normality of several features, making the data more suitable for machine learning models, however, further work on handling outliers was done with the Principal Component Analysis (PCA). We found that instead of removing data, applying PCA with two components provides a concise representation of the data in the lower-dimensional space defined by the two principal components. The first principal component (PC1) accounts for approximately 78.88% of the variance in the data, while the second component (PC2) accounts for around 17.49%. Together, these two components explain about 96.37% of the total variance. This indicates that most of the information in the data can be captured by these two components, suggesting strong dimensionality reduction. The cumulative explained variance reaching 96.37% with just two components suggests that these two components are sufficient to represent the dataset with minimal information loss, making PCA an effective tool for reducing dimensionality in this case, as shown in the Figure 6. The data frame displays the transformed data in terms of the principal components (PC1 and PC2) along with the original target variable, GC_price. This transformation enables a clearer understanding of patterns and relationships in the data with fewer variables, which is especially valuable for visualization, feature selection, and model efficiency.
Figure 6. First vs. second principal component data variance visualization
The heatmap presented in Figure 7 illustrates the correlation between the principal compo-nents (PC1 and PC2) and the gold closing price (GC_price), with correlation values ranging from -1 to +1, where values closer to ±1 indicate stronger linear relationships. PC1 demonstrates a strong positive correlation with GC_price (r = 0.79), indicating that it captures a significant portion of the variance in the dataset that is directly related to gold price movements. This suggests that PC1 encompasses dominant underlying features that influence or reflect the behavior of gold prices. In contrast, PC2 exhibits a moderate positive correlation with GC_price (r = 0.57), implying that it provides additional but comparatively less influential information, potentially representing secondary dynamics in the data. As expected, the correlation between PC1 and PC2 is zero, reflecting their mathematical orthogonality inherent to principal component analysis, which ensures that each component encapsulates unique and uncorrelated aspects of the data. The observed relationships validate the effectiveness of PCA as a dimensionality reduction technique in this context, preserving critical information related to gold price prediction while reducing the feature space, thereby enhancing the interpretability and efficiency of subsequent modeling efforts.
Figure 7. First-second principal component vs gold price
While the Box-Cox transformation and PCA significantly improved data quality, their combined effect on model performance warrants further emphasis. The transformation of the skewed features enhanced the model's ability to learn meaningful patterns by reducing the impact of outliers and non-normal distributions. PCA’s dimensionality reduction allowed the model to focus on the most informative components, effectively addressing multicollinearity without discarding valuable data. These preprocessing steps not only led to the reduction of skewness and kurtosis but also facilitated a more stable learning process by simplifying the dataset while retaining critical variance. This combination of methods directly contributed to the model's high performance metrics, showcasing the critical role that thoughtful data preprocessing plays in enhancing prediction accuracy and robustness in complex datasets like the one used in this study.
This study presents a genetic algorithm (GA)-based optimization approach for selecting hyperparameters in a Multi-Layer Perceptron (MLP) regression model. Specifically, we focus on optimizing two critical hyperparameters: the hidden layer size and the regularization parameter (alpha), which influence the model's ability to generalize and avoid overfitting. Compared to grid or random search, Genetic Algorithm (GA) offers more efficient exploration of complex search spaces. While grid search exhaustively evaluates predefined combinations and random search samples randomly, GA mimics natural evolution, converging faster on optimal solutions in large, continuous spaces. This was crucial for tuning both the hidden layer size and regularization parameter (alpha), resulting in improved convergence and model accuracy.
The Genetic Algorithm is used to optimize the MLP hyperparameters in a regression on the transformed data of the principal components (PC1 and PC2) along with the original target variable, GC_price. The GA begins with a population of individuals, each representing a pair of hyperparameters: hidden layer size (an integer between 1 and 100) and regularization parameter (alpha, a floating point between 1x10⁻⁶ and 1 x10⁻². The fitness of each individual is evaluated by training the MLP on the training set (PC1 and PC2, GC_price) and testing on the validation set, with the Mean Squared Error (MSE) used as the fitness score. The Genetic Operators used in training are presented below.
• Selection: Tournament selection (tournament size=3) is used to choose the best candidates for crossover.
• Crossover: Two-point crossover creates offspring by combining the genetic material (hyperparameters) of two parents.
• Mutation: Mutation occurs with a 20% probability, adjusting the hidden layer size or alpha within predefined bounds.
The GA runs for 40 generations, optimizing the population to minimize the MSE. The best individual is selected, and an MLP model is trained using the optimal hyperparameters. The final model is evaluated on the test set to assess its predictive accuracy.
The machine learning model developed to predict gold prices (GC_price) based on high values from three financial assets NDX, BTC-USD, and GC=F, demonstrates a high level of predictive accuracy. The performance metrics given in Table 2 indicate that the model is successful at capturing the underlying relationships between these assets and the gold price, yielding promising results.
Table 2. Model performance metrics
|
Score (R2) |
0.97992438940244 |
|
Mean squared error (MSE) |
551.4282025660036 |
|
Root Mean Squared Error (RMSE) |
23.4825084385379 |
|
Mean absolute Error (MAE) |
17.383034187384954 |
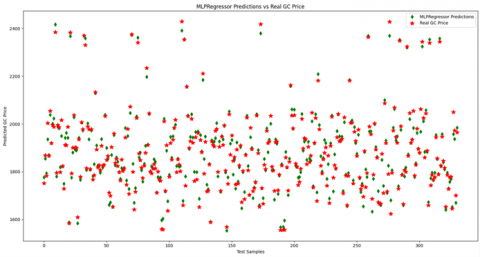
Figure 8. MLP prediction on test data (30%)
The model explains approximately 98% of the variance in gold prices, suggesting that the chosen features are highly informative for predicting gold prices as can be seen in Figure 8. This is a substantial R² value, indicating a strong fit between the model and the actual data. This high R² suggests that the model is highly effective in capturing the patterns in the historical data of gold prices with respect to the selected financial assets. Mean Squared Error (MSE = 551.43) and Root Mean Squared Error (RMSE = 23.48) indicates a moderate average squared difference between predicted and actual values with a relatively moderate MSE of 551.43. RMSE, which is in the same unit as the target variable (gold prices in USD), suggests that the predictions are, on average, off by approximately 23.48 USD. These results point to a reasonable level of predictive accuracy, especially considering that gold prices can fluctuate in the range of tens of dollars per unit. The MAE value is lower than the RMSE, further supporting the notion that the model’s errors are relatively consistent and not excessively influenced by outliers. The MAE value indicates that, on average, the model’s predictions deviate by only about 17.38 USD from the true gold prices. However, the daily price high-low difference average change for the last three years is 26.08 $. This suggests that the model performs quite well for practical purposes, offering a small margin of error that could be acceptable for real-world financial applications.
Permutation importance results reveal that the model assigns the highest importance to the feature PC1 (mean importance of 1.3456), followed by PC2 (mean importance of 0.8107). This indicates that the model relies heavily on the PC1 as the most significant predictor of gold prices, with PC2 also playing a noteworthy role. This makes sense as principal component (PC1) which describes approximately 78.88% and considering that both the stock market and cryptocurrency can exhibit correlated movements with gold, especially during periods of financial instability or market volatility.
The predictions made by the model for the observations that are out of testing and trading closely match the actual gold prices, demonstrating the model's ability to generalize well to unseen data (Table 3). The observed discrepancies seen in Table 3 between predicted and actual values (e.g., predicted 1587.6 USD vs. actual 1604.2 USD for the first observation) are within a reasonable range, further supporting the model's effectiveness in forecasting gold prices. These relatively small prediction errors are consistent with the reported RMSE and MAE values, reinforcing the model’s reliability.
Table 3. Observed discrepancies on the unseen data
|
Real |
Predicted |
|
1604.2 |
1587.6 |
|
1746.8 |
1749.8 |
|
1985 |
1947.67 |
|
1957.9 |
1923.48 |
The findings of this study align with and expand upon existing research in the domain of gold price prediction. Weng et al. [5] introduced a GA-ROSELM model that leveraged crude oil and silver prices for enhanced predictive accuracy. In contrast, our study utilized Genetic Algorithms to optimize an MLP model, incorporating a more diverse set of indicators, including NASDAQ-100 and Bitcoin, which significantly broaden the model's scope and applicability. Chandar et al. [6] demonstrated the efficacy of ELM models by combining gold, silver, crude oil, and S&P 500 data. Building on this, our work integrates a wider range of financial variables and utilizes PCA for dimensionality reduction, further improving computational efficiency and model performance. While Livieris et al. [9] utilized a hybrid CNN-LSTM model to capture temporal dependencies, our PCA-based MLP offers an alternative approach, prioritizing dimensionality reduction to balance accuracy with reduced computational overhead. Additionally, compared to the tree-based models highlighted by Tripurana et al. [13], which favored Random Forests for gold price prediction, our Genetic Algorithm-optimized MLP achieved superior performance metrics (R² = 0.98), demonstrating its competitiveness. Finally, Ben Jabeur et al. [18] used XGBoost with SHAP values for interpretability and accuracy in forecasting. Our approach simplifies interpretability through the optimization of MLP parameters without compromising accuracy, offering a streamlined yet effective solution for gold price prediction.
The novelty of the proposed approach lies in its holistic integration of diverse financial indicators—namely the NASDAQ-100 index, Bitcoin, and gold futures—combined with advanced pre-processing techniques such as the Box-Cox transformation and Principal Component Analysis (PCA). While previous studies have explored gold price prediction using individual indicators or traditional models, this work distinguishes itself by bridging traditional and emerging financial markets within a unified machine learning framework. The use of the Box-Cox transformation effectively normalizes skewed data distributions, while PCA addresses multicollinearity and reduces dimensionality without significant information loss. Together, these techniques ensure the input data is both statistically robust and computationally efficient for modeling. The exceptional performance metrics validate this innovative approach. The R² score of 0.98 indicates that the model captures approximately 98% of the variance in gold prices, demonstrating the high explanatory power of the selected features after dimensionality reduction. Contextualizing the error metrics against actual gold prices (\$1,604-\$1,985) reveals that the RMSE of \$23.48 and MAE of \$17.38 represent prediction errors of merely 1.2-1.5% relative to the asset's value—particularly noteworthy considering these error margins are smaller than gold's average daily price fluctuation of \$26.08. Analysis of model predictions on unseen data further substantiates this accuracy, with prediction errors ranging from \$3.00 (0.17%) to $37.33 (1.88%), consistently remaining below 2% of actual values. This precision is especially significant given gold's reputation as a complex asset influenced by numerous macroeconomic factors, geopolitical tensions, and market sentiment. This layered preprocessing strategy, combined with the integration of cross-market financial signals, enables the model to uncover deeper relationships and achieve strong predictive performance that could potentially inform trading decisions within gold's natural volatility range. The findings emphasize the efficacy of this multifaceted approach and its contribution to advancing predictive modelling methodologies in financial forecasting.
While the model performs well in terms of predictive accuracy, there are potential areas for improvement. First, the model relies solely on high values from the three selected assets NDX, BTC-USD, and GC=F, which may fail to capture all of the factors influencing gold prices. Incorporating additional features, such as volatility indices, macroeconomic indicators (e.g., inflation rates, interest rates), or lagged gold prices, could improve the model’s ability to capture more complex temporal and market relationships. Finally, while the current model performs well, there is potential for performance gains by exploring different models such as Random Forests, Gradient Boosting Machines, etc. While the current study focuses on high values of selected financial indicators, future work could expand the feature set to include macroeconomic factors like interest rates and inflation. Additionally, incorporating ensemble techniques like Gradient Boosting or Random Forests may further enhance model performance. Exploring real-time data integration could enable dynamic updates, offering a valuable tool for high-frequency trading and market monitoring.
Genetic Algorithms (GAs) offer several advantages for hyper parameter optimization in MLP regression models. They efficiently explore large hyper parameter spaces, enabling the identification of optimal configurations, and can simultaneously optimize multiple hyper parameters such as MLP topology, weights, biases, and regularization. GAs balance exploration and exploitation, making them more efficient than exhaustive methods like grid search and allowing faster convergence, particularly with algorithms like the Biased Random-Key Genetic Algorithm (BRKGA). However, GAs also have limitations, such as computational complexity and potential inefficiency in exploring the neighborhood of specific individuals [40-42].
When choosing between Genetic Algorithm, grid search, and random search, GAs are ideal for complex models with large hyper parameter spaces but may be less suitable if computational resources are limited. Random search or grid search might be better alternatives in such cases. Overall, GAs are effective for hyper parameter optimization due to their efficient search capabilities and ability to discover global optima, though the computational cost and exploration constraints should be carefully considered. In conclusion, GAs provide a robust and efficient method for hyper parameter optimization in MLP regression models, offering significant advantages in terms of search efficiency, adaptability, and performance improvements over traditional methods like grid search and random search [43, 44].
The hyperparameter sensitivity analysis in Figure 9 illustrates the impact of hidden layer size and the regularization parameter (alpha) on the model’s performance, with the performance measured by Mean Squared Error (MSE). Regarding hidden layer size, the graph reveals a non-monotonic relationship between layer size and MSE. Specifically, the model shows significant fluctuations in performance, with spikes in MSE at hidden layer sizes of 55 and 85 neurons, indicating a sharp degradation in performance. In contrast, the model performs optimally at a layer size of 90, where the MSE reaches its lowest point. This behavior reflects how the first principal component (PC1) of the data responds to changes in the model's architecture. The graph further highlights the effect of the regularization parameter (alpha), where minimal regularization (α ≈ 0.01) results in the lowest MSE, suggesting that lighter regularization effectively balances overfitting and underfitting. However, as alpha increases, particularly around α ≈ 0.04, the model's performance declines, evidenced by a sharp rise in MSE. These patterns indicate that PC1, which captures significant variance in the data, is sensitive to the level of regularization, and this effect may differ when considering other components or the raw data. The analysis is limited by the fact that only a coarse sampling of parameters (10 values each) was used, providing only a generalized view of the parameter space. A more refined hyperparameter optimization, exploring both PC1 and PC2 and raw data performance, could provide a deeper understanding of the model's behavior and lead to more precise adjustments for optimal performance.
Figure 9. Hyperparameter sensitivity analysis
This study presents a comprehensive machine learning approach to predicting gold prices using a combination of financial indicators, including the NASDAQ-100 index (^NDX), Bitcoin (BTC-USD), and gold futures (GC=F). By leveraging a four-day window of high values and applying data preprocessing techniques such as Box-Cox transformation and PCA, the model achieved significant dimensionality reduction and enhanced data normalization. These steps addressed issues of skewness, kurtosis, and multicollinearity, making the dataset suitable for advanced machine learning techniques.
The Genetic Algorithm-optimized Multi-Layer Perceptron (MLP) regression model demonstrated excellent predictive accuracy, explaining approximately 98% of the variance in gold prices with an R² score of 0.98. Key performance metrics, including a low RMSE (23.48 USD) and MAE (17.38 USD), highlight the model’s ability to generalize well and make accurate predictions even in a volatile market. Furthermore, the principal components PC1 and PC2 emerged as the most influential features, collectively capturing 96.37% of the variance in the dataset.
The findings underscore the potential of integrating diverse financial variables and employing robust preprocessing techniques to improve gold price prediction. This approach bridges the gap between traditional and emerging financial indicators, emphasizing the growing role of cryptocurrencies and stock indices in modern financial forecasting.
While the model performs exceptionally well, further improvements can be achieved by:
• Adding macroeconomic indicators (e.g., inflation rates, interest rates) and market volatility indices to capture broader market dynamics.
• Experimenting with ensemble methods like Random Forests or Gradient Boosting to refine predictions and potentially enhance performance.
• Developing advanced outlier handling methods to mitigate their residual impact on predictive accuracy.
This research lays the foundation for more holistic modeling approaches in financial forecasting, offering valuable insights for investors and policymakers navigating interconnected markets.
|
α |
Regularization parameter in MLP |
|
λ |
Box-Cox transformation parameter |
|
μ |
Skewness of a distribution |
|
κ |
Kurtosis of a distribution |
|
R² |
Coefficient of determination |
|
MSE |
Mean Squared Error |
|
RMSE |
Root Mean Squared Error |
|
MAE |
Mean Absolute Error |
|
PC1, PC2 |
First and second principal components |
|
GC_price |
Target gold price value |
|
^NDX_High |
NASDAQ-100 daily high |
|
BTC-USD_High |
Bitcoin daily high |
|
GC=F_High |
Gold futures daily high |
|
Interval_X |
Xth day in the 4-day window |
|
Greek symbols |
|
|
λ |
Box-Cox transformation factor |
|
α |
Regularization parameter |
|
μ |
Skewness |
|
$\kappa$ |
Kurtosis |
[1] Mourched, B., Hoxha, M., Abdelgalil, A., Ferko, N., Abdallah, M., Potams, A., Lushi, A., Turan, H.I., Vrtagic, S. (2022). Piezoelectric-based sensor concept and design with machine learning-enabled using COMSOL Multiphysics. Applied Sciences, 12(19): 9798. https://doi.org/10.3390/app12199798
[2] Mourched, B., AlZoubi, T., Vrtagic, S. (2024). Diesel adulteration detection with a machine learning-enhanced laser sensor approach. Processes, 12(4): 798. https://doi.org/10.3390/pr12040798
[3] Mourched, B., Abdallah, M., Hoxha, M., Vrtagic, S. (2023). Machine-learning-based sensor design for water salinity prediction: A conceptual approach. Sustainability, 15(14): 11468. https://doi.org/10.3390/su151411468
[4] Mourched, B., Ferko, N., Abdallah, M., Neji, B., Vrtagic, S. (2022). Study and design of a machine learning-enabled laser-based sensor for pure and sea water determination using COMSOL multiphysics. Applied Sciences, 12(13): 6693. https://doi.org/10.3390/app12136693
[5] Weng, F., Chen, Y., Wang, Z., Hou, M., Luo, J., Tian, Z. (2020). Gold price forecasting research based on an improved online extreme learning machine algorithm. Journal of Ambient Intelligence and Humanized Computing, 11: 4101-4111. https://doi.org/10.1007/s12652-020-01682-z
[6] Chandar, S.K., Sumathi, M., Sivanadam, S.N. (2016). Forecasting gold prices based on extreme learning machine. International Journal of Computers Communications & Control (June), 11(3). https://doi.org/10.15837/ijccc.2016.3.2009
[7] Wagh, A., Shetty, S., Soman, A., Maste, D. (2022). Gold price prediction system. International Journal for Research in Applied Science & Engineering Technology (IJRASET), 10(4): 2843-2848. https://doi.org/10.22214/ijraset.2022.41623
[8] Zhu, H., Wang, D. (2018). Predict the price of gold based on machine learning techniques. DEStech Transactions on Computer Science and Engineering. https://doi.org/10.12783/dtcse/mmsta2017/19700
[9] Livieris, I.E., Pintelas, E., Pintelas, P. (2020). A CNN–LSTM model for gold price time-series forecasting. Neural Computing and Applications, 32: 17351-17360. https://doi.org/10.1007/s00521-020-04867-x
[10] Ghute, M., Korde, M. (2023). Efficient machine learning algorithm for future gold price prediction. In Proceedings of the 6th International Conference on Inventive Computation Technologies (ICICT 2023), Lalitpur, Nepal, pp. 216-220. https://doi.org/10.1109/ICICT57646.2023.10134197
[11] Yang, J., De Montigny, D., Treleaven, P. (2022). ANN, LSTM, and SVR for gold price forecasting. In Proceedings of the 2022 IEEE Symposium on Computational Intelligence for Financial Engineering and Economics (CIFEr 2022), Helsinki, Finland, pp. 1-7. https://doi.org/10.1109/CIFEr52523.2022.9776141
[12] Nanthiya, D., Gopal, S.B., Balakumar, S., Harisankar, M., Midhun, S.P. (2023). Gold price prediction using ARIMA model. In Proceedings of the ViTECoN 2023 - 2nd IEEE International Conference on Vision Towards Emerging Trends in Communication and Networking Technologies, Vellore, India, pp. 1-6. https://doi.org/10.1109/ViTECoN58111.2023.10157017
[13] Tripurana, N., Kar, B., Chakravarty, S., Paikaray, B.K., Satpathy, S. (2022). Gold price prediction using machine learning techniques. In CEUR Workshop Proceedings, pp. 274-281.
[14] Zhou, S., Lai, K.K., Yen, J. (2012). A dynamic meta-learning rate-based model for gold market forecasting. Expert Systems with Applications, 39(6): 6168-6173 https://doi.org/10.1016/j.eswa.2011.11.115
[15] Goel, S., Saxena, M., Sarangi, P.K., Rani, L. (2022). Gold and silver price prediction using hybrid machine learning models. In Proceedings of the PDGC 2022 - 7th International Conference on Parallel, Distributed and Grid Computing, Solan, Himachal Pradesh, India, pp. 390-395. https://doi.org/10.1109/PDGC56933.2022.10053278
[16] Zhang, J. (2023). Impact of models and eigenvalues on gold price forecasting. Advances in Economics, Management and Political Sciences, 47(1): 50-55. https://doi.org/10.54254/2754-1169/47/20230371
[17] Wahyuningsih, S., Kusrini, Hanafi. (2023). Literature study on predicting gold prices using machine learning. DIELEKTRIKA, 10(2): 112-117. https://doi.org/10.29303/dielektrika.v10i2.335
[18] Ben Jabeur, S., Mefteh-Wali, S., Viviani, J.L. (2024). Forecasting gold price with the XGBoost algorithm and SHAP interaction values. Annals of Operations Research, 334: 679-699. https://doi.org/10.1007/s10479-021-04187-w
[19] Salis, V.E., Kumari, A., Singh, A. (2019). Prediction of gold stock market using hybrid approach. In Lecture Notes in Electrical Engineering, pp. 803-812. https://doi.org/10.1007/978-981-13-5802-9_70
[20] Shankar, P.S., Reddy, M.K. (2020). Forecasting gold prices in India using ARIMAX and machine learning algorithms. International Research Journal of Agricultural Economics and Statistics, 11(2): 299-310. https://doi.org/10.15740/has/irjaes/11.2/299-310
[21] Chandrashakar, G. (2021). Prediction and analysis of gold prices using ensemble machine learning algorithms. International Journal for Research in Applied Science & Engineering Technology (IJRASET), 9(VI): 4367-4374. https://doi.org/10.22214/ijraset.2021.36028
[22] Sadorsky, P. (2021). Predicting gold and silver price direction using tree-based classifiers. Journal of Risk and Financial Management, 14(5): 198. https://doi.org/10.3390/jrfm14050198
[23] Mahato, P.K., Attar, V. (2014). Prediction of gold and silver stock price using ensemble models. In Proceedings of the 2014 International Conference on Advances in Engineering and Technology Research (ICAETR 2014), Unnao, India, pp. 1-4. https://doi.org/10.1109/ICAETR.2014.7012821
[24] Vrtagic, S., Dogan, F. (2024). High-frequency gold price forecasting: Optimizing multi-layer perceptron with Genetic Algorithm. Mathematical Modelling of Engineering Problems, 11(12): 3235-3242. https://doi.org/10.18280/mmep.111203
[25] Adebola, S.S., Gil-Alana, L.A., Madigu, G. (2019). Gold prices and the cryptocurrencies: Evidence of convergence and cointegration. Physica A: Statistical Mechanics and its Applications, 523: 1227-1236. https://doi.org/10.1016/j.physa.2019.04.123
[26] Korauš, A., Gombár, M., Vagaská, A., Bačík, R., Korba, P., Černák, F. (2021). Bitcoin price as one of basic cryptocurrencies in relation to the basic stock market’s indicators. Entrepreneurship and Sustainability Issues, 9(2): 552-569. https://doi.org/10.9770/jesi.2021.9.2(36)
[27] Kim, J.M., Kim, S.T., Kim, S. (2020). On the relationship of cryptocurrency price with US stock and gold price using copula models. Mathematics, 8(11): 1859. https://doi.org/10.3390/math8111859
[28] Abdul Hamid, A.F., Talib, A.A. (2019). A note on Bitcoin’s price volatility. Jurnal Keuangan dan Perbankan, 23(3): 376-384. https://doi.org/10.26905/jkdp.v23i3.3103
[29] Ji, Q., Bouri, E., Lau, C.K.M., Roubaud, D. (2019). Dynamic connectedness and integration in cryptocurrency markets. International Review of Financial Analysis, 63: 257-272. https://doi.org/10.1016/j.irfa.2018.12.002
[30] Hassan, M.K., Hasan, M.B., Rashid, M.M. (2021). Using precious metals to hedge cryptocurrency policy and price uncertainty. Economics Letters, 206: 109977. https://doi.org/10.1016/j.econlet.2021.109977
[31] Rivai, A. (2023). The effect of gold, dollar and Composite Stock Price Index on cryptocurrency. International Journal of Research in Business and Social Science, 12(3): 231-236. https://doi.org/10.20525/ijrbs.v12i3.2561
[32] Thampanya, N., Nasir, M.A., Huynh, T.L.D. (2020). Asymmetric correlation and hedging effectiveness of gold & cryptocurrencies: From pre-industrial to the 4th industrial revolution. Technological Forecasting and Social Change, 159: 120195. https://doi.org/10.1016/j.techfore.2020.120195
[33] Kapar, B., Olmo, J. (2021). Analysis of Bitcoin prices using market and sentiment variables. The World Economy, 44(1): 45-63. https://doi.org/10.1111/twec.13020
[34] Teker, D., Deniz, E.A. (2019). Determinants of bitcoin prices. PressAcademia, 10(10): 17-21. https://doi.org/10.17261/pressacademia.2019.1136
[35] Klein, T., Thu, H.P., Walther, T. (2018). Bitcoin is not the new gold – A comparison of volatility, correlation, and portfolio performance. International Review of Financial Analysis, 59: 105-116. https://doi.org/10.1016/j.irfa.2018.07.010
[36] Li, C., Jiang, Z., Liu, Y., Dang, Y., Wang, Y., Yu, R. (2022). Bitcoin vs. Gold: Who is the better choice for trading? Journal of Economics and Public Finance, 8(2): 135-150. https://doi.org/10.22158/jepf.v8n2p135
[37] Teker, D., Deniz, E.A. (2020). Crypto currency applications in financial markets: Factors affecting crypto currency prices. PressAcademia, 11(1): 34-37. https://doi.org/10.17261/pressacademia.2020.1235
[38] Wibawa, A.D., Wicaksana, M.S., Pamungkas, Y. (2023). Statistical analysis to reveal factors affecting cryptocurrency prices in commodity futures trading and stock market. In Proceedings of the ICEEIE 2023 - International Conference on Electrical, Electronics and Information Engineering, Malang City, Indonesia, pp. 1-6. https://doi.org/10.1109/ICEEIE59078.2023.10334893
[39] Ariya, K., Naktnasukanjn, N., Rattanadamrongaksorn, T., Udomwong, P., Sokantika, S., Chakpitak, N. (2020). Cryptocurrencies asset pricing analysis: Evidence from Thailand markets. In Proceedings of the 15th International Joint Symposium on Artificial Intelligence and Natural Language Processing (iSAI-NLP 2020), Bangkok, Thailand, pp. 1-5. https://doi.org/10.1109/iSAI-NLP51646.2020.9376813
[40] Japa, L., Serqueira, M., Mendonca, I., Bezerra, E., Aritsugi, M., Gonzalez, P.H. (2022). A conjugated evolutionary algorithm for hyperparameter optimization. In Proceedings of the IEEE Congress on Evolutionary Computation (CEC 2022), Padua, Italy, pp. 1-9. https://doi.org/10.1109/CEC55065.2022.9870442
[41] Takenaga, S., Ozaki, Y., Onishi, M. (2025). Parameter-free dynamic fidelity selection for automated machine learning. Applied Soft Computing, 171: 112750. https://doi.org/10.1016/j.asoc.2025.112750
[42] Silva, A.A., Xavier, A.S., Silva, R.M.A. (2021). A hyperparameter search approach using BRKGA for deep feedforward neural network. In Proceedings of the International Conference on Electrical, Computer, Communications and Mechatronics Engineering (ICECCME 2021), Mauritius, Mauritius, pp. 1-6. https://doi.org/10.1109/ICECCME52200.2021.9590907
[43] Fatyanosa, T.N., Aritsugi, M. (2020). Effects of the number of hyperparameters on the performance of GA-CNN. In Proceedings of the IEEE/ACM International Conference on Big Data Computing, Applications and Technologies (BDCAT 2020), Leicester, UK, pp. 144-153. https://doi.org/10.1109/BDCAT50828.2020.00016
[44] Kim, C., Joe, I. (2024). A balanced approach of rapid genetic exploration and surrogate exploitation for hyperparameter optimization. IEEE Access, 12: 192184-192194. https://doi.org/10.1109/ACCESS.2024.3508269