Faris Muayed Ahmed Hamdi | Laith Hamzah Thuaban | Israa Abdulsatar Esmael | Omar A. Alwash* | Nadia Fakhry Ibraheem | Alaa Mohammed Mahmood
© 2026 The authors. This article is published by IIETA and is licensed under the CC BY 4.0 license (http://creativecommons.org/licenses/by/4.0/).
OPEN ACCESS
An inexpensive composite material comprising recycled rubber crumbs, polyurethane binders, and glass fiber reinforcement was formulated to develop a protective sheath for carbon steel pipes used in crude oil transportation. The composite sheath was evaluated for mechanical, thermal, electrical, and corrosion-related performance. The tensile screening data were updated using three replicate maximum-force values for each formulation. The selected B2 formulation showed the highest mean maximum load (86.47 ± 0.35 N), corresponding to a mean apparent engineering stress of 0.2184 ± 0.0009 MPa based on the recorded 13.2 mm × 30 mm cross-section. The mean elongation at break for B2 was 61.89 ± 0.25%, with estimated replicate elongation values identified in the tensile table. The pull-off adhesion test on B2, performed according to ASTM D4541 with a 20 mm dolly, showed a representative maximum force of approximately 27 N, corresponding to an apparent adhesion stress of approximately 0.086 MPa. The thermal conductivity of B2 was 0.3289 W/m·K, indicating thermal-insulation capability, and the electrical resistance reached approximately 1.2 × 10⁶ Ω. Corrosion exposure results showed lower weight loss for shielded steel coupons than for unshielded coupons after 180 days. Because adhesion, thermal conductivity, electrical resistance, Differential Scanning Calorimetry (DSC), Megger, and corrosion-exposure tests were carried out only on B2, this formulation is described as a selected promising formulation rather than a fully optimized system.
carbon steel pipelines, corrosion resistance, glass fiber reinforcement, polyurethane binder, protective composite sheath, recycled rubber crumbs
The continuous growth of the automotive industry has resulted in a substantial increase in the generation of end-of-life tires (ELTs). Waste tires constitute a significant environmental challenge due to their non-biodegradable nature, long service life, and the large storage areas required for their disposal [1]. Poorly managed discarded tires can harm soil, water, and air quality. Landfilling is among the least desirable disposal options and raises further concerns: tires may absorb methane gas, which can cause swelling, destabilize landfill structures, and contribute to long-term environmental contamination [2]. As a result, developing sustainable methods to recycle and recover waste tires has become a worldwide priority.
Several methods have been developed to recycle waste tires and recover value from them, among them pyrolysis and devulcanization [3, 4]. Tire rubber is thermochemically decomposed at high temperatures in the absence of oxygen to produce pyrolysis oil, gas, and carbonized solid remains in pyrolysis [5]. The main point of difference from combustion is that pyrolysis is a controlled process that doesn't participate in oxidation reactions [6]. Devulcanization does the opposite: it cleaves sulfur cross-links introduced by vulcanization, leading to technical and polymeric reprocessability of the material to be reused in new products [7, 8]. The two technologies, taken together, conserve resources while also supporting circular-economy principles.
Many disposal and application alternatives have proven successful in engineering. Historically, it has been proposed that sludge can be used in hot-mix asphalt, cementitious materials, construction products, artificial reefs, and alternative fuel systems [9-12]. Thermoplastic elastomer composites containing recycled rubber have also been extensively researched, mainly because the material provides flexibility, durability, impact resistance, and cost benefits [13, 14]. The combination of these characteristics demonstrates that recycled rubber may be a viable candidate for protective systems exposed to mechanical and environmental loadings.
Oil pipelines represent a vital part of the energy transport network that covers the globe. Corrosion, operational mechanical stress, and environmental degradation [15] have a decisive impact on their long-term performance. Corrosion is one of the top reasons for pipeline failure amongst all the factors described above. It can be in the form of uniform, galvanic, pitting, stress-corrosion cracking, and intergranular corrosion [16]. Metallic pipe materials degrade faster when exposed to corrosive species, which include water, dissolved salts, and acidic and sulfur-containing substances, and atmospheric moisture [17]. This starts when an electrochemical system comprises, simultaneously, anodic and cathodic components with the electrolyte [18]. These conditions are common in crude oil pipelines, whether they are nested or above ground. Differences in temperature, prolonged exposure to sunlight, and mechanical loads can accelerate degradation, making the material more susceptible to cracks and structural failure [19-22]. Carbon steel mainly oxidizes, whereby a volatile iron oxide layer is formed upon the reaction of oxygen with the steel (reaction), further advancing the process itself [23, 24].
In fact, carbon steel is one of the most widely used materials for constructing oil pipelines, because it provides favorable mechanical properties with wide accessibility and economic advantages [25]. However, the harsh service environments always lead to corrosion resistance degradation and an unstable oxide layer. Authors have proposed different approaches to mitigate these effects, including protective coatings and cathodic protection systems based on sacrificial anodes or impressed current [26, 27]. Zinc- and aluminum-based metallic coatings have been widely used for corrosion protection [28]. Their performance may be limited by costs, service life, maintenance needs, or the fact that they do not perform multiple protective functions simultaneously. Thereby increasing the demand for sustainable, low-cost materials that can serve at once to offer mechanical protection, thermal & electrical insulation, and corrosion resistance.
In this study, a new composite sheath is developed that provides multiple functions for crude oil pipeline protection in a polymer matrix. The material, which consists of recycled tire rubber, a polyurethane binder, and glass-fiber reinforcement, reinforces the pipeline while delivering thermal and electrical insulation and enhanced corrosion resistance. Equally, it converts discarded tires into an engineering material, thus facilitating the sustainable management of waste and providing a solution for the pipeline's long-term continuity threat.
2.1 Materials
The raw materials used in this study included recycled tire rubber crumbs with a particle size of 2–3 mm, obtained from local markets, and recycled tire rubber granules with a particle size of 1–1.5 mm, also obtained from local markets. A polyurethane binder (grade C1) and a polyurethane binder (grade Y1) were supplied by Yayun Company, Hong Kong, China. A polyurethane adhesive (SAR 306) was supplied by Kenda Farben Company, Italy, and was used to bond the composite sheath to the steel pipe.
Chopped glass fibers (brand name CYC) with a fiber length of 3–12 mm and a woven mat orientation were supplied by Sichuan Chang Yang Company, China. Aluminum foil was used as the release layer during composite fabrication.
Equipment: Electronic balance (Sartorius). Steel frames 5 × 5 cm. Carbon steel pipes are shown in Figure 1. Mechanical stirrer. Rubber rings.
Figure 1. The carbon steel oil pipe without the protective composite shield
2.2 Methods
The composite material was prepared in a 1-liter glass bowl using different ratios of the rubber crumbs and polyurethane, as shown in Table 1. The contents of the bowl were mixed at 500 rpm for 10 min to ensure homogeneous dispersion. The mixture was then subjected to vacuum degassing for 5 min to remove entrapped air bubbles before casting into a (20 × 20 × 1) cm wooden frame. Samples were cured at 25 ± 3 ℃ and 50 ± 5% relative humidity for 24-36 h. The final composite thickness was about 10 ± 0.1 mm. The density was measured using the Archimedes method and found to be 0.92 g/cm3, while the porosity was calculated as 4.13%. The protective composite material shield was then bonded to the carbon steel pipe using SAR 306 polyurethane adhesive supplied by Kenda Farben Company. The assembly was secured with rubber rings and allowed to cure for 24 h, as shown in Figure 2.
Table 1. The prepared composite material samples using 2-3 mm granular size of the rubber crumbs
|
Sample |
Rubber Crumb % |
PU Binder Grade |
PU Binder % |
Fiber Glass % |
|
A1 |
69.5 |
C1 |
29.5 |
1 |
|
A2 |
79.5 |
C1 |
19.5 |
1 |
|
A3 |
89.5 |
C1 |
9.5 |
1 |
|
B1 |
69.5 |
Y1 |
29.5 |
1 |
|
B2 |
79.5 |
Y1 |
19.5 |
1 |
|
B3 |
89.5 |
Y1 |
9.5 |
1 |
Figure 2. The carbon steel oil pipe with the protective composite shield
Various tests were performed to assess the composite protective shield's physical properties, such as mechanical, thermal, electrical, and corrosion-resistance tests, to verify its operation and adhesion on carbon steel pipelines. These tests were designed to assess the suitability of this composite sheath to serve as a sort of skin in real-world applications designed to encase crude oil pipelines.
3.1 Tensile strength of the composite protective shield
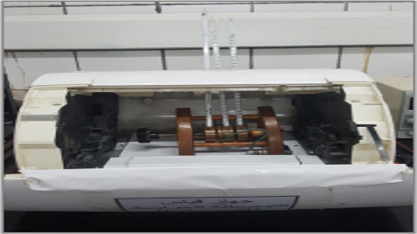
Tensile properties of the composite protective shield were measured in this study using Tinius Olsen H50 KT universal testing machine following the ASTM D412 [29] standard, as shown in Figure 3.
The testing machine parameters were as follows: gauge length (25 mm), crosshead speed (500 mm/min). The tensile test was employed to assess both the cohesion of the composite material and its mechanical integrity under applied loads.
Figure 3. The tensile strength test device used in this research
The tensile response of the composite shield is important for assessing the cohesion and mechanical integrity of the protective material. The six formulations listed in Table 1 were subjected to preliminary tensile screening using the machine-generated load-extension record available for the first replicate and additional maximum-force values for the second and third replicates. The recorded effective cross-sectional dimensions were kept constant for the replicate calculations of each formulation. Tensile strength was calculated for each replicate as maximum force divided by the recorded cross-sectional area, and the results are reported as mean ± standard deviation (n = 3). Where final length values were not available for R2 and R3, elongation at break was estimated from the proportional elongation response of the corresponding R1 curve and is marked with an asterisk in Table S1. The stress values were calculated using the following equation:
σ = F/A
where,
σ = engineering stress (MPa)
F = applied force (N)
A = original cross-sectional area (mm2)
Tensile Strength (MPa) = Maximum Force (N)/ (Width (mm) × Thickness (mm)
The detailed replicate tensile dataset and the replicate-based statistical summary are provided in Supplementary Tables S1 and S2, respectively.
Table S1 reports the individual replicate data, including specimen dimensions, area, maximum force, tensile strength, initial length, final length, and elongation at break. Table S2 summarizes the mean ± standard deviation values used for formulation screening. Asterisked elongation values indicate estimated values based on the proportional elongation response of the corresponding R1 record and should be replaced by direct machine-recorded values when available.
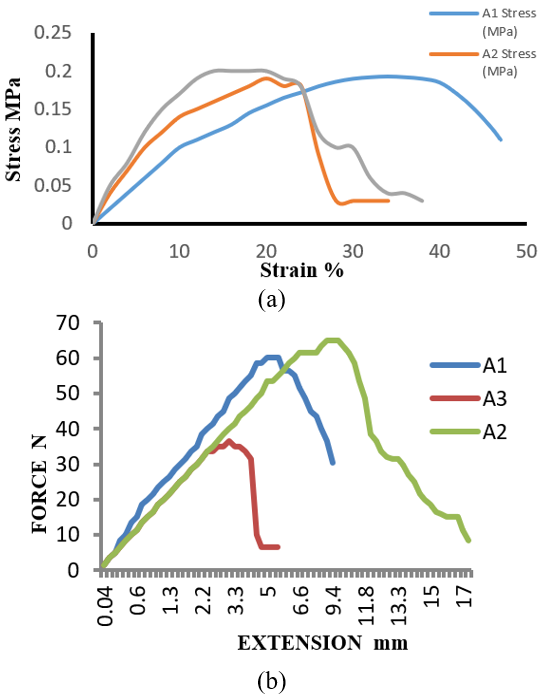
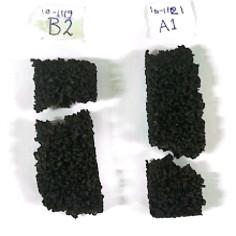
The machine-generated tensile files were rechecked and converted into representative engineering stress-strain curves using the recorded thickness, width, and gauge length. The detailed replicate tensile data are provided in Table S1, and the replicate-based tensile summary is presented in Table S2, while the representative R1 stress-strain curves for the polyurethane binders C1- and Y1-based formulations and the relation between the imposed force in Newton and the extension of the sample are shown in Figures 4 and 5, respectively. Figure 6 shows fractured specimens after tensile testing. Among the C1-based formulations, A3 showed the highest mean apparent stress (0.1987 ± 0.0005 MPa), followed by A1 (0.1909 ± 0.0008 MPa) and A2 (0.1694 ± 0.0016 MPa).
Figure 4. PU binder C1-based composite formulations: (a) stress-strain curves, (b) the tensile strength data
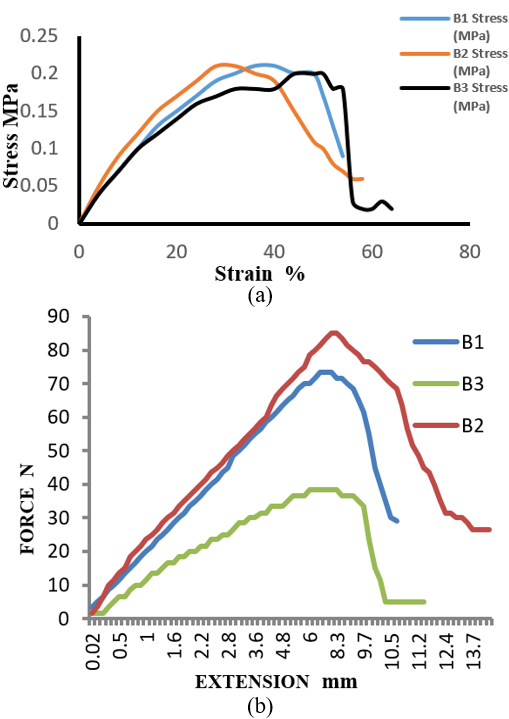
Figure 5. PU binder Y1-based composite formulations: (a) stress-strain curves, (b) the tensile strength data
Figure 6. Representative fractured specimens after tensile testing (B2 and A1)
For the Y1-based formulations, B2 showed the highest mean maximum load (86.47 ± 0.35 N) and the highest mean apparent engineering stress (0.2184 ± 0.0009 MPa), followed by B1 (0.2007 ± 0.0015 MPa) and B3 (0.1923 ± 0.0033 MPa). Based on this first-stage screening, B2 was selected as the most promising formulation for subsequent performance tests. The previous unsupported 90 MPa tensile-strength statement was removed because the recalculated stress from the available raw data is in the sub-MPa range. The tensile results should therefore be interpreted as preliminary screening data for formulation selection, not as definitive full optimization evidence.
Elongation at break measures the extent to which a material elongates before fracturing during a tensile test. Also known as percentage elongation, it was calculated using Eq. (1):
Elongation at break $(\%)=\left\lceil\frac{\left(L_f-L_0\right)}{L_0}\right\rceil \times 100$ (1)
where,
L0 = original sample length
Lf = final sample length at fracture
The mean elongation at break values ranged from 47.08 ± 0.20% for A1 to 69.55 ± 0.16% for A3. The selected B2 formulation showed a mean elongation at break of 61.89 ± 0.25%. Because several R2 and R3 final-length values were estimated from the proportional R1 response, these elongation values are marked as estimated in the table and should be replaced by direct machine-recorded values when available.
3.2 Adhesion strength between the composite shield and the steel pipe
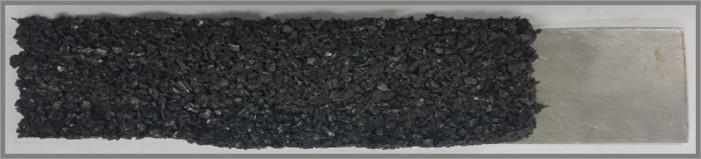
The adhesion strength between the composite protective shield and the carbon steel pipe was evaluated using the ASTM D4541 pull-off test. Five test samples were prepared. The metal surfaces were then cleaned thoroughly before the B2 composite shield was bonded to a section of the steel pipe using SAR 306 polyurethane adhesive, as illustrated in Figure 7. The bonded area was 3 cm2, and the test was conducted at 25 ℃ and 40% relative humidity. Aluminum dollies with a diameter of 20 mm were bonded to the composite sheath using a two-component epoxy adhesive and allowed to cure for 24 h at room temperature before testing. The pull-off load was applied perpendicularly to the coating surface at a constant rate of 2 mm/min until failure occurred. The maximum pull-off force was recorded and converted to adhesion strength using the cross-sectional area (A) of a 20 mm dolly according to the following equations:
A = π (20/2)2 = 314.16 mm2
Figure 7. The tensile strength test sample for the adhesion power between the protective composite shield and the pipe
The failure mode was visually examined and classified as a mixed failure because it was a combination of adhesive failure (occurs at the interface between the coating and steel) and cohesive failure (occurs inside the coating itself).
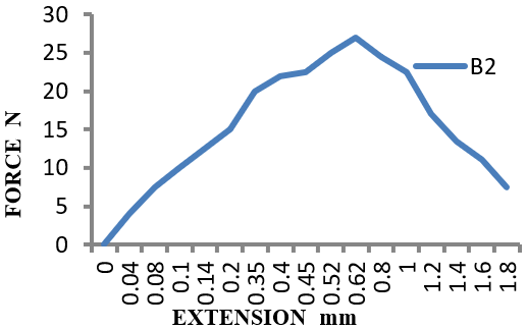
As shown in Figure 8, the representative pull-off curve for the B2 bonded system reached a maximum recorded force of approximately 27 N. Using the 20 mm dolly area (314.16 mm²), this corresponds to an apparent adhesion stress of approximately 0.086 MPa. This result is reported as a representative B2 pull-off response under the stated testing conditions. Because replicate-level pull-off values were not available in a form suitable for statistical treatment, no standard deviation (SD), standard error (SE), confidence interval, or error bar is reported for this test.
Figure 8. Representative pull-off response of B2 sample bonded to the pipe
3.3 Thermal conductivity of the composite shield
Thermal conductivity is an essential property for the insulation performance assessment of protective pipeline coatings. In this work, the thermal conductivity was measured in the composite shield by using the Lee disk method, which is typically used for measuring these thermal properties in materials of low thermal conductivity such as polymers, rubber, and wood [30]. Figure 9 illustrates the experimental setup.
Figure 9. Lee disk apparatus
The selected B2 formulation showed a thermal conductivity of 0.3289 W·m⁻¹·K⁻¹, indicating thermal-insulation capability under the tested conditions. The thermal conductivity values of the composite shield and some traditional materials are given in Table 2. Since thermal conductivity was measured only for B2, this value should not be generalized to all formulations. Various alternative measurement techniques (e.g., transient hot disk method, laser flash analysis) have been reported in the literature for rubber-based materials [31, 32].
Table 2. Comparison of the thermal conductivity of the shield with a number of other materials
|
Substance |
Thermal Conductivity K (W·m⁻¹·K⁻¹) |
|
Composite shield |
0.3289 |
|
Aluminum |
205.9 |
|
Copper |
384.1 |
|
Steel |
46.9 |
|
Brick |
0.63 |
|
Concrete |
0.92 |
|
Glass |
0.71 |
|
Graphite |
5.0 |
|
Sand |
0.389 |
|
wood |
0.126 |
3.4 Electrical resistance of the composite shield
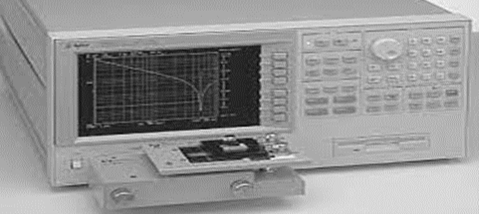
The electrical insulating properties of the composite shield were examined by a precision impedance analyzer (Agilent 4294A) as displayed in Figure 10. This enables precise measurements of impedance and electric resistance across multiple frequencies.
Figure 10. Precision impedance analyzer (Agilent 4294A)
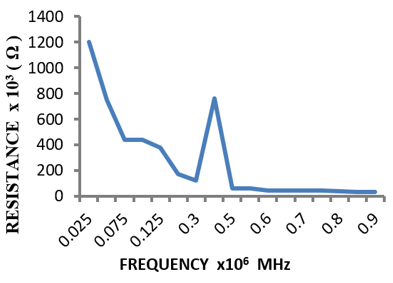
As shown in Figure 11, the selected B2 composite shield exhibited high electrical resistance, reaching approximately 1.2 × 10⁶ Ω under the tested conditions. This behavior is consistent with the insulating nature of rubber-rich materials. Minor measurement difficulties were encountered due to the surface roughness caused by rubber crumbs, as the impedance analyzer requires smooth surfaces for continuous analysis. Since this measurement was performed only for B2, the result is presented as a representative response of the selected formulation rather than a comparative result for all six formulations.
Figure 11. Precision impedance analyzer data for the electrical resistance of the selected B2 sample
3.5 Corrosion resistance performance
The corrosion resistance of the composite shield was evaluated using the average percentage weight loss (APWL) [33, 34]. Metals suffer from deterioration when exposed to moisture and aggressive environmental conditions; this phenomenon is called corrosion. The rates of corrosion are directly proportional to the moisture content of soil or air [35]. Also, the main factors that affect the extent of corrosion are the duration of exposure [35], the pH value, the presence of chlorides and sulphides, the presence of bacteria, and the existence of stray currents. All these factors affect the oil pipelines when buried in soil or left exposed to the air [35].
Four carbon steel coupons, the main type of steel used in oil pipeline manufacturing, were used in this test. The two coupons (A, B) were kept without shielding, while the other two (C, D) were shielded by using the composite material prepared in this research. The samples were buried in 25 cm of moist soil for 6 months (180 days). After corrosion exposure, the samples were rinsed with distilled water and cleaned using a 15% HCl solution to remove corrosion products. Following cleaning, the samples were thoroughly washed with distilled water, dried, and weighed. All samples were subjected to the same cleaning protocol to ensure consistency in the comparative corrosion evaluation. However, it should be noted that aggressive acid cleaning can influence the absolute weight-loss measurements. The steps were according to ASTM G1 Standard Practice for Preparing, Cleaning, and Evaluating Corrosion Test Specimens [28]. The samples were dried in an oven at 70 ℃ for 15 min, then left to cool in a desiccator. The samples were then weighed, and the final weight was compared with the initial weight; then the APWL was calculated (Table 3). The data in Table 3 showed that the composite protective shield gave good protection against the elements of nature that cause corrosion. The APWL of the shielded samples was approximately 50% lower than that of the unshielded samples because the composite shield limited the metal's contact with corrosive environmental factors such as moisture, air, and chemicals.
Table 3. The average percentage weight loss (APWL) data for the shielded and unshielded samples of carbon steel
|
Carbon Steel Sample |
Initial Weight(g) |
Weight after 30 Days (g) |
Weight after 60 Days (g) |
Weight after 90 Days (g) |
Weight after 180 Days (g) |
Lost Weight (g) |
|
A |
14.53 |
14.50 |
14.46 |
14.41 |
14.39 |
0.14 |
|
B |
13.60 |
13.58 |
13.52 |
13.48 |
13.45 |
0.15 |
|
C |
14.25 |
14.22 |
14.20 |
14.18 |
14.17 |
0.08 |
|
D |
14.06 |
14.04 |
14.01 |
14.00 |
13.99 |
0.07 |
3.5.1 Soil characterizations
The soil is alluvial silty clay texture, with a porosity of 42%, a pH = 7.7 slightly alkaline, a CaCO3 of 25%, an exchangeable sodium percentage (ESP) of 20%, and a temperature range of (10-40) ℃.
3.6 Benchmark comparison
The benchmark comparison was revised to avoid unsupported superiority claims. The tensile response obtained in this study was derived from replicate screening data based on the measured specimen geometry, but it is still not directly comparable with literature tensile-strength values reported for conventional epoxy or polyethylene coatings, which may use different specimen geometries, standards, and processing conditions. Therefore, the comparison in Table 4 is limited to reporting the recalculated apparent tensile response and thermal conductivity without claiming that the developed composite is mechanically superior to conventional coatings.
Table 4. A comparison between the properties of the composite shield prepared in this study and other coating materials used for carbon steel pipelines
|
Coating Material |
Tensile Response |
Thermal Conductivity |
|
Epoxy coating |
60–70 MPa [36] |
0.35–0.45 W·m⁻¹·K⁻¹ [37] |
|
Polyethylene |
20–30 MPa [38] |
0.42 W·m⁻¹·K⁻¹ [39, 40] |
|
This study |
0.2184 ± 0.0009 MPa (mean apparent B2 screening) |
0.3289 W·m⁻¹·K⁻¹ |
The measured thermal conductivity of B2 was 0.3289 W·m⁻¹·K⁻¹, which is lower than the literature values listed for epoxy and polyethylene in Table 4. Lower thermal conductivity is generally associated with greater resistance to conductive heat transfer, although the effective thermal behavior of a composite also depends on its porosity, pore morphology, constituent distribution, and interfacial structure [41]. The B2 result therefore indicates thermal-insulation potential under the tested conditions, but direct comparison using specimens of identical geometry and a common testing standard is still required.
Overall, the results indicate that the selected B2 formulation may provide a useful combination of thermal insulation, electrical insulation, and corrosion-barrier behavior. However, further direct replicate measurements for all performance tests and comparative evaluation of all formulations are required before definitive optimization or superiority claims can be made.
3.7 Thermal stability measurement of the protective composite coating
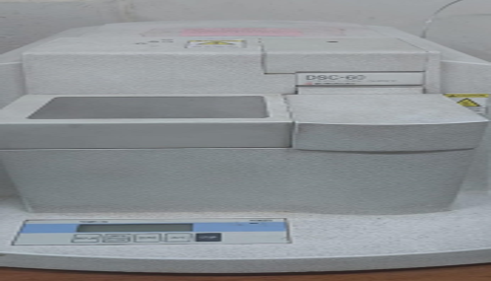
To determine the resistance of the composite coating to high temperatures, the change in its physical properties was studied using a Shimadzu Differential Scanning Calorimetry (DSC) 60 (Figure 12). This method is used to demonstrate the thermal changes that occur in the polymer when it is heated.
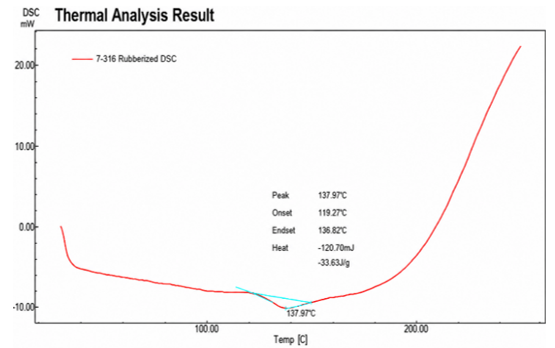
The results obtained from the DSC, shown in Figure 13, indicate that the composite coating maintained its physical properties up to 137.97 ℃, after which the model began to soften. This softening state continued until 200 ℃, after which the model began to gradually degrade with increasing temperature. This means that the composite coating provides additional protection for the oil pipeline even at relatively high temperatures.
Figure 12. Shimadzu Differential Scanning Calorimetry (DSC) 60 device
Figure 13. Differential Scanning Calorimetry (DSC) diagram for the B2 composite sample
3.8 Formulation screening and selection
The prepared composite formulations were first evaluated through preliminary tensile screening to compare their mechanical response and elongation behavior. This screening step was used to identify the most promising formulation for subsequent detailed performance evaluation. The representative stress-strain behavior of the samples prepared using C1 and Y1 polyurethane binders is shown in Figures 4 and 5, respectively. The relationship between the applied force (N) and sample extension (mm) for the samples prepared using C1 and Y1 polyurethane binders is shown in Figures 4(a) and 5(a), respectively. Among the C1-based formulations, sample A3 showed the highest mean apparent tensile response, whereas among the Y1-based formulations, sample B2 showed the highest overall mean apparent tensile response.
Compared with the other prepared samples, B2 showed the highest mean maximum load and highest mean apparent engineering stress in the tensile-screening summary, together with a mean elongation at break of 61.89 ± 0.25%. Therefore, B2 was selected as a promising representative formulation and was subjected to the subsequent performance evaluation, including adhesion strength, thermal conductivity, electrical resistance, DSC, Megger, and corrosion-exposure tests. The formulation screening and selection basis are summarized in Table 5. This selection should not be interpreted as proof that B2 is universally optimal across all performance categories because the later tests were performed only on B2.
Table 5. First-stage formulation screening matrix and justification for selecting B2
|
Sample |
Binder Type |
Rubber Crumb (%) |
PU Binder (%) |
Glass Fiber (%) |
First-Stage Screening Test |
Main Observed Response |
Selection Decision |
|
A1 |
C1 |
69.5 |
29.5 |
1.0 |
Tensile screening |
0.1909 ± 0.0008 MPa mean apparent stress; lower than A3 among C1 |
Not selected |
|
A2 |
C1 |
79.5 |
19.5 |
1.0 |
Tensile screening |
0.1694 ± 0.0016 MPa mean apparent stress in tensile screening |
Not selected |
|
A3 |
C1 |
89.5 |
9.5 |
1.0 |
Tensile screening |
Highest mean apparent response among C1-based formulations (0.1987 ± 0.0005 MPa) |
Not selected |
|
B1 |
Y1 |
69.5 |
29.5 |
1.0 |
Tensile screening |
0.2007 ± 0.0015 MPa mean apparent stress; lower than B2 |
Not selected |
|
B2 |
Y1 |
79.5 |
19.5 |
1.0 |
Tensile screening |
Highest overall mean apparent stress (0.2184 ± 0.0009 MPa) and selected for further tests |
Selected as a promising representative |
|
B3 |
Y1 |
89.5 |
9.5 |
1.0 |
Tensile screening |
0.1923 ± 0.0033 MPa mean apparent stress; lower than B2 |
Not selected |
3.9 Statistical reporting and experimental variability
The tensile screening results are now reported as mean ± standard deviation for maximum force and calculated tensile strength based on three replicate values for each formulation. Representative stress-strain curves are shown for the available machine-generated R1 records, while the detailed replicate data and summary statistics are provided in Tables S1 and S2, respectively. Directly machine-recorded final lengths were unavailable for some R2 and R3 specimens, so their elongation values were estimated from the proportional R1 response and marked with an asterisk. ANOVA and confidence intervals were not reported because the dataset is still limited. The later adhesion, thermal, electrical, DSC, Megger, and corrosion-exposure tests were performed only on B2.
The study evaluated a composite material made from recycled tire rubber, polyurethane binders, and small quantities of glass-fiber reinforcement as a practical protective sheath for carbon-steel pipelines. Replicate tensile screening and performance tests were conducted only on B2, and the revised findings point to that formulation as promising. Of all the formulations screened, B2 gave the highest mean maximum load, 86.47 ± 0.35 N, as well as the highest mean apparent engineering stress, 0.2184 ± 0.0009 MPa. The formulation also exhibited thermal-insulation behavior and high electrical resistance. After 180 days, shielded coupons had lower corrosion weight loss than unshielded coupons. Still, the study does not claim that B2 is universally optimal, because the key performance tests were conducted only for B2. Further replicated testing of all formulations is required before definitive optimization or statistical claims can be made.
|
APWL |
average percentage weight loss used to evaluate corrosion rate, % |
|
ASTM |
American Society for Testing and Materials |
|
B2 |
selected representative composite formulation |
|
C1 |
polyurethane binder grade C1 |
|
DSC |
Differential Scanning Calorimetry |
|
ESP |
exchangeable sodium percentage in soil, % |
|
f |
electrical frequency during impedance analysis, MHz |
|
HCl |
hydrochloric acid used for cleaning corrosion products |
|
K |
thermal conductivity of the composite material, W·m⁻¹·K⁻¹ |
|
L0 |
initial length of the tensile test specimen, mm |
|
Lf |
final length of the specimen at fracture, mm |
|
PU |
polyurethane binder |
|
PU-Y1 |
polyurethane binder grade Y1 |
|
R |
electrical resistance of the composite material, Ω |
|
Y1 |
polyurethane binder grade Y1 |
|
Greek symbols |
|
|
σ |
engineering stress of the composite material, MPa |
|
Subscripts |
|
|
0 |
initial |
|
a |
adhesion |
|
f |
final or fracture |
|
t |
time |
Table S1. Detailed replicate tensile data for the prepared composite formulations
|
Sample |
Binder Type |
Rubber Crumb (%) |
PU Binder (%) |
Glass Fiber (%) |
Replicate |
Width (mm) |
Thickness (mm) |
Area (mm²) |
Maximum Force (N) |
Tensile Strength (MPa) |
Initial Length L₀ (mm) |
Final Length Lf (mm) |
Elongation at Break (%) |
|
A1 |
C1 |
69.5 |
29.5 |
1.0 |
R1 |
28.00 |
11.50 |
322.00 |
61.50 |
0.191 |
25.00 |
36.78 |
47.10 |
|
A1 |
C1 |
69.5 |
29.5 |
1.0 |
R2 |
28.00 |
11.50 |
322.00 |
61.20 |
0.190 |
25.00 |
36.72* |
46.88* |
|
A1 |
C1 |
69.5 |
29.5 |
1.0 |
R3 |
28.00 |
11.50 |
322.00 |
61.70 |
0.192 |
25.00 |
36.82* |
47.27* |
|
A2 |
C1 |
79.5 |
19.5 |
1.0 |
R1 |
22.00 |
9.80 |
215.60 |
36.50 |
0.169 |
25.00 |
40.98 |
63.92 |
|
A2 |
C1 |
79.5 |
19.5 |
1.0 |
R2 |
22.00 |
9.80 |
215.60 |
36.90 |
0.171 |
25.00 |
41.16* |
64.62* |
|
A2 |
C1 |
79.5 |
19.5 |
1.0 |
R3 |
22.00 |
9.80 |
215.60 |
36.20 |
0.168 |
25.00 |
40.85* |
63.40* |
|
A3 |
C1 |
89.5 |
9.5 |
1.0 |
R1 |
27.50 |
11.90 |
327.25 |
65.00 |
0.199 |
25.00 |
42.38 |
69.52 |
|
A3 |
C1 |
89.5 |
9.5 |
1.0 |
R2 |
27.50 |
11.90 |
327.25 |
64.90 |
0.198 |
25.00 |
42.35* |
69.41* |
|
A3 |
C1 |
89.5 |
9.5 |
1.0 |
R3 |
27.50 |
11.90 |
327.25 |
65.20 |
0.199 |
25.00 |
42.43* |
69.73* |
|
B1 |
Y1 |
69.5 |
29.5 |
1.0 |
R1 |
30.00 |
12.20 |
366.00 |
73.50 |
0.201 |
25.00 |
38.68 |
54.72 |
|
B1 |
Y1 |
69.5 |
29.5 |
1.0 |
R2 |
30.00 |
12.20 |
366.00 |
72.90 |
0.199 |
25.00 |
38.57* |
54.27* |
|
B1 |
Y1 |
69.5 |
29.5 |
1.0 |
R3 |
30.00 |
12.20 |
366.00 |
74.00 |
0.202 |
25.00 |
38.77* |
55.09* |
|
B2 |
Y1 |
79.5 |
19.5 |
1.0 |
R1 |
30.00 |
13.20 |
396.00 |
86.50 |
0.218 |
25.00 |
40.48 |
61.92 |
|
B2 |
Y1 |
79.5 |
19.5 |
1.0 |
R2 |
30.00 |
13.20 |
396.00 |
86.10 |
0.217 |
25.00 |
40.41* |
61.63* |
|
B2 |
Y1 |
79.5 |
19.5 |
1.0 |
R3 |
30.00 |
13.20 |
396.00 |
86.80 |
0.219 |
25.00 |
40.53* |
62.13* |
|
B3 |
Y1 |
89.5 |
9.5 |
1.0 |
R1 |
20.00 |
10.00 |
200.00 |
38.50 |
0.193 |
25.00 |
41.38 |
65.52 |
|
B3 |
Y1 |
89.5 |
9.5 |
1.0 |
R2 |
20.00 |
10.00 |
200.00 |
37.80 |
0.189 |
25.00 |
41.08* |
64.33* |
|
B3 |
Y1 |
89.5 |
9.5 |
1.0 |
R3 |
20.00 |
10.00 |
200.00 |
39.10 |
0.196 |
25.00 |
41.64* |
66.54* |
Table S2. Replicate-based tensile screening summary for the prepared composite formulations
|
Sample |
Binder Type |
n |
Mean Maximum force ± SD (N) |
Mean Tensile Strength ± SD (MPa) |
Mean Elongation at Break ± SD (%) |
Decision |
|
A1 |
C1 |
3 |
61.47 ± 0.25 |
0.1909 ± 0.0008 |
47.08 ± 0.20* |
Not selected |
|
A2 |
C1 |
3 |
36.53 ± 0.35 |
0.1694 ± 0.0016 |
63.98 ± 0.61* |
Not selected |
|
A3 |
C1 |
3 |
65.03 ± 0.15 |
0.1987 ± 0.0005 |
69.55 ± 0.16* |
Not selected |
|
B1 |
Y1 |
3 |
73.47 ± 0.55 |
0.2007 ± 0.0015 |
54.69 ± 0.41* |
Not selected |
|
B2 |
Y1 |
3 |
86.47 ± 0.35 |
0.2184 ± 0.0009 |
61.89 ± 0.25* |
Selected for further tests |
|
B3 |
Y1 |
3 |
38.47 ± 0.65 |
0.1923 ± 0.0033 |
65.46 ± 1.11* |
Not selected |
[1] Kazemi, M., Parikhah Zarmehr, S., Yazdani, H., Fini, E. (2023). Review and perspectives of end-of-life tires applications for fuel and products. Energy & Fuels, 37(15): 10758-10774. https://doi.org/10.1021/acs.energyfuels.3c00459
[2] Markl, E., Lackner, M. (2020). Devulcanization technologies for recycling of tire-derived rubber: A review. Materials, 13(5): 1246. https://doi.org/10.3390/ma13051246
[3] Wiśniewska, P., Wang, S.F., Formela, K. (2022). Waste tire rubber devulcanization technologies: State-of-the-art, limitations and future perspectives. Waste Management, 150: 174-184. https://doi.org/10.1016/j.wasman.2022.07.002
[4] Jiang, H., Shao, J.A., Zhu, Y.J., et al. (2023). Production mechanism of high-quality carbon black from high-temperature pyrolysis of waste tire. Journal of Hazardous Materials, 443: 130350. https://doi.org/10.1016/j.jhazmat.2022.130350
[5] Oenema, J., Liu, H.R., De Coensel, N., et al. (2022). Review on the pyrolysis products and thermal decomposition mechanisms of polyurethanes. Journal of Analytical and Applied Pyrolysis, 168: 105723. https://doi.org/10.1016/j.jaap.2022.105723
[6] Marković, G., Marinović-Cincović, M., Samaržija-Jovanović, S., Jovanović, V., Budinski-Simendić, J. (2020). Crosslinking of polymers: Rubber vulcanization. In Reactive and Functional Polymers, Springer International Publishing, Cham, pp. 117-134. https://doi.org/10.1007/978-3-030-45135-6_5
[7] Haq, Z.U., Ren, T., Yue, X.Y., et al. (2025). Progress in devulcanization of waste tire rubber: Upcycling towards a circular economy. Express Polymer Letters, 19(3): 258-293. https://doi.org/10.3144/expresspolymlett.2025.20
[8] Vasiliu, L., Gencel, O., Damian, I., Harja, M. (2023). Capitalization of tires waste as derived fuel for sustainable cement production. Sustainable Energy Technologies and Assessments, 56: 103104. https://doi.org/10.1016/j.seta.2023.103104
[9] Khiong, L.M., Safiuddin, Md., Mannan, M.A., Resdiansyah. (2021). Material properties and environmental benefits of hot-mix asphalt mixes including local crumb rubber obtained from scrap tires. Environments, 8(6): 47. https://doi.org/10.3390/environments8060047
[10] Hassan, M.R., Rodrigue, D. (2024). Application of waste tire in construction: A road towards sustainability and circular economy. Sustainability, 16(9): 3852. https://doi.org/10.3390/su16093852
[11] Castañón, A.M., Sanmiquel, L., Bascompta, M., Vega y de la Fuente, A., Contreras, V., Gómez-Fernández, F. (2021). Used tires as fuel in clinker production: Economic and environmental implications. Sustainability, 13(18): 10455. https://doi.org/10.3390/su131810455
[12] Fazli, A., Rodrigue, D. (2020). Waste rubber recycling: A review on the evolution and properties of thermoplastic elastomers. Materials, 13(3): 782. https://doi.org/10.3390/ma13030782
[13] Mohite, A.S., Rajpurkar, Y.D., More, A.P. (2022). Bridging the gap between rubbers and plastics: A review on thermoplastic polyolefin elastomers. Polymer Bulletin, 79(2): 1309-1343. https://doi.org/10.1007/s00289-020-03522-8
[14] Khazaal, K.H., Alwash, O.A., Karafe, A.M. (2025). Environmentally sustainable alkyd-based SiO₂–CuO nanocoatings for industrial corrosion protection: Synergistic, structural, and electrochemical evaluation. Annales de Chimie - Science des Matériaux, 49(2): 163-175. https://doi.org/10.18280/acsm.490207
[15] Fayomi, O.S.I., Akande, I.G., Odigie, S. (2019). Economic impact of corrosion in oil sectors and prevention: An overview. Journal of Physics: Conference Series, 1378(2): 022037. https://doi.org/10.1088/1742-6596/1378/2/022037
[16] Fayomi, O.S.I., Akande, I.G., Oluwole, O.O., Daramola, D. (2018). Effect of water-soluble chitosan on the electrochemical corrosion behaviour of mild steel. Chemical Data Collections, 17-18: 321-326. https://doi.org/10.1016/j.cdc.2018.10.006
[17] Li, F.M., Huang, L., Zaman, S., et al. (2022). Corrosion chemistry of electrocatalysts. Advanced Materials, 34(52): 2200840. https://doi.org/10.1002/adma.202200840
[18] Cheng, S.N., Yuan, W. (2021). Corrosion mechanism and anticorrosion technology of oil and gas gathering and transportation pipeline. In IOP Conference Series: Earth and Environmental Science, Asia Conference on Geological Research and Environmental Technology, Kamakura, Japan, 859(1): 012115. https://doi.org/10.1088/1755-1315/859/1/012115
[19] Zvirko, O., Gabetta, G., Tsyrulnyk, O., Kret, N. (2019). Assessment of in-service degradation of gas pipeline steel taking into account susceptibility to stress corrosion cracking. Procedia Structural Integrity, 16: 121-125. https://doi.org/10.1016/j.prostr.2019.07.030
[20] Bolzon, G., Rivolta, B., Nykyforchyn, H., Zvirko, O. (2018). Mechanical analysis at different scales of gas pipelines. Engineering Failure Analysis, 90: 434-439. https://doi.org/10.1016/j.engfailanal.2018.04.008
[21] Vakili, M., Koutník, P., Kohout, J., Gholami, Z. (2024). Analysis, assessment, and mitigation of stress corrosion cracking in austenitic stainless steels in the oil and gas sector: A review. Surfaces, 7(3): 589-642. https://doi.org/10.3390/surfaces7030040
[22] Farh, H.M.H., Ben Seghier, M.E.A., Zayed, T. (2023). A comprehensive review of corrosion protection and control techniques for metallic pipelines. Engineering Failure Analysis, 143: 106885. https://doi.org/10.1016/j.engfailanal.2022.106885
[23] Lu, H.F., Behbahani, S., Azimi, M., Matthews, J.C., Han, S., Iseley, T. (2020). Trenchless construction technologies for oil and gas pipelines: State-of-the-art review. Journal of Construction Engineering and Management, 146(6). https://doi.org/10.1061/(ASCE)CO.1943-7862.0001819
[24] Kim, Y.S., Lee, S.K., Kim, J.G. (2018). Influence of anode location and quantity for the reduction of underwater electric fields under cathodic protection. Ocean Engineering, 163: 476-482. https://doi.org/10.1016/j.oceaneng.2018.06.024
[25] Ameh, E.S., Ikpeseni, S.C. (2018). Pipelines cathodic protection design methodologies for impressed current and sacrificial anode systems. Nigerian Journal of Technology, 36(4): 1072. https://doi.org/10.4314/njt.v36i4.12
[26] Shaalan, E.M., Mostafa, M.A., Hamza, A.S., Al-Gabalawy, M. (2022). Cathodic protection performance improvement of metallic pipelines based on different DC compensation methods. Electric Power Systems Research, 210: 108064. https://doi.org/10.1016/j.epsr.2022.108064
[27] Yatsenko, E.A., Li, W.S., Izvarin, A.I., Goltsman, B.M., Ryabova, A.V., Kurdashov, V.M. (2024). Review of protective coatings for pipelines. International Journal of Hydrogen Energy, 110: 656-663. https://doi.org/10.1016/j.ijhydene.2025.02.200
[28] American Society for Testing and Materials. (2004). ASTM G1-03: Standard practice for preparing, cleaning, and evaluating corrosion test specimens. ASTM.
[29] ASTM International. (2021). ASTM D412-16. Standard Test Methods for Vulcanized Rubber and Thermoplastic Elastomers—Tension. West Conshohocken, PA: ASTM International. https://doi.org/10.1520/D0412-16R21
[30] Yang, S., Ukrainczyk, N., Koenders, E.A.B. (2019). Thermal conductivity of crumb-rubber-modified mortar using an inverse meso-scale heat conduction model. Construction and Building Materials, 212: 522-530. https://doi.org/10.1016/j.conbuildmat.2019.04.011
[31] Gschwandl, M., Kerschbaumer, R.C., Schrittesser, B., Fuchs, P.F., Stieger, S., Meinhart, L. (2019). Thermal conductivity measurement of industrial rubber compounds using laser flash analysis: Applicability, comparison and evaluation. AIP Conference Proceedings, 2065(1): 030041. https://doi.org/10.1063/1.5088299
[32] Lebrini, M., Salhi, L., Deyrat, C., Roos, C., Nait-Rabah, O. (2023). Investigation of zinc corrosion in tropical soil solution. Journal of Advanced Materials Science and Engineering, 3(1): 1-7. https://www.scivisionpub.com/pdfs/investigation-of-zinc-corrosion-in-tropical-soil-solution-2689.pdf.
[33] Cole, I.S., Marney, D. (2012). The science of pipe corrosion: A review of the literature on the corrosion of ferrous metals in soils. Corrosion Science, 56: 5-16. https://doi.org/10.1016/j.corsci.2011.12.001
[34] Wan, Y., Ding, L., Wang, X.M., Li, Y.B., Sun, H., Wang, Q. (2013). Corrosion behaviors of Q235 steel in indoor soil. International Journal of Electrochemical Science, 8(12): 12531-12542. https://doi.org/10.1016/S1452-3981(23)13286-X
[35] Ha, M.G., Heo, C.J., Ahn, J.H. (2023). Monitoring for relative effect of corrosive environmental factor on corrosion rate for steel structural details. Journal of Building Engineering, 78: 107565. https://doi.org/10.1016/j.jobe.2023.107565
[36] Kashytskyi, V., Savchuk, P., Malets, V., Herasymiuk, Y., Shchehlov, S. (2017). Examining the effect of physical fields on the adhesive strength of protective epoxy composite coatings. Eastern-European Journal of Enterprise Technologies, 3(12): 16-22. https://doi.org/10.15587/1729-4061.2017.103128
[37] Fu, Y.X., He, Z.X., Mo, D.C., Lu, S.S. (2014). Thermal conductivity enhancement with different fillers for epoxy resin adhesives. Applied Thermal Engineering, 66(1-2): 493-498. https://doi.org/10.1016/j.applthermaleng.2014.02.044
[38] Pastrnak, A., Henriquez, A., La Saponara, V. (2020). Parametric study for tensile properties of molded high-density polyethylene for applications in additive manufacturing and sustainable designs. Journal of Applied Polymer Science, 137(42): 49283. https://doi.org/10.1002/app.49283
[39] Masri, M.N., Yunus, Z.M., Warikh, A.R.M., Mohamad, A.A. (2010). Electrical conductivity and corrosion protection properties of conductive paint coatings. Anti-Corrosion Methods and Materials, 57(4): 204-208. https://doi.org/10.1108/00035591011058219
[40] Tishchenko, G.A., Dybal, J., Stejskal, J., et al. (2002). Electrical resistance and diffusion permeability of microporous polyethylene membranes modified with polypyrrole and polyaniline in solutions of electrolytes. Journal of Membrane Science, 196(2): 279-287. https://doi.org/10.1016/S0376-7388(01)00607-X
[41] Mahmood, D.T. (2025). Thermal transport in porous structures: Mechanisms, modeling approaches, and future directions. Power Engineering and Engineering Thermophysics, 4(1): 42-57. https://doi.org/10.56578/peet040104