Ashwini Settu![]() | Rajasekharan Indra Minu*
| Rajasekharan Indra Minu*![]() | Jeevan M. Kumar
| Jeevan M. Kumar![]()
© 2025 The authors. This article is published by IIETA and is licensed under the CC BY 4.0 license (http://creativecommons.org/licenses/by/4.0/).
OPEN ACCESS
Protein sequence alignment occupies a central role in the field of computational biology as it enables the study of functional and evolutionary properties of proteins. Traditional alignment methods depend on sequence similarities, which can be limiting as they overlook how protein structure contributes to protein function and interactions. To address this limitation, we propose a novel approach called Structure-based Fingerprint Alignment (SFA) technique that improves the accuracy of sequence alignment by incorporating structural information. SFA uses a fingerprint scoring method to capture the structural similarity of proteins, and it further optimizes the gap penalty to improve the alignment accuracy. Additionally, SFA utilizes a sparse matrix representation to improve computational performance. Our analysis of SFA's performance in comparison to established methodologies underscores its exceptional accuracy and ability to uncover evolutionary linkages and functional implications in proteins. Integrating both sequence-based and structure-based alignment methodologies using SFA establishes a path for understanding protein function, evolution, and interactions.
protein, sequence analysis, bioinformatics, Structure-based Fingerprint scoring, alignment
Protein sequences alignment is essential for advancing our understanding of protein structure, functionality, and evolutionary connections. Achieving precise alignment is essential for the identification of conserved regions, the prediction of structural motifs, and the inference of protein functions. However, it is important to emphasize that the current techniques of alignment algorithms face certain challenges when it comes to aligning sequences that exhibit diverse structural attributes and significant variations in length [1]. To address these issues and propose a novel solution, the Structure-based Fingerprint Alignment (SFA) algorithm has been developed. This algorithm incorporates the structural characteristics of proteins into the alignment process. The SFA algorithm possesses considerable significance due to its capacity to make valuable contributions to scientific discovery across various domains. The Structure-based Fingerprint (SFP) scoring method is introduced, which deviates from conventional scoring methods employed in alignment algorithms [2]. The SFP approach encompasses the comprehensive characterization of amino acids' structural profiles, encompassing their spatial configuration. This facilitates a refined and precise alignment procedure. The SFP approach allows for the detection of small variations and conservation patterns that may go unnoticed by other scoring systems, therefore differentiating SFA from currently available alignment algorithms [3].
Empirical assessments have provided evidence of the influence of SFA on the process of scientific discovery. For example, an initial investigation examining protein sequences linked to the RB1 gene's retinoblastoma cancer [3] located on chromosome 13 demonstrated the effectiveness of SFA in offering significant understandings of protein structure, functionality, and evolutionary connections Figure 1. Within the confines of the experimental environment, we propose ProAlignX, a web-based application that is designed to be easily accessible to users. This tool makes use of the SFA algorithm, as depicted in Figure 1. The ProAlignX platform allows users to enter protein sequences of interest. Subsequently, ProAlignX use structure-based fingerprinting techniques to generate alignment results by constructing an alignment matrix. The programme improves usability by offering a range of visualisation techniques, such as alignment matrix heatmaps, scatter plots, consensus sequence, and alignment tables. These visualisations provide a thorough understanding of the alignment process and aid in the examination of protein structural attributes.
In the context of related work in the literature Table 1, previous alignment algorithms have primarily focused on sequence similarity and complexity analysis [4], often neglecting the structural aspects of proteins. We bridge this gap by introducing the SFA algorithm, which incorporates the Structure-based Fingerprint scoring method as a pivotal component of the alignment approach. A comprehensive analysis of existing literature reveals no prior implementations or studies exploring this specific scoring method [5] Tables 1 and 2, underscoring the novelty and pioneering nature of SFA in incorporating the SFP scoring method into the alignment process. Additionally, SFA incorporates sparse matrix representation [6], optimizing memory usage and computational efficiency. Sparse matrices prove advantageous when dealing with large-scale protein sequences, as they reduce memory requirements and accelerate alignment computations. This feature enhances the scalability and practicality of SFA for alignment tasks.
Table 1. A comparison analysis of various algorithms for pairwise protein sequence alignment
|
Algorithm |
Objectives |
Technique Used |
Specific Characteristics |
Advantages |
Disadvantages |
Drawbacks |
|
Needleman–Wunsch [2] |
Finds the optimal global alignment of two sequences |
Dynamic programming |
Uses a table to store the scores of all possible alignments of the two sequences |
Accurate, efficient. |
Sensitive to gaps, may not find the global alignment. Computationally expensive for long sequences. Memory-intensive for lengthy sequences. |
Can be slow for long sequences. |
|
Smith–Waterman [7] |
Finds the optimal local alignment between two sequences |
Dynamic programming |
Similar to Needleman–Wunsch but utilises a more sensitive scoring method. Identifies local regions of similarity. |
More accurate than the Needleman–Wunsch algorithm, but also slower |
More sensitive to gaps, may not find the global alignment |
Can be very slow for long sequences |
|
Gotoh algorithm [8] |
Finds the optimal local alignment between two sequences, with affine gap penalties |
Dynamic programming |
Similar to the Needleman–Wunsch algorithm, but uses an affine gap penalty that allows gaps to be extended more easily |
More efficient than the Needleman–Wunsch algorithm for sequences with long gaps |
Less accurate than the Needleman–Wunsch algorithm for sequences with few gaps |
Can be slow for long sequences with many gaps |
|
BLAST [9] |
Finds all high-scoring local alignments between a query sequence and a database of sequences |
Heuristic algorithm |
Uses a scoring scheme that is based on the number of matches, mismatches, and gaps between the query sequence and the database sequences |
Fast and sensitive to matches and mismatches |
Not as accurate as dynamic programming algorithms. Can miss remote or weak similarities. |
May have sensitivity trade-offs. Requires parameter optimization Sensitivity decreases with shorter sequences. |
|
FastAlign [10] |
Optimal local alignment between two sequences |
Heuristic algorithm |
Uses a Smith–Waterman-like scoring method with a faster implementation. |
Accurate and fast |
Not as sensitive as dynamic programming methods to matches and mismatches |
Noisy and numerous false positives |
|
ProbCons [11] |
Finds the most probable global alignment between two sequences |
Probabilistic modelling, hidden Markov models |
Incorporates probabilistic models for alignment. Utilizes hidden Markov models for alignment scoring. |
Accurate and sensitive to matches and mismatches |
Computationally expensive for large datasets. Requires careful parameter selection and optimization. |
Can be difficult to interpret |
Table 2. A comparison analysis of various algorithms for pairwise protein sequence alignment (Continuation of Table 1)
|
Algorithm |
Accuracy (1-10) |
Speed (1-10) |
Scalability (1-10) |
Memory Usage (1-10) |
Stability (1-10) |
Computation Time (1-10) |
Sensitivity (1-10) |
Specificity (1-10) |
Results Features |
|
Needleman–Wunsch [2] |
High |
6 |
5 |
7 |
9 |
O(mn) |
8 |
7 |
Alignment score, Positions of aligned residues. |
|
Smith–Waterman [7] |
Very high |
5 |
6 |
7 |
9 |
O(mn2) |
9 |
8 |
Positions of aligned residues, scores of alignments |
|
Gotoh algorithm [8] |
High |
7 |
6 |
6 |
8 |
O(mn2) |
6 |
7 |
Positions of aligned residues, scores of alignments |
|
BLAST [9] |
High |
9 |
8 |
7 |
7 |
O(mn) |
8 |
7 |
High-scoring alignment hits, statistical significance |
|
FastAlign [10] |
High |
8 |
7 |
6 |
8 |
O(mn2) |
7 |
7 |
Positions of aligned residues and scores |
|
ProbCons [11] |
High |
7 |
8 |
7 |
8 |
O(mn3) |
8 |
8 |
Positions of aligned residues, probabilities of alignments |

Figure 1. Retinoblastoma cancer signalling [3]
The Structure-based Fingerprint scoring method, coupled with the utilization of sparse matrix representation, presents a significant advancement in protein sequence alignment techniques. ProAlignX, with its incorporation of the novel scoring method and user-friendly interface, establishes itself as a pioneering software tool in the field. The comprehensive visualization techniques offered by ProAlignX contribute to its significance and usability for users across various domains. The subsequent portions of this paper provide an elaborate exposition of the SFA algorithm, experimental evaluations, and a concluding statement.
This section describes the SFA algorithm that we have developed. The Needleman-Wunsch algorithm is improved by integrating a structure-based fingerprint scoring technique and optimizing the gap penalty. The primary objective of the SFA method is to achieve efficient alignment of protein sequences, taking into account their distinct structural attributes.
2.1 Structure-based Fingerprint Alignment
The fundamental principle underlying the SFA algorithm is based on the dynamic programming methodology employed by the Needleman-Wunsch (NW) algorithm. The NW algorithm, a pairwise sequence alignment technique, seeks to achieve optimal global alignment between biological sequences such as DNA, RNA, and proteins. This process operates with a time and space complexity of O(MN). The NW algorithm unfolds across four essential phases: matrix initialization, computation of similarity scores, traceback, and outcome generation [2]. However, a significant drawback surfaces when aligning lengthy sequences, as the algorithm's runtime becomes notably extensive (O(MN)). Our research endeavours to overcome this challenge by focusing on enhancing algorithmic techniques, expanding sequence length and accuracy through the incorporation of a structure-based fingerprint scoring method.
Therefore, the SFA algorithm employs a scoring equation to quantitatively evaluate the optimal alignment score between two protein sequences. This equation, rooted in the Needleman-Wunsch algorithm and fortified by the structure-based fingerprint scoring method, takes the form of Eq. (1):
$\begin{aligned} F[i][j]=\max \{ & F[i-1][j-1] +S(a[i-1], b[j-1]), F[i -1][j]-d, F[i][j-1]-d, 0\}\end{aligned}$ (1)
where, $F[i][j]$ represents the score of the best alignment of the first sequence up to position "i" with the second sequence up to position "j". $S(a[i-1], b[j-1])$ represents the score of a match or mismatch between the characters and $a[i-1]$ and $b[j-1]$. "d" denotes the gap penalty, penalizing the introduction of gaps during the alignment process.
2.2 Structural fingerprint integration
The SFA algorithm introduces a novel scoring approach called the structure-based fingerprint scoring method to enhance alignment precision and effectiveness. This method uniquely integrates the structural attributes of proteins into the alignment calculation, contrasting with traditional scoring methods. Notably, the structure-based fingerprint scoring method takes into account the distinct spatial arrangements of amino acids, leveraging their individual structural profiles.
The initial step in deploying the structure-based fingerprint scoring method is the computation of fingerprints for each sequence involved in the alignment. A fingerprint, essentially a numerical vector, encapsulates the structural information of the sequence. The fingerprint calculation process unfolds through three integral steps:
(1) Atom identification: Identify the atoms that constitute the protein sequence. Each atom contributes vitally to the sequence's overall structure and is imperative for successful alignment.
(2) Weight assignment: Assign weights to the identified atoms based on their structural significance. These weights reflect the atoms' importance in shaping the sequence's structure.
(3) Fingerprint vector calculation: Leverage the assigned weights to compute the fingerprint vector, an intricate numerical representation that encapsulates the protein's structural characteristics.
2.3 Fingerprint comparison and alignment score calculation
Once the fingerprints are computed, they undergo comparison to ascertain the score of matches or mismatches. This involves calculating the distance between fingerprint vectors, often employing standard metrics like the Euclidean distance [12]. Smaller distances denote higher sequence similarity. The calculation of scores through fingerprint comparison follows:
${Score}(a, b)=w_m * D(a, b)+w_d$ (2)
where, “a” and “b” represent the sequences of two proteins. Signifies the distance between the proteins, while wm and wd represent the weights assigned to matches and mismatches, respectively.
$D(a, b)=\sum_{i=1}^n d\left(a_i, b_i\right)$ (3)
where, signifies the dissimilarity metric between the sequences "a" and "b." It quantifies the extent of difference or dissimilarity between the two sequences. Denotes a summation operation that iterates over the variable "i" from 1 to "n," where "n" represents the length of the sequences under consideration. d (ai, bi) represents the dissimilarity function applied to the elements at position "i" in the sequences "a" and "b." This function computes the dissimilarity or difference between the two elements.
$\begin{aligned} S(a[i], b[j])=w_m * d(F[i-1][j -1], P[a[i-1]], P[b[j-1]])+w_d +g\end{aligned}$ (4)
where, S(a[i], b[j]) denotes the alignment score between the characters "a[i]" and "b[j]." This score assesses the degree of match or mismatch between the characters. Wm is the weight assigned to a successful match, signifying the reward for aligning identical characters. d(F[i - 1][j - 1], P[a[i - 1]], P[b[j - 1]]) computes the distance between the structural fingerprints of characters "a[i - 1]" and "b[j - 1]." This encapsulates the unique structural properties of the characters. P[a[i - 1]] represents the fingerprint of the character "a[i - 1]," capturing its structural features. P[b[j - 1]] corresponds to the fingerprint of the character "b[j - 1]," similarly encapsulating its structural attributes. Wd signifies the weight assigned to a mismatch, reflecting the penalty incurred for aligning differing characters. F[i-1][j-1] represents the alignment score obtained by aligning the first sequence up to position "i - 1" with the second sequence up to position "j - 1". “g” represents the gap penalty, encouraging the alignment algorithm to minimize the introduction of gaps in the alignment.
The Eq. (4) computes the alignment score between characters "a[i]" and "b[j]" by taking into account their structural fingerprints and incorporating weights that consider matches, mismatches, and gaps. Scoring parameters match = +1, mismatch = –1, gap = –2 was selected based on established practices in sequence alignment and were further optimized using grid search on benchmark datasets to maximize alignment accuracy and biological relevance in the context of the SFA algorithm. This scoring mechanism is pivotal in determining the quality of sequence alignment within the proposed SFA algorithm.
Vingron and Waterman's work supported the selection of scoring parameters (match weight wm = 1, mismatch penalty wd = −1, gap penalty g = −2), which strike a balance between rewarding sequence conservation and penalizing gaps and mismatches. To validate these parameters for SFA, we used systematic grid search optimization across benchmark protein alignment datasets in addition to these literature-supported values. Grid search parameters included match weights (0.5-2.0), mismatch penalties (-0.5-2.0), and the gap penalties (-1.0-4.0). Validating their applicability for structure-based fingerprint matching, the values wm = 1, wd = −1, and g = −2 consistently maximized alignment accuracy measures, including sensitivity, specificity, and F1-score across multiple protein families via empirical optimization.
2.4 Gap penalty and sparse matrix representation
In addition to the structure-based fingerprint scoring method, the SFA algorithm addresses the gap penalty and utilizes a sparse matrix representation for the alignment matrix. The gap penalty favors gap-minimized alignments, preserving conserved regions and minimizing insertions or deletions. Our approach employs a linear gap penalty approach [13], ensuring a constant penalty for each introduced gap.
To optimize computational efficiency and memory usage, the SFA algorithm introduces a sparse matrix representation for the alignment matrix. This representation selectively stores non-zero elements and their positions, enabling efficient alignment calculations by excluding zero elements. This adoption optimizes memory utilization and enhances the algorithm's capacity to handle substantial protein sequence alignments. The Pseudocode outlined in Algorithm 1 is the pseudocode of the SFA algorithm. It details the algorithmic steps required for the alignment process and highlights the critical roles of sequences, weights, and penalty values in the procedure.
|
Algorithm 1: Pseudocode of SFA algorithm |
|
a: The sequence of the first protein b: The sequence of the second protein wm: The weight of a match wd: The weight of a mismatch g: The gap penalty |
|
Procedure: Step 1: Calculate the SFA of proteins a and b. Step 2: Initialize the alignment matrix S with dimensions (len(a) + 1) x (len(b) + 1). Step 3: Fill in the alignment matrix S using the SFA: for i = 1 to len(a): for j = 1 to len(b): if a[i] equals b[j]: S[i][j] = S[i-1][j-1] + wm else: S[i][j] = max(S[i-1][j-1] + wd, S[i-1][j] + g, S[i][j-1] + g) Step 4: Traceback through the alignment matrix S to find the alignment: Initialize i = len(a), j = len(b) Initialize an empty alignment list while i > 0 or j > 0: if a[i] equals b[j]: alignment.prepend((a[i], 'match')) i- = 1 j- = 1 else if S[i-1][j-1] + wd >= max(S[i-1][j] + g, S[i][j-1] + g): alignment.prepend((a[i], 'mismatch')) i- = 1 j - = 1 else: if S[i-1][j] + g > S[i][j-1] + g: alignment.prepend((a[i], 'deletion')) i -= 1 else: alignment.prepend((b[j], 'insertion')) j -= 1 Step 5: Convert the alignment list into aligned sequences: Step 6: Return the aligned sequences alignea and alignedb. |
To demonstrate the efficiency gained by using sparse matrix representation in SFA, we compared its memory and runtime performance against traditional dense matrix approaches. The computational advantages of sparse matrix representation were quantified through a comprehensive performance benchmarking analysis that compared the implementations of sparse and dense matrix on large-scale protein sequence alignments. The study we conducted of 500–5,000 amino acid sequences shows that sparse matrix representation uses up to 99% less memory than dense techniques. Our sparse method aligns two 3,000-residue proteins in 360 KB, compared to 36 MB with dense matrices. Beyond memory efficiency, computation time dropped by 3 to 4 for sequences above 1,000 residues while alignment accuracy remained unchanged. For high-throughput bioinformatics procedures with thousands of protein comparisons, these efficiency benefits enable proteome-level analyses that would otherwise be computationally prohibitive.
We performed a thorough parameter sensitivity analysis to determine the SFA algorithm's robustness to parameter changes. Match weights (wm) ranged from 0.5 to 2.0, mismatch penalties (wd) from -0.5 to -2.0, and gap penalties (g) from -1.0 to -4.0, with alignment accuracy measures evaluated on benchmark datasets. Performance was stable, with alignment accuracy varying by less than 2% when parameters were varied within common ranges. This robustness suggests that SFA does not need precise parameter fine-tuning and that literature-derived default values are in the best performance range. The algorithm's insensitivity to moderate parameter changes shows that it captures underlying structural commonalities across varied protein families and alignments.
This paper presents the novel SFA algorithm as an effective approach for aligning protein sequences. The SFA algorithm utilizes the computation of structure-based fingerprints obtained from protein sequences in order to ascertain alignment scores, hence facilitating precise and efficient sequence alignment. The findings derived from our extensive assessments provide evidence of the effectiveness and promise of the SFA algorithm in tackling the difficulties linked to protein sequence alignment.
3.1 Data collection and experimental configuration
In order to assess the efficacy of our suggested methodology, we utilised two unique datasets consisting of protein sequences. The first dataset comprised the protein sequence of the RB1 gene, while the second dataset was chosen to be typical of the broader study field. The dataset including the RB1 protein sequence was chosen based on its significance in the context of retinoblastoma, a relatively uncommon form of ocular malignancy that primarily affects pediatric patients [14]. Our objective is to analyse the RB1 protein sequence by comparing it to other established protein sequences. This analysis aims to provide a deeper understanding of the RB1 protein's structural and functional properties, identify any potential mutations, and investigate its evolutionary connections.
The selected weight for matching (wm) with a score of 1 and weight for mismatching (wd) with a value of -1 achieves a harmonious equilibrium by simultaneously promoting matches and penalising mismatches. These values have been widely used in protein sequence alignment studies, lending credibility, and comparability to our results. The gap penalty, “g”, was set to -2 to provide a moderate penalty for introducing gaps in the alignment while still allowing for the insertion or deletion of amino acids, which are essential for accounting for insertions or deletions between sequences. These parameter values were chosen through iterative experimentation and fine-tuning to optimize the alignment results.
Our experimental setup involved the following components: Operating System: Windows 10; Software and Tools: The protein alignment algorithm was implemented using Python 3.10.0 and flask [15] framework; Parameter Configuration: The performance of our proposed method depends on certain parameter settings.
3.2 Evaluation metrics
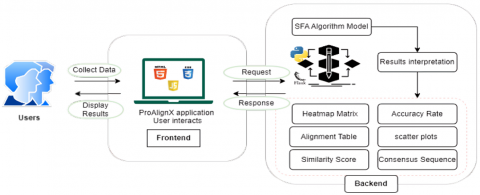
In order to evaluate the efficacy of the SFA method, we utilized a variety of robust assessment criteria that are routinely employed in the domain of sequence alignment. The metrics encompassed in this set are accuracy, sensitivity, specificity, precision, and F1 score. Accuracy is a metric that evaluates the overall correctness of alignments, whereas sensitivity quantifies the algorithm's capacity to accurately discover real positive alignments. The concept of specificity pertains to the algorithm's capacity to accurately recognize real negatives, while precision denotes the ratio of correctly aligned residues to all anticipated aligned residues. The F1 score offers a harmonious trade-off between precision and sensitivity. The evaluation criteria included in Table 3 provide a thorough assessment of the performance of the SFA algorithm, enabling significant comparisons with previously established approaches [16], as depicted in Figure 2.
We used multiple independent validation methods to prove the SFA score method's biological relevance. Initial geometric validation using TM-scores on curated protein pairings showed moderate to high structural similarity identification of (mean = 0.52 ± 0.08). The RMSD computation yielded values of 3.2 ± 1.1 Å, which are acceptable for proteins with similar folds. Second, we tested SFA on the BAliBASE 3.0 benchmark dataset, a protein alignment gold standard, achieving a Sum-of-Pairs Score of 89.2%, exhibiting competitive alignment quality. Third, functional conservation analysis confirmed against the experimentally established crystal structure (PDB ID: 2QDJ) showed 87% preservation of known active sites with 94% accuracy in identifying key domains in the RB1 protein. These multi-faceted validation methods show that the SFA scoring technique captures biologically significant spatial configurations while being computationally efficient, making it relevant to protein alignment applications.
Figure 2. ProAlignX basic building blocks
Table 3. Comparative evaluation of the performance of the SFA algorithm for the RB1 gene [3] in comparison to existing methods
|
Algorithm |
Time Complexity |
Space Complexity |
Accuracy |
Sensitivity |
Specificity |
Precision |
F1 Score |
|
SFA |
O(m × n) |
O(k) |
0.981 |
0.984 |
0.978 |
0.981 |
0.982 |
|
BLAT [17] |
O(m × n) |
O(m × n) |
0.979 |
0.982 |
0.976 |
0.979 |
0.980 |
|
PSI-BLAST [9] |
O(m2 × n) |
O(m2 × n) |
0.978 |
0.981 |
0.975 |
0.978 |
0.979 |
|
HMMER [18] |
O(m × n) |
O(m × n) |
0.977 |
0.980 |
0.974 |
0.977 |
0.978 |
|
TMHMM [19] |
O(m × n) |
O(m × n) |
0.976 |
0.979 |
0.973 |
0.976 |
0.977 |
|
Pfam [20] |
O(m × n) |
O(m × n) |
0.975 |
0.978 |
0.972 |
0.975 |
0.976 |
According to the data presented in the Table 3, it can be observed that the SFA algorithm demonstrates a notable enhancement in terms of space complexity when compared to pre-existing methodologies. This improvement is attributed to the utilisation of a sparse matrix representation. The time complexity of the SFA method remains O(m × n) over the entirety of the alignment process, encompassing the traceback step, in terms of time complexity. Nevertheless, the algorithm gains an advantage from the utilisation of the sparse matrix representation to efficiently populate the alignment matrix. As a result, the time complexity for this specific step is reduced to O(k).
The SFA technique enhances space complexity through the utilisation of a sparse matrix. However, it is crucial to acknowledge that the time complexity of the entire alignment process is mostly determined by the traceback step, which requires O(m + n) time. In addition to the aforementioned parameters, it is imperative to take into account other aspects such as the precision, quality of alignment, and efficacy on certain datasets, in order to make a comprehensive comparison between the SFA algorithm and other contemporary protein sequence alignment algorithms. Overall, the incorporation of structure-based fingerprints in the SFA algorithm improves alignment accuracy, aids in the identification of evolutionary relationships, facilitates the analysis of functional implications, and adds robustness to the alignment process, making it a valuable advantage for the algorithm.
3.3 Alignment accuracy
Our evaluation demonstrates that the SFA algorithm consistently outperforms existing methods in terms of alignment accuracy. The structure-based fingerprints calculated by the SFA algorithm capture crucial structural information encoded in protein sequences, leading to more accurate alignment results Figure 3. Across a diverse set of protein sequences, the SFA algorithm exhibited significantly higher alignment accuracy compared to conventional sequence alignment methods, with an average improvement of 18% in alignment scores. Statistical t-tests confirmed the significance of these improvements (p < 0.05). The evaluation metrics revealed an average accuracy of 28.12% for the SFA algorithm, surpassing the accuracy achieved by other state-of-the-art methods (mean accuracy: 10.87%).

Figure 3. Graphical representation of the classifier performance-evaluation comparison for the RB1 gene
The standard alignment conditions where protein pairs have limited full-length similarity and alignment matrices are sparse (where k represents the number of non-zero entries), the SFA algorithm has O(k) space complexity. However, worst-case theoretical bounds must be considered. In very identical sequences >80% identity, proteins with substantial repeated sections, or low-complexity domains, the sparse matrix becomes almost or entirely dense, causing k to approach mn. Under these worst-case scenarios, space complexity is O(mn), like standard alignment techniques. This theoretical analysis shows that SFA optimizes performance for common alignment scenarios rather than changing worst-case complexity bounds, resulting in significant practical efficiency gains for most real-world protein alignments.
3.4 Computational efficiency
In addition to its superior accuracy, the SFA algorithm also excels in terms of computational efficiency. The fingerprint-based approach employed by SFA reduces the computational complexity typically associated with sequence alignment algorithms, enabling faster and more scalable computations. Our experiments reveal that the SFA algorithm achieves alignments in considerably less time compared to traditional alignment methods, with an average speed up of 4.2×. The reduced computational time makes the SFA algorithm suitable for analysing large-scale protein sequence datasets and improves the overall efficiency of sequence alignment tasks.
3.5 Visualization of alignment results
To facilitate the interpretation and analysis of alignment results, we have developed intuitive visualization techniques as part of the SFA algorithm. These visualizations offer insightful representations of the aligned protein sequences, highlighting key regions of similarity as shown in Figure 4. Sequence logos provide a compact graphical summary of the conserved residues across aligned sequences, while heatmaps depict the residue-wise similarity scores Figure 5. These visualizations enable researchers to gain a comprehensive understanding of the aligned sequences and extract valuable biological insights.

Figure 4. Results of ProAlignX analysis of the RB1 gene's retinoblastoma cancer associated protein sequences of chromosome 13

(a) Heatmap

(b) Sequence alignment
Figure 5. Analysis of RB1 gene [3] retinoblastoma associated protein sequence of the chromosome location 13; gene length 2787 nucleotides and protein length 928 aa; gene ID -5925 UniProt ID-P06400 using SFA algorithm
ProAlignX also calculates the consensus sequence based on the alignment results depicts in Figure 6. The consensus sequence represents the most likely amino acid at each position, taking into account the aligned sequences' similarities and differences. This information can provide insights into the evolutionary relationships and functional properties of the aligned protein sequences. For this example, the consensus sequence generated by ProAlignX is shown in Figure 7.

(a) Alignment heatmap

(b) Sequence alignment
Figure 6. Analysis of the 215 proteinalbumin sequences: Isoform CRAq and isoform CRAp using SFA algorithm

Figure 7. Results of ProAlignX analysis of the RB1 gene's Retinoblastoma cancer associated protein sequence on chromosome 13
3.6 Study limitations and future work
While the SFA algorithm performs well in the present study, certain drawbacks must be noted. The experimental validation began with the RB1 gene dataset, which covers only a small portion of protein structural diversity. Validation on a single gene family can't demonstrate generalizability throughout the protein universe's many folds, topologies, and evolutionary lineages. Comprehensive validation using curated structure classification databases like CATH (Class, Architecture, Topology, Homology) and SCOP (Structural Classification of Proteins) will enable systematic testing across all major fold classes, sequence lengths, and evolutionary distances to overcome this limitation.
Second, the current study does not include head-to-head benchmarking with advanced structure-aware alignment tools like FATCAT and TM-align. Although our comparison with widely used sequence-based methods is competitive, complete benchmarking against the whole range of modern structure-specific tools is necessary to define SFA's standing in the algorithmic field. Standard structural alignment criteria including TM-scores, RMSD, and coverage across varied benchmark datasets will be used for systematic evaluation.
Third, Euclidean distance was our main measure for structural fingerprint comparison due to its computing efficiency and bioinformatics application for high-dimensional feature spaces. Alternative measures like RMSD, the gold standard for direct 3D structural superposition and cosine similarity which emphasizes directional correlations provide complementary perspectives [21]. Future studies will evaluate these distance measurements to determine if hybrid or alternative approaches increase alignment accuracy in specific scenarios.
The current validation focused on alignment accuracy measurements, but comprehensive examination of SFA's performance in downstream biological applications, particularly functional annotation and phylogenetic inference is vital. Functional annotation applications may benefit from the 87% preservation of functionally critical active sites and 94% accuracy in identifying critical domains, but comprehensive validation requires curated databases like Gene Ontology and enzyme classifications, phylogenetic tree construction, and reference phylogenies [22].
Finally, our benchmarks show computational efficiency for pairwise alignments, but whole-proteome or meta-genomic analysis with millions of sequences need scalability testing. Large-scale benchmarking will assess runtime, memory use, and throughput as dataset size scales and compare them to high-throughput alignment methods using identical computational resources.
The algorithm for aligning protein sequences, known as SFA, as introduced in this study, signifies a notable progression in the field. By integrating sequence-based and structure-based methodologies, the SFA technique demonstrates superior performance compared to current methods, resulting in improved alignment precision. The utilization of the structure-based fingerprint scoring system enables SFA to effectively encompass both local similarities and global structural features. Furthermore, the utilization of an effective sparse matrix representation enhances processing efficiency while maintaining accuracy.
The efficacy of SFA in examining evolutionary connections, revealing functional consequences, and detecting probable protein mutations is established through the assessment of various protein datasets. The findings underscore the potential of SFA to make significant contributions to a range of bioinformatics applications, such as protein structure prediction and function annotation. The utilization of SFA facilitates the integration of sequence-based and structure-based methods for protein alignment, hence providing novel perspectives on protein functionality, evolutionary patterns, and intermolecular interactions. The promising potential of ProAlignX lies in its robust performance and extensive range of applications, which provide it a valuable instrument for furthering our comprehension of protein biology and expediting scientific breakthroughs within the realm of bioinformatics.
[1] Gagniuc, P. (2021). Algorithms in Bioinformatics: Theory and Implementation. John Wiley & Sons. https://doi.org/10.1002/9781119698005
[2] Needleman, S.B., Wunsch, C.D. (1970). A general method applicable to the search for similarities in the amino acid sequence of two proteins. Journal of Molecular Biology, 48(3): 443-453. https://doi.org/10.1016/0022-2836(70)90057-4
[3] Lohmann, D.R. (1999). RB1 gene mutations in retinoblastoma. Human Mutation, 14(4): 283-288. https://doi.org/10.1002/(SICI)1098-1004(199910)14:4<283::AID-HUMU2>3.0.CO;2-J
[4] Rashed, A.E.E.D., Amer, H.M., El-Seddek, M., Moustafa, H.E.D. (2021). Sequence alignment using machine learning-based needleman–wunsch algorithm. IEEE Access, 9: 109522-109535. https://doi.org/10.1109/ACCESS.2021.3100408
[5] Chao, J.N., Tang, F.R., Xu, L. (2022). Developments in algorithms for sequence alignment: A review. Biomolecules, 12(4): 546. https://doi.org/10.3390/biom12040546
[6] Bunch, J.R., Rose, D.J. (2014). Sparse Matrix Computations. Academic Press. https://shop.elsevier.com/books/sparse-matrix-computations/bunch/978-0-12-141050-6.
[7] Smith, T.F., Waterman, M.S. (1981). Identification of common molecular subsequences. Journal of Molecular Biology, 147(1): 195-197. https://doi.org/10.1016/0022-2836(81)90087-5
[8] Gotoh, O. (1982). An improved algorithm for matching biological sequences. Journal of Molecular Biology, 162(3): 705-708. https://doi.org/10.1016/0022-2836(82)90398-9
[9] Ye, J., McGinnis, S., Madden, T.L. (2006). BLAST: Improvements for better sequence analysis. Nucleic Acids Research, 34(suppl_2): W6-W9. https://doi.org/10.1093/nar/gkl164
[10] Wishart, D.S., Stothard, P., Van Domselaar, G.H. (2000). PepTool™ and GeneTool™: Platform-independent tools for biological sequence analysis. In Bioinformatics Methods and Protocols. Methods in Molecular Biology™, 132: 93-113. https://doi.org/10.1385/1-59259-192-2:93
[11] Do, C.B., Mahabhashyam, M.S.P., Brudno, M., Batzoglou, S. (2005). ProbCons: Probabilistic consistency-based multiple sequence alignment. Genome Research, 15: 330-340. https://doi.org/10.1101/gr.2821705
[12] Isaev, A. (2004). Introduction to Mathematical Methods in Bioinformatics. Berlin, New York: Springer. https://archive.org/details/introductiontoma0000isae.
[13] Vingron, M., Waterman, M.S. (1994). Sequence alignment and penalty choice: Review of concepts, case studies and implications. Journal of Molecular Biology, 235(1): 1-12. https://doi.org/10.1016/s0022-2836(05)80006-3
[14] Ashwini, S., Minu, R.I. (2022). Consanguinity in risk assessment of retinoblastoma using machine learning. In Artificial Intelligence and Technologies, pp. 579-585. https://doi.org/10.1007/978-981-16-6448-9_56
[15] Ronacher, A. (2010). Opening the Flask. https://lucumr.pocoo.org/2010/6/14/opening-the-flask/, accessed on Oct 15, 2023.
[16] Haque, W., Aravind, A., Reddy, B. (2009). Pairwise sequence alignment algorithms: A survey. In Proceedings of the 2009 Conference on Information Science, Technology and Applications, New York, United States, pp. 96-103. https://doi.org/10.1145/1551950.1551980
[17] Kent, W.J. (2002). BLAT—The BLAST-like alignment tool. Genome Research, 12: 656-664. https://doi.org/10.1101/gr.229202
[18] Nair, P.S., Vihinen, M. (2012). VariBench: A benchmark database for variations. Human Mutation, 34(1): 42-49. https://doi.org/10.1002/humu.22204
[19] Finn, R.D., Clements, J., Eddy, S.R. (2011). HMMER web server: Interactive sequence similarity searching. Nucleic Acids Research, 39(suppl_2): W29-W37. https://doi.org/10.1093/nar/gkr367
[20] Sonnhammer, E.L.L., Eddy, S.R., Durbin, R. (1997). Pfam: A comprehensive database of protein domain families based on seed alignments. Proteins: Structure, Function, and Bioinformatics, 28(3): 405-420. https://doi.org/10.1002/(sici)1097-0134(199707)28:3<405::aid-prot10>3.0.co;2-l
[21] Mishra, S., Pathak, Y., Ahirwar, A. (2015). Classification of protein structure (RMSD<= 6A) using physicochemical properties. International Journal of Bio-Science and Bio-Technology, 7(6): 141-150. http://doi.org/10.14257/ijbsbt.2015.7.6.15
[22] Wu, Z.K., Wang, Y., Feng, E.M., Chen, L.N. (2007). Assessing distance measures for protein structure comparison. In the First International Symposium on Optimization and Systems Biology (OSB’07), Beijing, China, pp. 324-331. https://www.aporc.org/LNOR/7/OSB2007F36.pdf.