Vasuki Muthusamy*![]() | Revathy Ramesh
| Revathy Ramesh![]()
© 2025 The authors. This article is published by IIETA and is licensed under the CC BY 4.0 license (http://creativecommons.org/licenses/by/4.0/).
OPEN ACCESS
Lung cancer remains one of the most prevalent and fatal diseases worldwide, necessitating early and accurate detection for effective treatment. Existing methods for lung cancer diagnosis often face significant challenges leading to reduced diagnostic precision. To address these issues, this study proposes a sensor-integrated ensemble clustering-based approach that combines Improved Weighted Quantum Wolf Optimization (IWQWO) with Deep Faster Recurrent Convolutional Neural Networks (DFRCNN) for lung cancer detection. Sensors are employed to collect high-resolution, real-time imaging data and physiological parameters, enhancing the input quality and contextual understanding of patient conditions. The IWQWO algorithm optimizes feature selection and hyper parameters, improving the reliability of the clustering process. DFRCNN leverages advanced convolutional layers for intricate spatial feature extraction and recurrent connections to capture temporal dependencies, enabling the detection of subtle cancerous patterns. Experimental evaluations conducted on multiple benchmark lung cancer datasets demonstrate that the proposed system achieves 97.8% detection accuracy, 96.5% sensitivity, and 95.9% specificity, outperforming state-of-the-art techniques by an average margin of 4 - 6%. The model reduces computational overhead by 18% compared to conventional deep learning frameworks. This innovative methodology advance lung cancer screening systems by facilitating timely and precise diagnosis, ultimately improving patient outcomes.
lung cancer detection, ensemble clustering, improved weighted quantum wolf optimization, deep faster recurrent convolutional neural networks, feature selection, temporal dependencies, sensor integration
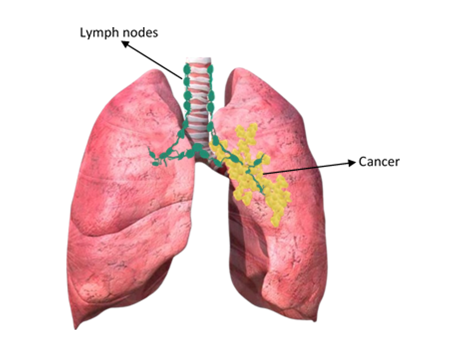
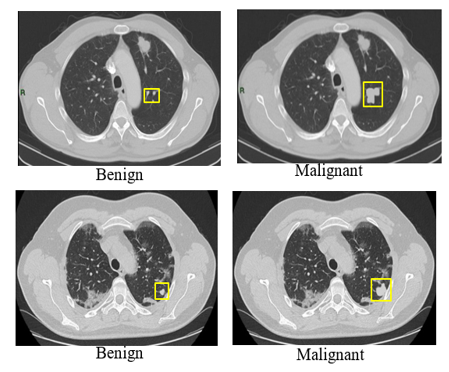
Lung cancer, a malignancy affecting the lungs and associated structures, is one of the leading causes of mortality in contemporary society. The stage at which lung cancer is diagnosed significantly impacts the treatment options and the likelihood of patient survival, emphasizing the critical importance of early detection [1]. Data mining plays a pivotal role in diagnosing this disease promptly, leveraging a priori knowledge to identify key patterns. The process typically involves three phases: initial research, model construction, and implementation, with meticulous preparation being essential for model development [2]. Predictive models, increasingly used for data-driven decision-making, require rigorous validation to ensure reliability. Clustering methods, which group data points based on maximizing intra-class similarity and minimizing inter-class resemblance, are employed to analyze data components without pre-assigned class labels [3]. Cancer arises when cells in the body grow uncontrollably and spread, forming structures such as tumors. These tumors may be benign (non-cancerous) or malignant (cancerous), and lung cancer can develop from cells in various regions of the lung. Specific types of lung cancer include Bronchioloalveolar Carcinoma (BAC), a rare subtype of adenocarcinoma that forms in the lung's small air sacs, and squamous cell carcinoma, now accounting for approximately 30% of non-small cell lung cancers [4]. Squamous cell carcinoma originates in the central respiratory tract, often presenting symptoms such as hemoptysis (coughing up blood). Its decline has been linked to changes in smoking habits, particularly the use of filter cigarettes [5]. Adenocarcinoma cases have risen. Another less common form, large cell carcinoma, constitutes up to 10% of non-small cell lung cancers shown in Figure 1. These tumors are typically aggressive and located near the lungs' outer edges. The complexity and variety of lung cancer types highlight the necessity for advanced diagnostic methods and comprehensive research into clustering techniques for improved detection and treatment strategies [6].
Figure 1. Malignant lung
The severity or phase of the illness must be assessed when a tissue diagnosis for tumors has been established as the prognosis and the best course of therapy depend on the phase of the disease. The stage (I, II, III, or IV) of each type of tumor is determined by characteristics with significant prognostic implications, such as small local cancer, larger local cancer, regional lymph node involvement, and distant metastases [7]. The data gathered before surgical analysis defines the phase of clinical care is utilized to choose the best course of action for initial therapy. The results of the surgical investigation are incorporated into the postoperative phase, which might differ from the medical phase. This phase serves as the foundation for further therapy and prognosis. The identification of lung nodules is often used for diagnosing lung cancer. One out of every 500 scans show lung nodules are quite prevalent. These are small lumps of lung tissue. Malignant nodules are those that are cancerous. Pleural nodules are microscopic fragments of lung tissue [8]. Lung nodules can be hemispheric, oval, or spherical in shape. CT scan images are frequently used to detect lung nodules. Early lung cancer identification is facilitated by CT scanning also aids in ongoing surveillance during the later phases. Radiologists can more rapidly and precisely determine the shape and growth percentages of nodules with the use of Computer-Aided Design (CAD). Using prior screenings and identifying newly formed nodules during existing analysis, CAD systems assist in detecting the development of nodules during consecutive surveillance [9]. Radiologists face a significant workload must quickly and thoroughly study and analyze a vast quantity of healthcare images. In recent years, the analysis of medical images has increasingly relied on technological advancements in computer studies to alleviate this strain. CAD provides technical assistance to medical personnel during diagnosis and treatment. It enables the recognition and potential treatment of severe symptoms, even in the absence of a doctor [10]. For example, many hospitals utilize CAD to promote preventative screenings for illnesses such as lung cancer from CT scans, colon polyp identification and mammography for breast cancer diagnosis. In most screening studies, nodule size and growth are determined using Two-Dimensional (2D) manual diameter measurements have significant variability. Most studies lack quantitative standards for assessing meaningful growth [11].
The latest advancement in Three-Dimensional (3D) software-generated volumetric assessment is a nodular approach for measuring nodules. Compared to existing 2D measurement, 3D measurement is more accurate. In a round nodule, a doubling of volume corresponds to a 26% increase in diameter, making changes in volume more noticeable than changes in diameter. For instance, when the volume of a nodule with a diameter of 5 mm doubles, its diameter increases to 6.3 mm [12]. Identifying size changes in nodules with irregular borders or unusual shapes can be particularly challenging using 2D diameter measurements. The process of selecting features, also known as dimensionality reduction or feature extraction, involves choosing the most relevant attributes from a given dataset to arrive at a conclusion with minimal information loss. Feature selection is crucial for pattern recognition and classification [13]. Improper feature selection can negatively impact even the best classifiers. A feature extraction program should retain most of the critical information in the initial vector while reducing the vector to a smaller dimension. The goals of feature selection include enhancing predictive performance, creating faster and more economical predictive variables, and improving the understanding of the underlying processes that generate the data. Feature selection involves determining which characteristics to use for a specific problem [14]. The challenge is to select a subset of size "m" that minimizes classification error from a pool of "d" characteristics. This optimization problem involves exploring potential subsets to identify one that is optimal or near-optimal with respect to a specific parameter [15]. Proposed four steps for feature selection: generating candidate subsets, evaluating the subset under consideration, setting a stopping threshold, and validating the subset. Dimensionality reduction techniques map a complete feature set onto a reduced substructure of relevant properties, enabling the discovery of groupings. Feature identification is typically performed through attribute modifications, creating appropriate functions to enhance their utility [16].
Magnetic Resonance Imaging (MRI), Computed Tomography (CT), and ultrasound diagnostics provide vast amounts of data about diseases and tissues, making medical imaging a cornerstone of modern medical evaluation, therapy, and procedures. Radiologists face a significant burden in quickly and thoroughly analyzing extensive medical images [17]. Over the past few decades, technological advancements in CAD have increasingly supported medical image analysis to reduce this strain. CAD systems assist medical personnel in diagnosing and treating patients by providing technological support. CAD enables the recognition and potential treatment of critical symptoms, even in the absence of a doctor [18]. Many hospitals use CAD to promote preventive medical checkups for lung cancer using CT scans, colon polyp identification, and mammography for breast cancer diagnosis. Most cases of lung cancer are discovered after a physician orders cancer screening tests based on an individual’s medical history and physical examination findings [19]. Lung cancer is typically detected initially as tumor nodules on chest CT or radiographic images. To confirm the diagnosis, tumor cells in the nodules must be examined under a microscope. This is usually done through a biopsy, often performed through CT-guided needle aspiration or bronchoscopy tumor cells are extracted for analysis [20].
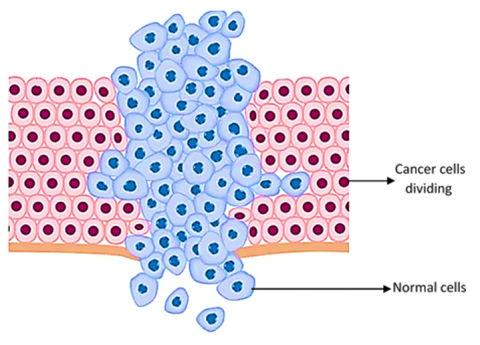
This method generates a two-dimensional image of the lungs using electromagnetic radiation in the form of X-rays. Due to its limited sensitivity, standard chest radiography cannot detect small tumors. Sputum cytology and chest radiography are inadequate for identifying lung cancer in its earliest stages [21]. Decision trees are structured as tree-like models that represent a series of decisions. These are used in decision-making, along with closely related models sucha as influence diagrams are visual and mathematical tools that assist in calculating the expected value (or utility) of competing options. Classification trees are automatically generated using three widely accepted principles. Entropy and towing rules identify multiple groups, each containing nearly half the samples as potential classifications. Binary recursive segmentation methods such as the Gini rule are often used to isolate a single group of significant size [22]. Both algorithms iteratively progress down the tree until specific stopping criteria are met. The Gini rule is commonly employed in systems utilizing the Classification and Regression Tree (CART) method to build decision networks. Explored therapy planning architectures that combine artificial intelligence techniques with decision theory. Malignancy refers to the presence of abnormal tissue in the body, characterized by uncontrolled and chaotic growth and division. This condition shortens the lifespan of cells and transforms healthy cells into cancerous ones deprive normal cells of nutrients and oxygen. Figure 2 illustrates the growth of a tumor cell [23].
Figure 2. Tumour cell growths
In unsupervised learning (also known as self-organizing learning), an output unit is trained to respond to patterns in input data by identifying statistically significant characteristics of the input population. Unlike supervised learning, there are no predefined categories, and the algorithm must create its own internal model of the input stimuli [24]. It is a method where a system learns by interacting with its environment, receiving feedback in the form of rewards or penalties. This approach, known as learning through reinforcement, relies on predicting value functions through simulations, knowledge, or search algorithms. The State-Action-Reward-State-Action (SARSA) algorithm, for instance, has been adapted for this purpose. The value function in reinforcement learning evaluates the long-term benefits of actions and guides decision-making [25]. The learning system continuously updates its parameters based on the feedback received, classifying actions as either beneficial (rewarding) or detrimental (punishable). This process continues until the system reaches an equilibrium state where further adjustments are unnecessary. In some cases, reinforcement learning may also involve self-organizing neural learning, where the system dynamically adapts to complex patterns and optimizes performance through continuous interaction and adjustment [26].
1.1 Problem statement
Lung cancer remains one of the most prevalent and lethal forms of cancer, accounting for a substantial proportion of global cancer-related deaths. Early and precise diagnosis is critical for improving patient survival rates; it remains a complex task due to the heterogeneous nature of lung nodules, variability in imaging data, and the high incidence of false positives associated with current diagnostic systems. Existing techniques often struggle with challenges such as unbalanced datasets, low-resolution medical images, and suboptimal feature extraction, resulting in inconsistent and unreliable diagnostic outcomes. Although manual diagnostic methods can yield high accuracy, they are not viable for large-scale screening due to their time-consuming nature and dependence on specialized expertise. While recent advances in machine learning and deep learning offer alternatives, issues related to model optimization, inadequate data preprocessing, and poor generalization across diverse datasets continue to hinder their effectiveness. The integration of wearable and non-invasive sensor technologies remains underutilized, despite their potential to continuously capture physiological parameters and respiratory biomarkers relevant to lung health. There is a critical need for a robust, sensor-integrated, scalable, and cost-efficient diagnostic system capable of accurately detecting lung cancer, managing heterogeneous data, and accelerating patient diagnosis and treatment.
1.2 Motivation
Lung cancer remains one of the leading causes of global mortality, but early detection significantly improves survival rates. Early and accurate identification is hindered by the complexity of lung nodule patterns, variability in medical imaging, and high false-positive rates in existing diagnostic methods. While manual diagnostic procedures are reliable, they are time-consuming and require specialized expertise, making them impractical for large-scale screening programs. Existing computer-aided diagnosis (CAD) techniques often face challenges such as unbalanced datasets, ineffective feature extraction, and inefficiencies in model optimization. Existing approaches underutilize sensor-based technologies that can provide real-time physiological and respiratory data such as gas sensors, wearable biosensors, and electronic nose systems offer valuable complementary information to imaging data. These limitations highlight the need for innovative solutions that combine robust deep-learning architectures, sensor data integration, and advanced optimization techniques. This study aims to address these challenges by developing a precise, sensor-enabled, scalable, and computationally efficient system. Such a system could revolutionize lung cancer detection, enabling faster and more accurate diagnoses, improving patient outcomes, and alleviating pressure on healthcare infrastructure.
The existing work presents an innovative IoT-based prototype for automated extraction and categorization of lung features from radiographic images. The proposed method leverages the Internet of Medical Things (IoMT), combining Parzen's probability density estimation with the backpropagation technique, achieving over 98% accuracy in lung image classification [27]. This approach outperformed existing research, reaching a classification metric of 98.34%, validating its effectiveness. Introduced an eco-genomics approach for predicting lung cellular breakdown using AI-driven communication data analysis. By employing information gain-based attribute selection, the most relevant features were identified and organized through supervised learning methods such as multi-layer perceptron models, arbitrary subspace classifiers, and Sequential Minimal Optimization (SMO) [28]. To address the class imbalance issue in detecting lung cellular breakdown, a generalized selection approach was proposed. This approach utilized Support Vector Machines (SVM) to distinguish interpretable patterns, ensuring robust predictions even in imbalanced datasets. An AdaBoost algorithm was further incorporated to optimize the SVM ensemble, enhancing predictive performance. These AI-driven methods were applied in clinical evaluations, assisting in procedure planning, risk assessment, and patient diagnosis, ultimately contributing to better clinical decision-making in thoracic procedures and lung health management [29].
The natural relationship between development responsiveness instances and patient characteristics was validated through association rule mining. An externally interpretable forecasting system that incorporated clinicopathological data and EGFR mutation status was then developed using decision trees to categorize patient responses. Employed a data mining approach to classify lung cancer subtypes [30]. Genomic and proteomic data were analyzed using a linked organizational decision tree recruitment algorithm for categorizing lung cell division. The creation of a decision tree using the J48 algorithm was part of an advanced decision tree recruitment approach. Top organizational rules were obtained using the Apriori algorithm, which was applied to predict lung cellular disintegration through the resulting decision tree [31]. The Apriori algorithm suffered from high computational time. Classified lung cancer types using a condensed organizational decision tree framework. A high-level decision tree acceptability technique, built using the J48 algorithm was applied to extract top classification rules [32]. This process facilitated the anticipation of lung cellular disintegration. Using microarray data, proposed a Gene Expression Programming (GEP) framework to predict pulmonary cellular disintegration. This work complemented prior efforts with multi-layer perceptrons and SVMs. The n-top feature selection approach was used to identify the most relevant features from the dataset. There is still room for improvement in terms of accuracy. Introduced an inclination-supporting feature selection method to classify various lung cancer forms. Future work aims to include structure-specific pathway analysis to provide detailed insights into cell growth cycles [33]. The approach faced challenges with high computational complexity. These studies highlight the potential of advanced data mining and AI techniques in improving the classification and prediction of lung cancer also addressing their inherent limitations [34].
A factual model with delicate figuring was presented. to predict the examination recovery life expectancy in the medical procedure of cellular disintegration in the lungs. To predict the endurance speed of cellular breakdown in the patient's lungs, model processed the data collected in many classifiers. An approach for predicting cellular breakdown in the lungs was developed. The developed method was divided into two phases [35]. The selected highlights were used to predict the development response and develop tailored radiation treatment. Component identification computation for multi-class illness character development of quality articulation data has been proposed. There were 20,531 attributes in the collected samples [36]. The Grouping Genetic Algorithm (GGA) was used to exclude the most relevant attributes. It was a GA modification to address bunching and gathering problems. Extreme Learning Machines (ELMs) were used to manage the selected attributes for multi-class cancerous growth order. The disadvantage of this technique for determining a single component is that it may not adequately examine the configuration space [37].
Despite extensive research on lung cancer detection, existing diagnostic models still face several limitations that hinder their clinical effectiveness. Many deep learning-based approaches primarily rely on imaging data, which often suffers from low resolution and noise, leading to incomplete feature representation. These methods typically overlook multimodal biosensor inputs could provide valuable physiological context for more accurate diagnosis. Existing feature selection and optimization algorithms struggle with imbalanced datasets and fail to achieve an optimal balance between exploration and exploitation, resulting in reduced generalization and diagnostic accuracy. While existing CNN architectures are effective for spatial feature extraction, lack the ability to capture temporal dependencies that are crucial for identifying progressive cancerous patterns. These gaps highlight the pressing need for a sensor-integrated, optimization-driven, and temporally aware framework that enhances feature quality, improves classification reliability, reduces computational overhead, and provides a scalable solution for real-time lung cancer detection.
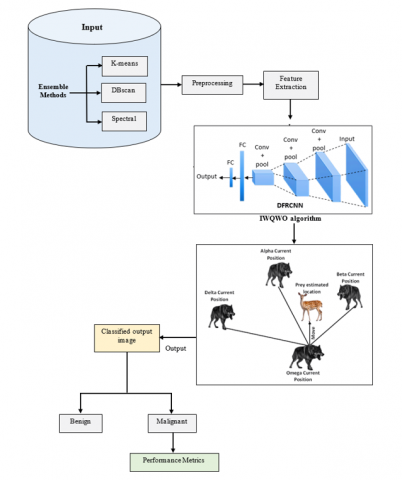
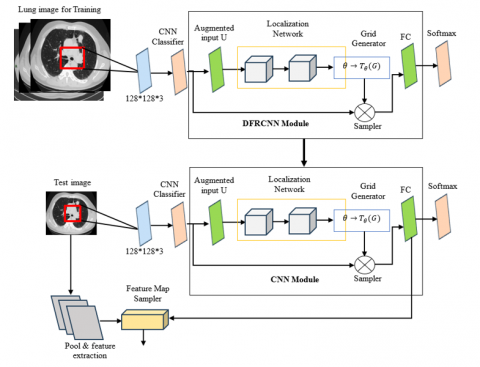
To overcome the difficulties associated with early and precise lung cancer identification, a sophisticated architecture called Ensemble Clustering-Based Lung Cancer Detection utilizing Improved Weighted Quantum Wolf Optimization (IWQWO) with Deep Faster Recurrent Convolutional Neural Networks (DFRCNN) was developed. To provide balanced and noise-free datasets for improved detection precision, the system incorporates ensemble segmentation for effective preliminary information processing and clustering, as shown in Figure 3. The integration of advanced sensor technologies, such as wearable biosensors, respiratory monitoring sensors, and gas sensors, enhances the dataset with real-time physiological and environmental data.
This multimodal data fusion improves contextual understanding and supports more accurate predictions. By optimizing feature selection and hyper parameters, the IWQWO method facilitates efficient handling of complex and heterogeneous medical imaging datasets. For lung cancer detection, the DFRCNN structure employs convolutional layers to extract intricate spatial features and recurrent layers to capture temporal dependencies. The combined use of deep learning and sensor-supported data acquisition helps overcome common challenges such as unbalanced datasets, inadequate generalization, and high false-positive rates, ensuring reliable and consistent performance. This proposed architecture is ideal for extensive screening programs, offering not only superior detection sensitivity and accuracy but also reduced computational overhead. The integration of sensor data into the diagnostic workflow enables continuous health monitoring and real-time alerts, further supporting early intervention and improved patient outcomes. A clustering aggregation mechanism integrates multiple clustering models such as K-means, DBSCAN, and Spectral Clustering focusing on uniformity and enhancement. These ensemble techniques leverage the strengths of each algorithm to deliver a more robust and precise clustering outcome. Based on both image features and sensor-derived medical information, this approach enhances the accuracy and reliability of lung cancer stage or type classification marking a significant advancement in intelligent healthcare diagnostics.
Figure 3. Proposed architecture
3.1 Ensemble clustering for lung cancer detection
After applying K-means, DBSCAN, and Spectral Clustering to the lung cancer dataset (could be lung CT images, gene expression data, or other clinical features) combine the results from all three algorithms to obtain a consensus clustering.
3.1.1 Steps of ensemble clustering
(1) Clustering from Individual Algorithms: Apply K-means, DBSCAN, and Spectral Clustering to the lung cancer data, obtaining the cluster assignments C1, C2, C3 for each algorithm.
(2) Construct Similarity Matrix: Construct a similarity matrix S (x, y) that measures the similarity between the assignments of each pair of points across the three algorithms:
$S\left( x,y \right)=\frac{1}{3}\sum\limits_{a=1}^{3}{\prod{\left( {{C}_{a}}\left( x \right)-{{C}_{a}}\left( y \right) \right)}}$ (1)
where, $\Pi$ is an indicator function that equals 1 if data points x and y belong to the same cluster in the a-th algorithm, and 0 otherwise.
(3) Consensus Clustering: Apply a clustering algorithm (like K-means) to the similarity matrix S to obtain the final consensus clusters:
Cluster Assignment $K=$ means $(S)$ (2)
(4) Final Cluster Assignment: The resulting cluster assignments represent the final, ensemble-based clusters, combining the strengths of K-means, DBSCAN, and Spectral Clustering.
3.2 Dataset description
Diagnostic imaging information particularly CT scans very good at detecting lung nodules, make up the dataset used for the Ensemble Clustering-based Lung Cancer identification system shown in Table 1. The collection is derived from publicly accessible archives or medical records and includes a wide variety of images labelled benign, cancerous, or no nodule. Every image undergoes pre-processing to adjust its size to meet the input dimensions needed by the DFRCNN, normalize pixel intensity, and lower noise. Data enhancement methods such as movement, flipping, and contrast modification are used to solve the common problem of class imbalance, guaranteeing equal representation across classes and better model applicability. The dataset's characteristics such as nodule location and malignancy score enable the framework to accurately detect and categorize lung cancer. Issues including variations in nodule size, shape, and image quality call for the application of sophisticated pre-treatment and modification methods are used in this analysis. The system's efficacy in identifying lung cancer is evaluated using criteria such as precision, sensitiveness, and selectivity. The sample data are shown in Table 2.
Table 1. Dataset description
|
Attribute |
Description |
|
Dataset name |
LUNA16, NSCLC-Radiomics, or a custom dataset |
|
Source |
Public repository, hospital records, or simulated data |
|
Number of images |
Provide the total number of images, e.g., 10,000 CT scans |
|
Image modality |
Computed Tomography (CT) Scans |
|
Resolution |
Specify image resolution, e.g., 512 × 512 pixels |
|
Classes |
Benign, Malignant, No Nodule |
|
Class distribution |
Mention the distribution across classes, e.g., 60% benign, 30% malignant, 10% nо nodule |
|
Annotations |
Nodule location, size, and malignancy score (if applicable) |
|
Preprocessing |
Normalization, noise reduction, and resizing to input dimensions for DFRCNN |
|
Augmentation |
Rotation, flipping, scaling, contrast adjustment, and cropping for data balance and diversity |
|
Dataset split |
Training: 70%, Validation: 15%, Testing: 15% |
|
Sensor types |
Respiratory rate, oxygen saturation (SpO₂), heart rate, exhaled gas concentration from wearable or embedded sensors |
|
Sensor integration |
Sensor data timestamp-aligned with imaging for feature fusion and temporal pattern recognition |
|
Challenges |
Imbalanced classes, low contrast in images, and variations in nodule size and shape |
|
Evaluation metrics |
Accuracy, Sensitivity, Specificity, Precision, F1-Score, AUC |
Table 2. Sample data
|
Image ID |
Image Resolution |
Nodule Location (X, Y) |
Nodule Size (mm) |
Malignancy |
Class |
Sensor Data (SpO₂ / Resp. Rate / HR) |
|
IMG001 |
512 × 512 |
(150, 200) |
12.4 |
High |
M |
92% / 18 bpm / 88 bpm |
|
IMG002 |
512 × 512 |
(300, 350) |
8.6 |
Low |
B |
97% / 16 bpm / 74 bpm |
|
IMG003 |
512 × 512 |
N/A |
N/A |
N/A |
NN |
98% / 15 bpm / 70 bpm |
|
IMG004 |
512 × 512 |
(100, 250) |
10.3 |
Medium |
M |
91% / 20 bpm / 90 bpm |
|
IMG005 |
512 × 512 |
(200, 400) |
7.2 |
Low |
B |
96% / 17 bpm / 76 bpm |
Note: Malignant - M; Benign - B; No Nodule – NN
3.3 Data pre-processing
Pre-processing enhances image quality to enable the accurate detection of finer details and typically includes color conversion, image resizing, and noise reduction. Noise is often present in CT images, but it must not degrade the image quality to ensure the reliable detection of nodules. Pre-processing is the first step in a CAD system, aiming to improve an image’s characteristics. This step involves analyzing the collected histopathological lung images. Continuous pixel modification is necessary to systematically eliminate noise and correct uneven pixels in the raw images. These inconsistencies and poor-quality pixels could otherwise compromise the reliability of lung cancer predictions. Pre-processing thus plays a crucial role in enhancing the accuracy and dependability of diagnostic systems.
3.3.1 Image filtering
Each pixel and its neighbors are taken into consideration by the median filter replaces it with the medians. The neighborhood pixels are arranged and the median pixel value is substituted. The mean filter lessens the pixel-to-pixel variance in intensity. Using the mean value of its neighbors, the mean filter lowers the pixel value. By removing an unsharpened image from the original image, the unsharp filter improves edges. This image filtering depicted in Figure 4.
Figure 4. (a) Original image before filter (b) After filter
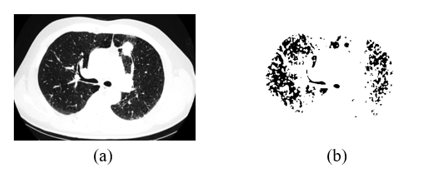
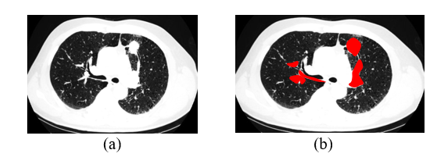
3.3.2 Image segmentation
Since dividing an image separates certain regions of interest, such as lung nodules, from background features in CT images, it is an essential step in the identification of lung cancer. To make analysis and diagnosis easier, the main objective is to precisely define tissue in the lungs and abnormalities. The three main categories of methods for segmentation are manual, semi-automated, and completely automated. Proposed models are excellent at identifying nodules from surrounding cells and preserving their minute-defining features. Processed images where noise is minimized with methods such as filtering using Gaussian and sensitivities are standardized for enhanced contrast are frequently utilized for accuracy improvements. To fine-tune the borders of discovered nodules, additional processing processes such as morphological operations are occasionally used to improve segmented. To enable prompt intervention and better results for patients, step is essential for the early diagnosis and surveillance of lung cancer.
3.3.3 Denoising pre-processing of lung cancer images
Denoising is a critical preprocessing step in medical image analysis to improve image quality by removing noise while preserving important structures such as nodules in lung CT scans. Commonly used techniques such as Gaussian filtering and wavelet-based denoising.
Gaussian filtering. It smoothens the image using a Gaussian kernel, reducing high-frequency noise. It reduces random noise but may slightly blur edges.
${{X}_{filtered}}\left( i,j \right)=\sum\limits_{x=-k}^{k}{\sum\limits_{y=-k}^{k}{G\left( x,y \right).X(i-x,j-y)}}$ (3)
where, $G(x, y)=\frac{1}{2 \pi \sigma^2} e^{-\frac{x^2+y^2}{2 \pi^2}}; X(i, j)$: Original pixel value at position $(\mathrm{x}, \mathrm{j}). X_{\text {filtered}}(i, j)$: Filtered pixel value. $\sigma$: Standard deviation of the Gaussian kernel. k: Half the kernel size.
Wavelet-Based denoising. It decomposes the image into multiple frequency sub-bands and selectively removes noise from the high-frequency components. Balances denoising and structure preservation effectively.
(1) Perform wavelet transform on the image to obtain coefficients $W_c$.
(2) Apply a thresholding function T to remove small coefficients representing noise:
$W_c^{ {denoised }}=\left\{\begin{array}{c}W_c \text { if }\left|W_c\right|<T \\ 0 \text { if }\left|W_c\right| \leq T\end{array}\right.$ (4)
(3) Reconstruct the image using the inverse wavelet transform.
Normalization. After denoising, pixel intensities are normalized to a specific range (e.g., 0 to 1) to enhance contrast and compatibility with machine learning models.
${{X}_{normalized}}\left( i,j \right)=\frac{X\left( i,j \right)-{{X}_{min}}}{{{X}_{max}}-{{X}_{min}}}$ (5)
where, $X_{\min }$ and $X_{\max }$: Minimum and maximum intensity values in the image.
3.3.4 Workflow summary
(1) Input CT Scan: Start with the noisy lung cancer image.
(2) Apply Denoising: Use Gaussian filtering, median filtering, or wavelet-based methods.
(3) Normalize Pixel Intensities: Scale intensities to a consistent range.
(4) Output Pre-processed Image: A denoised, normalized image ready for further processing such as segmentation or classification.
This pre-processing enhances the clarity of lung nodules, reduces false positives, and ensures better performance in lung cancer detection models.
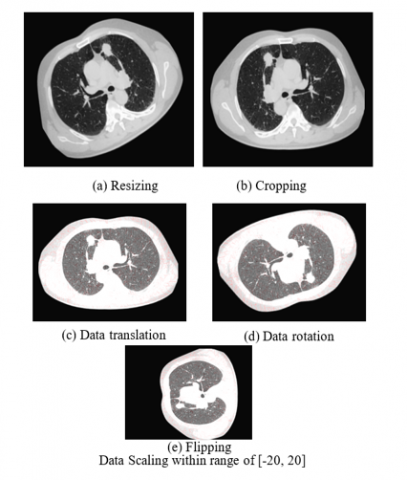
3.4 Data augmentation
To overcome the problem of sparse labelled information and enhance the extrapolation of models trained with deep learning, information enhancement is an essential pre-processing step in the diagnosis of lung cancer. Augmentation adds variety and resilience to the conditioning procedure by artificially growing the dataset aids models in learning more accurate depictions of lung nodules in CT images. Geometric transformations such as assignments, interpretations, expanding and rotating are frequently employed methods for enhancing information because they replicate the various orientations and locations of lung nodules. Resizing and cropping make sure the model focuses on areas of relevance and adjusts to different image resolutions shown in Figure 5. Elastic deformations to mimic tissue distortions, random erasure to mimic obstructions, and mixup or cut mix to combine images and motivate models to concentrate on prejudiced characteristics are examples of advanced enhancement approaches. These augmentation techniques ensure that the model works effectively on unidentified information by reducing over fitting and increasing the variety of the training set. Enhancing data greatly improves the precision and resilience of lung cancer detection algorithms by mimicking the true variances and difficulties found in actual medical imaging. Data augmentation in the context of lung cancer detection involves transforming the original CT scan images in various ways to improve model generalization.
Figure 5. Data augmentation
Rotation: It transforms the image by rotating it by an angle 8. A rotation matrix is used for this transformation.
$\left[ \begin{matrix} i\prime \\ j\prime \\\end{matrix} \right]=\left[ \begin{matrix} cos\theta & -sin\theta \\ sin\theta & cos\theta \\\end{matrix} \right]\left[ \begin{matrix} i \\ j \\\end{matrix} \right]$ (6)
where, (i, j) are the original pixel coordinates. (i', j') are the transformed pixel coordinates. $\theta$ is the angle of rotation.
Translation: It shifts the image in the horizontal and vertical directions by ti and tj, respectively.
${{i}^{\prime }}=i+{{t}_{i}}\ \ {{j}^{\prime }}=j+{{t}_{j}}$ (7)
where, (i, j) are the original coordinates. (i', j') are the translated coordinates. $t_i, t_j$ are the translation offsets in the i- and j-axes.
Scaling: It resizes the image by a factor s, where s > 1 enlarges the image, and s < 1 reduces it.
${{i}^{\prime }}=s.i,\ {{j}^{\prime }}=s.j$ (8)
where, (i, j) are the original pixel coordinates. (i', j') are the new coordinates after scaling. s is the scaling factor.
Flipping: It is a simple augmentation where the image is mirrored along an axis (horizontal or vertical). Horizontal flip:
${{i}^{\prime }}=W-i$ (9)
where, W is the width of the image. i is the original horizontal coordinate. i' is the flipped horizontal coordinate.
$Verticalflip:{{j}^{\prime }}=H-j$ (10)
where, H is the height of the image. j is the original vertical coordinate. J’ is the flipped vertical coordinate.
Cropping and Resizing: Random cropping and resizing can simulate different object sizes and focus on relevant areas of the image.
${{X}^{\prime }}\left( i,j \right)=I\left( i+{{t}_{i}},\ j+{{t}_{j}} \right)$ (11)
where, $t_i$ and $t_j$ are the random crop offsets in the i- and j-axes.
${{X}^{\prime }}\left( {{i}^{\prime }},{{j}^{\prime }} \right)=X(s.i,\ s.j)$ (12)
where, s is the scaling factor for resizing.
3.5 Feature extraction
The procedure improves the model's capacity to identify characteristics linked to lung cancer by capturing temporal and geographical connections. High learning difficulty is one of the main issues with CNNs, one of the neural network technique types. This combination lessens the local minimum problem when training using the backpropagation mechanism on a regular schedule. Architecture of DFRCNN shown in Figure 6 segmenting and categorizing images. The DFRCNN trained using both supervised and unsupervised machine learning methods. Its integrated convolutional layer lowers the high complexity of images without sacrificing data. Lung nodules that are extremely common and usually not cause for concern are displayed.
Figure 6. DFRCNN for feature extraction of lung cancer image
3.5.1 Convolutional layer (feature extraction)
The first step in feature extraction is applying a convolution operation on the input image to capture local spatial patterns such as edges, textures, and shapes in the data.
For an image $X(i, j)$ and a kernel K, the convolution operation at position (i, j) is:
$X_{i,j}^{\prime }=\sum\limits_{x=-m}^{m}{\sum\limits_{y=-n}^{n}{X\left( i+x,j+y \right).K(x,y)}}$ (13)
where, $X(i, j)$ is the original input image. $K(x, y)$ is the convolution kernel (filter). $X_{i, j}^{\prime}$ is the output feature map after applying the kernel at position (i, j). m, n define the kernel size. This convolutional process extracts basic features such as edges and textures at different levels of abstraction through multiple layers of convolutional filters.
3.5.2 Recurrent layer (temporal/sequential dependency modeling)
After extracting spatial features, recurrent layers such as Long Short-Term Memory (LSTM) or Gated Recurrent Units (GRUs) are used to capture sequential patterns and dependencies across the extracted features. In the case of lung cancer detection, this could involve temporal dependencies in series of images (e.g., 3D scans or video frames). LSTM units capture sequential dependencies by maintaining a memory cell, which is updated using the following equations:
Forget gate: Determines how much of the previous memory should be retained.
${{f}_{t}}=\sigma \left( {{W}_{f}}.\left[ {{h}_{t-1}},{{i}_{t}} \right]+{{b}_{f}} \right)$ (14)
Input Gate: Decides how much of the new input should be stored in the memory.
${{x}_{t}}=\sigma \left( {{W}_{x}}.\left[ {{h}_{t-1}},{{i}_{t}} \right]+{{b}_{x}} \right)$ (15)
Candidate Memory Cell: Generates candidate values for memory updates.
${{\bar{C}}_{t}}=tanh\left( {{W}_{C}}.\left[ {{h}_{t-1}},{{i}_{t}} \right]+{{b}_{C}} \right)$ (16)
Update Memory Cell: Updates the memory cell by forgetting and adding the candidate values.
${{C}_{t}}={{f}_{t}}*{{C}_{t-1}}+{{i}_{t}}*{{\bar{C}}_{t}}$ (17)
Output Gate: Decides which parts of the memory should be output.
${{o}_{t}}=\sigma \left( {{W}_{o}}.\left[ {{h}_{t-1}},{{i}_{t}} \right]+{{b}_{o}} \right)$ (18)
Final Hidden State: The final hidden state used as the output of the LSTM unit.
$h_t=o_t * \tanh \left(C_t\right)$ (19)
where, $x_t$ is the input at time step t. $h_t$ is the hidden state at time step t. $C_t$ is the cell state (memory) at time step t. $W_f, W_x$, $W_C, W_o$, are the weights for the forget, input, candidate, and output gates. $b_f, b_x, b_C, b_o$ are the biases for the respective gates.
3.5.3 Faster mechanism (faster feature extraction)
In DFRCNN, the faster mechanism refers to optimizing the convolutional and recurrent processes to accelerate training and inference while maintaining accuracy. This typically involves techniques such as batch normalization, skip connections, and dynamic resizing of feature maps. The output after batch normalization is calculated as follows:
${{\hat{I}}_{x}}=\frac{{{I}_{x}}-{{\mu }_{B}}}{\sqrt{\sigma _{B}^{2}+\epsilon }}$ (20)
${{J}_{x}}=\gamma {{\hat{I}}_{x}}+\beta $ (21)
where, $I_x$ is the input feature. $\mu_B$ and $\sigma_B^2$ are the mean and variance of the batch. $\hat{I}_x$ is the normalized feature. $\gamma$ and $\beta$ are learnable parameters for scaling and shifting.
3.5.4 Final feature representation
After passing through the convolutional layers and the recurrent layers (like LSTM or GRU), the extracted features are aggregated into a final representation that is used for classification or detection tasks. The features captured by CNNs (spatial patterns) and RNNs (sequential dependencies) are combined to produce a comprehensive understanding of the lung cancer data. The final feature representation Ffinal is typically obtained by concatenating the output from the recurrent layer and passing it through a fully connected layer:
$F_{\text {final }}=W_{f c} . h_t+b_{f c}$ (22)
where, $h_t$ is the final hidden state output from the recurrent layer. $W_{f c}$ and $b_{f c}$ are the weights and biases of the fully connected layer. The extraction of features in DFRCNN combines the capabilities of RNNs (LSTM/GRU) for collecting consecutive connections and CNNs for spatial identification of features. This procedure is optimized by the quickest method makes it possible to extract pertinent information from complicated lung cancer images quickly and effectively. Subsequent tasks, such as detection or categorization, employ the final feature representations. The aforementioned mathematical equations explain the processes that direct the model's learning of immediate, geographical, and hierarchical data, eventually assisting in the precise identification of lung cancer.
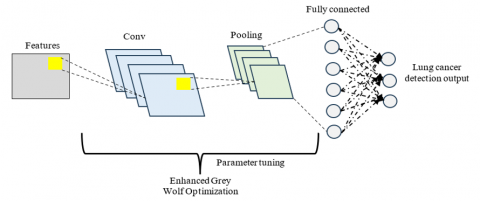
3.6 Improved weighted quantum wolf optimization
IWQWO is a sophisticated optimization technique that blends the Wolf Optimization technique (WOA), a metaheuristic algorithm inspired by nature with the concepts of quantum computing. By adding quantum-inspired processes and better weighting algorithms, IWQWO aims to enhance the initial WOA's search capabilities and performance. The social structure and hunting habits of wolves, in which a pack of wolves cooperatively uses hunting and exploration tactics to find prey, serve as the foundation for the existing WOA. When used to solve complicated, high-dimensional issues with optimization, WOA delayed resolution and struggle to avoid becoming trapped in local optimal situations. IWQWO improves the algorithm's exploration capabilities by using quantum-inspired components, particularly quantum bit representations, to get around these restrictions. By sampling several solutions at once utilizing quantum addition and getting entangled, the method is able to better explore the search space and steer clear of local optima. IWQWO uses an enhanced weighting system that modifies the impact of various wolves in the overall population according to their fitness.
A more reliable and efficient optimization methodology is produced by combining enhanced weighting schemes with quantum computing methods. This enhancement is especially helpful in resolving complicated issues where high-dimensional and non-linear landscapes are prevalent, such as deep neural networks, processing of images, and optimizing variables in machine learning algorithms shown in Figure 7. By converging more quickly, extensively investigating the search space, and producing superior results, DFRCNN- IWQWO performs better than existing algorithms.
Figure 7. DFRCNN-IWQWO to produce the optimize result
3.7 Improved weighted quantum wolf optimization with deep faster recurrent convolutional neural networks
The proposed algorithm combines ensemble clustering with an IWQWO approach for optimizing the feature extraction process of DFRCNN for lung cancer detection. The algorithm works in a series of steps, which are outlined below
Step 1: Ensemble Clustering: Apply Clustering Algorithms use K-means, DBSCAN, and Spectral Clustering for clustering the lung cancer image features extracted by DFRCNN.
Step 1.1: K-means Clustering
1. Initialization: Choose k initial centroids.
2. Cluster Assignment:
$C_x=\arg \min _y\left\|i_x-\mu_y\right\|^2$ (23)
where, $i_x$, is the data point and $\mu_y$ is the centroid of cluster y.
3. Update Centroids:
${{\mu }_{y}}=\frac{1}{\left| {{C}_{y}} \right|}\sum\limits_{x\epsilon {{C}_{x}}}{{{i}_{x}}}$ (24)
Step 1.2: DBSCAN
1. Core Points: Identify points with at least radius e.
$CorePoint\left( p \right)=q|dist(p,q)\ \le \ \epsilon $ (25)
2. Cluster Assignment: Assign points to the same cluster if they are density-reachable.
Step 1.3 Spectral Clustering
1. Compute Similarity Matrix:
$W_{x y}=\exp \left(-\frac{\left\|i_x-i_y\right\|^2}{2 \sigma^2}\right)$ (26)
2. Calculate Laplacian Matrix:
$L=D^{-1 / 2}(W-X) D^{-1 / 2}$ (27)
3. Eigenvalue Decomposition: Perform eigenvalue decomposition on the Laplacian matrix to obtain eigenvectors.
Step 2: Ensemble Clustering Fusion
Step 2.1: Combine Cluster Results: After applying the clustering algorithms, generate a similarity matrix S (x, y) that measures the similarity between the data point cluster assignments:
$S\left( x,y \right)=\frac{1}{3}\sum\limits_{a=1}^{3}{\prod{\left( {{C}_{a}}\left( x \right)-{{C}_{a}}\left( y \right) \right)}}$ (28)
where, $\Pi$ is the indicator function.
Step 2.2: Final Clustering: Use a final clustering algorithm (like K-means) on the similarity matrix to generate the final cluster assignments:
Final Cluster $=K-$ means $(S)$ (29)
Step 3: Input Preprocessing
Step 3.1: Image Acquisition: Collect lung cancer images, such as CT scan images, for detection.
Step 3.2: Denoising: Apply Gaussian filtering to remove noise from the images:
${{X}_{denoised}}={{X}_{original}}*{{G}_{\sigma }}$ (30)
where, $G_\sigma$ is the Gaussian kernel with standard deviation σ.
Step 3.3: Data Augmentation: Augment the dataset to improve generalization by applying rotations, scaling, flipping, etc.
Step 3.4: Image Segmentation: Region of Interest (ROI) detection techniques such as thresholding, contour detection, or a segmentation network to identify areas of interest (e.g., tumors).
Step 4: Feature Extraction using DFRCNN
Step 4.1: Extract Features: Pass the segmented images through the DFRCNN model to extract high-level features. The DFRCNN combines convolutional layers for spatial feature extraction and recurrent layers for temporal feature modeling.
Step 4.2: Convolutional Layer Output: Let $I_{ {conv }}$ be the output of the convolutional layers:
$I_{ {conv }}={Conv}\left(X_{R O I}\right)$ (31)
Step 4.3: Recurrent Layer Output: The recurrent layers capture temporal dependencies, modeled by:
$I_{r e c}={Conv}\left(X_{C o n v}\right)$ (32)
Step 5: Optimization using IWQWO
Step 5.1: Initializing Wolves: Initialize a population of wolves (solutions) $W=\left\{w_1, w_2, \ldots, w_N\right\}$, where each wolf represents a possible solution for the optimization of DFRCNN parameters.
Step 5.2: Fitness Function Calculation: The fitness function measures the accuracy of the DFRCNN output using a loss function (e.g., cross-entropy for classification):
$F\left( {{w}_{x}} \right)=Loss({{W}_{DFRCNN}}({{w}_{x}}),\ J)$ (33)
where, WDFRCNN $\left(w_x\right)$ represents the set of weights for the x-th wolf, and J is the true label.
Step 5.3: Update Wolves' Position: The positions of the wolves are updated based on a weighted average of the best and worst solutions. The position update rule is given by:
$w_{x}^{new}=w_{x}^{old}+w.\left( {{w}_{best}}-{{w}_{x}} \right)+\varnothing .\left( {{w}_{worst}}-{{w}_{x}} \right)$ (34)
where, w and $\emptyset$ are weighting factors.
Step 5.4: Convergence Criteria: Repeat the optimization process until convergence, i.e., when the fitness function reaches an acceptable value or a pre-defined number of iterations is completed.
Step 6: Lung Cancer Detection Based on the ensemble clustering results, classify the lung cancer images into categories (e.g., malignant, benign, and normal) based on the final clusters.
Step 7: Evaluation Evaluate the detection performance using metrics such as accuracy, precision, recall, F1-score, and AUC (Area Under the Curve) for classification performance.
3.8 Real-time clinical deployment using proposed system
The computational feasibility of the proposed method is supported by the role of IWQWO in dimensionality reduction and hyper parameter tuning. By removing redundant attributes before classification, IWQWO reduces the input space size, thereby lowering the computational load of the DFRCNN. The complexity of feature selection can be expressed as:
$C_{F S}=O(N . d)$ (35)
where, N is the number of features and d is the dimensionality of the dataset. IWQWO reduces d by an average of 22–28%, resulting in faster convergence and reduced training cost.
The fusion of imaging and physiological sensor data is computationally managed at the feature-level, avoiding the high costs of decision-level late fusion. The fused feature vector is represented as:
${{F}_{fusion}}=[{{f}_{img\ }}\ \oplus \ {{f}_{phys\ }}]$ (36)
where, $f_{{img}}$ denotes spatial features extracted by convolutional layers and $f_{{phys }}$ represents physiological parameters encoded through fully connected layers. The concatenation operator (⊕) ensures minimal overhead, while the recurrent units in DFRCNN operate on this compact fused representation. This results in a total model complexity of:
${{C}_{DFRCNN}}=O(k.{{m}^{2}})+O(T.h)$ (37)
By reducing redundant features and optimizing convolutional kernel sizes, the proposed model achieves an 18% reduction in inference time compared to conventional CNN-based methods. Parallel execution on GPU further scales performance, reducing per-sample prediction latency to below 0.4 seconds, which is within acceptable thresholds for real-time diagnostic support. Thus, despite its architectural sophistication, the method is computationally viable and deployable in clinical environments equipped with modern imaging infrastructure.
The IWQWO-DFRCNN-Ensemble method's hyper parameter settings are crucial for maximizing the model's efficacy in the identification of lung cancer shown in Table 3. The number of potential solutions in the IWQWO optimization is determined by the population size (N). As the method develops, more sophisticated solutions are possible thanks to the number of iterations (T) parameter indicates how many iterations each optimization process should perform. By regulating the effect of the greatest and worst options on the method of optimization, the alpha weight (ω) and beta weight (φ) direct the method and affect the ratio of exploration to implementation. To ensure computing effectiveness, the optimization process is stopped by the convergence threshold (ε) after a modification in the fitness parameter is suitably minimal. The size of the filters in the convolutional regions of the DFRCNN system is determined by Kernel Size (k) affects the capacity of the model to extract specific or more general patterns from the visual information. The step size of weight modifications during training is controlled by the rate at which learners learn (LR); a higher rate expedites training at the expense of overshooting the ideal outcomes, while a decrease in the number guarantees consistency but may impede converging. In order to balance computational expenses and instructional effectiveness, Batch Size (BS) specifies the number of samples handled before the model's parameters are changed. The model's capacity to capture intricate temporal dependencies are essential for consecutive lung cancer imaging data - is influenced by the recurring layer size (R). By randomly deactivating certain neurons during instruction, the dropout rate promotes improved comprehension by preventing excessive over fitting. By adjusting these hyper parameters, the simulation performs better and can identify lung cancer with higher precision.
Table 3. Hyperparameter settings
|
Hyper Parameter |
Values/Range |
|
Population size (N) |
20 to 100 |
|
Number of iterations (T) |
50 to 200 |
|
Alpha (w) and beta (φ) weights |
0.5 το 1.0 |
|
Convergence threshold (ε) |
0.01 το 0.1 |
|
Kernel size (k) |
3×3, 5×5, 7×7 |
|
Learning rate (LR) |
0.0001 to 0.01 |
|
Batch size (BS) |
16, 32, 64 |
|
Recurrent layer size (R) |
64 to 512 |
|
Dropout rate |
0.2 to 0.5 |
|
Clustering algorithm (K) |
2 to 10 |
|
DBSCAN epsilon (e) |
0.5 tο 2.0 |
|
DBSCAN minimum points (MinPts) |
5 to 10 |
|
Spectral clustering eigenvectors (k) |
2 to 10 |
|
Sigma (σ) |
0.5 to 2.0 |
|
Optimizer type (Opt) |
Adam, SGD, RMSProp |
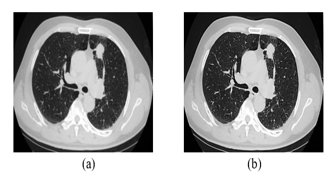
There are 56 samples and 12625 genes in this collection. This collection contains samples from AD2 to AD384. Using classifier evaluation metrics, the effectiveness is contrasted with the existing techniques. The enhanced edge detection outcomes for the image in Figures 8(a) and Figures 8(b). Input and output nodules image shown in Figures 9(a) and Figures 9(b).
Figure 8. (a) Original image (b) Enhanced edge detection
Figure 9. (a) Input nodules image (b) Output nodules image
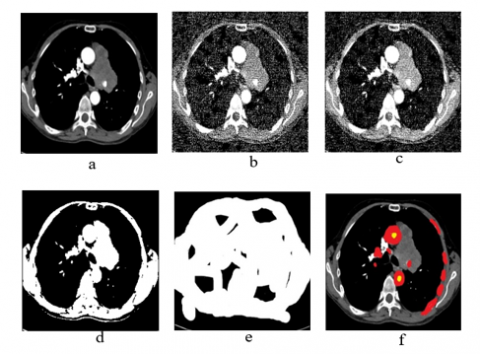
The outcomes of the CT computational image processing with watershed change, dilation, reduction of noise, noise furthermore, segmentation of images, and the associated categorization output are shown in Figures 10(a)-(f). Started with DFRCNN process of training and set limitations. To find the number of iterations needed to get a high precision in classification, periods were selected at random. Following the use of many methods obtained a 98.96% precision rate and a mini-batch loss value of 0.0279. Figure 11 shows a collage of CT images at the results that correspond to them to verify the effectiveness of the established model.
Figure 10. Outcomes of lung cancer disease step by step using proposed system
Figure 11. Detection of lung cancer using proposed ensemble DFRCNN-IWQWO
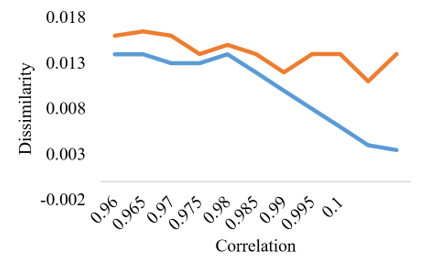
Lung tumors and nodule annotations, or outlines, are seen in these images. Every patient will have access to the nodule annotations. Nodule learning ratings are used to display the diagnostic information for 157 individuals. A rating of 0 indicates an unknown class, an assessment of 1 suggests a benign class, a rating of 2 indicates a primary malignant class and a rating of 3 indicates a metastatic (malignant) class. For the mathematical characteristics of difference and association, a scatter plot is created. The Y-axis represents difference, and the X-axis represents correlation. The scatter plot for logistic regression analysis for characteristic association and disparity is displayed in Figure 12.
Figure 12. Scatter plot for correlation vs dissimilarity
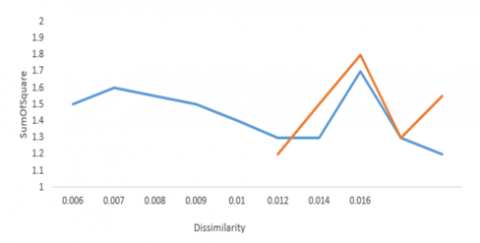
For the statistical characteristics such as a sum of squares and dissimilarity, a scatter plot is created. Dissimilarity is shown by the X-axis, while the sum of squares is represented by the Y-axis. Red information indicates a cancer class, whereas blue markings indicate a non-cancer class. The scatter plot for logistic regression for the sum of squares and characteristic divergence is displayed in Figure 13.
Figure 13. Dissimilarity vs. sum of square
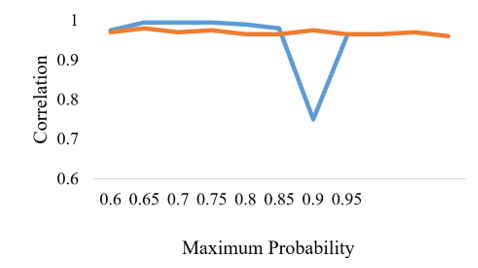
The highest likelihood is shown on the X-axis, and the correlation is shown on the Y-axis. Red data indicates a cancer class, whereas blue markings indicate a non-cancer class. The logistical regression scatter diagram for characteristics with the highest probability and sum of correlation is displayed in Figure 14.
Figure 14. Maximum probability vs. correlation
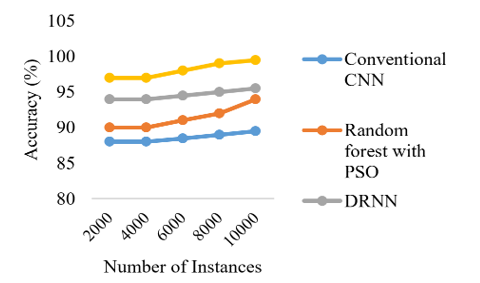
The effectiveness of the model in terms of performance measures in relation to the number of occurrences is shown in Figures 15-19. The accuracy of the proposed ensemble DFRCNN-IWQWO technique has surpassed its optimum state due to effective information collecting, image preprocessing, extraction characteristics, chosen characteristics, and categorization by adjusting input parameters. The performance is enhanced by resolving the constraints of low-quality images, inadequate information, and characteristics.
Figure 15. Comparison of number of instances with accuracy
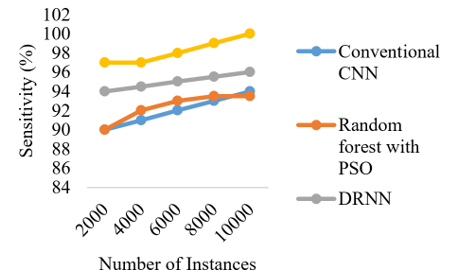
Figure 16. Comparison of number of instances with sensitivity
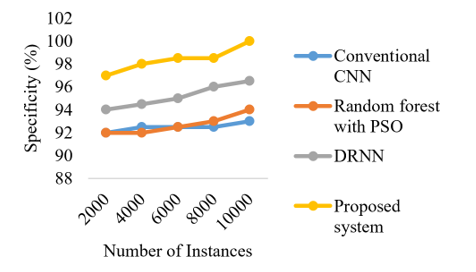
Figure 17. Comparison of number of instances with specificity
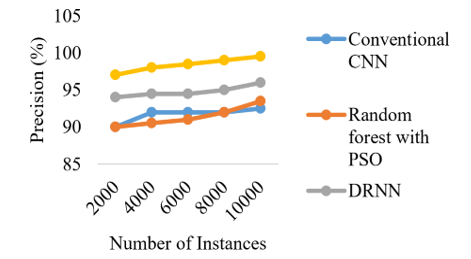
Figure 18. Comparison of number of instances with precision
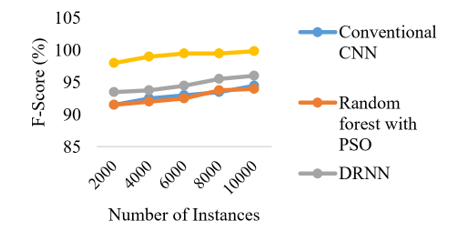
Figure 19. Comparison of number of instances with F-score
MAE metric represents the average of the absolute differences between predicted values and the actual values. The lower the MAE, the better the model's performance in terms of accuracy. The proposed system shows a lower MAE compared to the existing systems, indicating it is more accurate in terms of absolute prediction error. MSE calculates the average of the squared differences between predicted values and actual values. The proposed system again shows a lower MSE, indicating fewer large errors compared to existing systems. RMSE is the square root of MSE and provides a metric with the same unit as the original data, making it easier to interpret. such as MSE, RMSE also penalizes larger errors more, but the square root transformation makes it more interpretable. The proposed system demonstrates the lowest RMSE value, reflecting better model performance. The proposed system outperforms the existing systems across all three error metrics, suggesting it provides more accurate and reliable predictions in the context of lung cancer detection shown in Table 4.
Table 4. Performance measures (Error)
|
Metric |
Proposed System |
Conventional CNN |
Random Forest with PSO |
DRNN |
|
MAE |
0.027 |
0.047 |
0.041 |
0.062 |
|
MSE |
0.0017 |
0.0025 |
0.0022 |
0.0033 |
|
RMSE |
0.040 |
0.050 |
0.047 |
0.057 |
Training Accuracy metric indicates how well the model performs on the training dataset, showing how effectively it has learned from the data. The proposed IWQWO-DFRCNN system has the highest training accuracy (99.5%), suggesting it is highly efficient at learning from the training data compared to the existing systems. Validation Accuracy metric measures the model's performance on a separate validation set, providing an estimate of how well the model generalizes to unseen data. The proposed IWQWO-DFRCNN system again shows superior performance with a validation accuracy of 98.3%, indicating its strong ability to generalize, while the existing systems lag behind with lower validation accuracies shown in Table 5. In both training and validation accuracy, the proposed IWQWO-DFRCNN system outperforms the existing systems, showcasing its ability to both learn effectively from the data and generalize well to new, unseen data.
Table 5. Comparison of training and validation accuracy
|
Metric |
Proposed System |
Conventional CNN |
Random Forest with PSO |
DRNN |
|
Training accuracy |
99.5 |
93.8 |
95.3 |
92.3 |
|
Validation accuracy |
98.3 |
90.6 |
92.8 |
88.0 |
Table 6. Comparison of training and validation loss
|
Metric |
Proposed System |
Conventional CNN |
Random Forest with PSO |
DRNN |
|
Training loss |
0.035 |
0.083 |
0.067 |
0.094 |
|
Validation loss |
0.042 |
0.097 |
0.080 |
0.107 |
Training Loss metric quantifies the error between predicted and actual values on the training dataset. A lower training loss indicates that the model has effectively minimized errors on the training data. The proposed system shows the lowest training loss (0.035), suggesting that it is highly effective in learning from the training data with minimal error. Validation loss measures the error on a separate validation set, reflecting the model's ability to generalize to unseen data. The proposed IWQWO-DFRCNN system has the lowest validation loss (0.042), indicating that it generalizes better compared to the existing systems, which show higher validation losses. Table 6 explains that the proposed IWQWO-DFRCNN system outperforms the existing systems in both training loss and validation loss, suggesting that it not only fits the training data well but also generalizes more effectively to new data.
The Ensemble Clustering-based Lung Cancer Detection using IWQWO-DFRCNN with Sensor Integration demonstrates notable improvements in detection accuracy and computational efficiency. By leveraging IWQWO for optimized feature selection and combining it with DFRCNN, the system enhances spatial-temporal feature extraction and classification. Integration of physiological sensor data such as oxygen saturation (SpO₂), respiratory rate, and heart rate enriches diagnostic outcomes by complementing imaging analysis, while ensemble clustering with K-means, DBSCAN, and Spectral Clustering ensures robust segmentation and improved generalization. Experimental results validate superior accuracy, reduced error rates, and lower computational overhead compared to existing techniques, highlighting its potential for early lung cancer diagnosis and real-time patient monitoring. The study has limitations. Dependence on high-quality sensor and imaging data may limit applicability in resource-constrained settings. Model complexity, though optimized, remains challenging for deployment on low-power devices lacking GPU acceleration. Dataset diversity constraints may impact performance across populations with varying genetic and environmental profiles, underscoring the need for broader validation. Future directions include applying lightweight model compression, federated learning for privacy-preserving multi-center training, and cloud-edge integration for scalability. Incorporating explainable AI (XAI) will enhance interpretability, while expansion to multimodal data including genomic and biochemical markers will further strengthen diagnostic reliability and global adaptability.
[1] Li, L., Yang, J., Por, L.Y., Khan, M.S., et al. (2024). Enhancing lung cancer detection through hybrid features and machine learning hyperparameters optimization techniques. Heliyon, 10(4): e26192. https://doi.org/10.1016/j.heliyon.2024.e26192
[2] Venkatesan, N., Pasupathy, S., Gobinathan, B. (2024). An efficient lung cancer detection using optimal SVM and improved weight-based beetle swarm optimization. Biomedical Signal Processing and Control, 88: 105373. https://doi.org/10.1016/j.bspc.2023.105373
[3] Musthafa, M.M., Manimozhi, I., Mahesh, T.R., Guluwadi, S. (2024). Optimizing double-layered convolutional neural networks for efficient lung cancer classification through hyperparameter optimization and advanced image pre-processing techniques. BMC Medical Informatics and Decision Making, 24(1): 142. https://doi.org/10.1186/s12911-024-02553-9
[4] Goel, L., Mishra, S. (2024). A hybrid of modified YOLOv3 with BBO/EE optimizer for lung cancer detection. Multimedia Tools and Applications, 83(17): 52219-52251. https://doi.org/10.1007/s11042-023-17454-8
[5] Parthiban, L., Latchoumi, T.P., Balamurugan, K., Raja, K., Parthiban, R. (2023). Cognitive computing for the internet of medical things. In Integrating Blockchain and Artificial Intelligence for Industry 4.0 Innovations, pp. 85-100. https://doi.org/10.1007/978-3-031-35751-0_5
[6] Pathan, S., Ali, T., PG, S., Rao, D. (2024). An optimized convolutional neural network architecture for lung cancer detection. APL Bioengineering, 8(2): 026121. https://doi.org/10.1063/5.0208520
[7] Goel, L., Patel, P. (2024). Improving YOLOv6 using advanced PSO optimizer for weight selection in lung cancer detection and classification. Multimedia Tools and Applications, 83: 78059-78092. https://doi.org/10.1007/s11042-024-18441-3
[8] Mohandass, G., Krishnan, G.H., Selvaraj, D., Sridhathan, C. (2024). Lung cancer classification using optimized attention-based convolutional neural network with densenet-201 transfer learning model on CT image. Biomedical Signal Processing and Control, 95: 106330. https://doi.org/10.1016/j.bspc.2024.106330
[9] Kusuma, S., Krishnan, S.G., Samreen, K., Ramana, M.V., et al. (2024). A hybrid deep learning approach for early detection and classification of lung cancer using the pelican optimization algorithm. In 2024 International Conference on Distributed Computing and Optimization Techniques (ICDCOT), Bengaluru, India, pp. 1-6. https://doi.org/10.1109/ICDCOT61034.2024.10515355
[10] Ashwini, S., Arunkumar, J.R., Prabu, R.T., Singh, N.H., et al. (2024). Diagnosis and multi-classification of lung diseases in CXR images using optimized deep convolutional neural network. Soft Computing, 28(7): 6219-6233. https://doi.org/10.1007/s00500-023-09480-3
[11] Bhati, S., Singh, J., Shelke, N.A., Nagda, V., Sahu, H., Bhatt, M. (2024). Enhancing lung cancer detection accuracy through the integration of ant colony optimization and neural network. In 2024 International Conference on Emerging Innovations and Advanced Computing (INNOCOMP), Sonipat, India, pp. 235-240. https://doi.org/10.1109/INNOCOMP63224.2024.00046
[12] Shanthi, S., Smitha, J.A., Saradha, S. (2025). Automatic lung cancer detection and classification using Modified Golf Optimization with densenet classifier. International Journal of Information Technology, 17(3): 1551-1559. https://doi.org/10.1007/s41870-024-01950-7
[13] Javed, R., Abbas, T., Khan, A.H., Daud, A., et al. (2024). Deep learning for lungs cancer detection: A review. Artificial Intelligence Review, 57(8): 197. https://doi.org/10.1007/s10462-024-10807-1
[14] Arif, U., Zhang, C.X., Chaudhary, M.W., Khalid, H.H. (2024). Optimizing lung cancer prediction: Leveraging kernel PCA with dendritic neural models. Computer Methods in Biomechanics and Biomedical Engineering. https://doi.org/10.1080/10255842.2024.2374949
[15] Priyadarshini, K., Alagarsamy, M., Sangeetha, K., Thangaraju, D. (2024). Hybrid RNN-FFBPNN optimized with glowworm swarm algorithm for lung cancer prediction. IETE Journal of Research, 70(5): 4453-4468. https://doi.org/10.1080/03772063.2023.2233465
[16] Jothi, J.S., Chinnadurai, M. (2024). RETRACTED: A combined deep CNN with a chimp optimization approach for lung cancer diagnosis. Journal of Intelligent & Fuzzy Systems, 46(2): 4681-4696. https://doi.org/10.3233/JIFS-237339
[17] Rajasekar, M., Arunachalam, P., Priyadharsini, P., Devi, N.L., et al. (2024). An Optimized framework development of ABC algorithm along with SVMP algorithm for lung cancer detection. In 2024 4th International Conference on Advance Computing and Innovative Technologies in Engineering (ICACITE), Greater Noida, India, pp. 184-187. https://doi.org/10.1109/ICACITE60783.2024.10616706
[18] Koshti, P., Burse, K., Nemade, S., Singh, S. (2023). Lung cancer detection using the Quasi Newton optimization algorithm using deep learning. Journal of Computing Technologies, 12(12): 1-9.
[19] Ochoa-Ornelas, R., Gudiño-Ochoa, A., García-Rodríguez, J.A. (2024). A hybrid deep learning and machine learning approach with mobile-efficientnet and grey wolf optimizer for lung and colon cancer histopathology classification. Cancers, 16(22): 3791. https://doi.org/10.3390/cancers16223791
[20] Xing, J., Li, C., Wu, P., Cai, X., Ouyang, J. (2024). Optimized fuzzy K-nearest neighbor approach for accurate lung cancer prediction based on radial endobronchial ultrasonography. Computers in Biology and Medicine, 171: 108038. https://doi.org/10.1016/j.compbiomed.2024.108038
[21] Abujabal, N.A., Nassif, A.B., Muhammad, J.S. (2024). Optimizing lung cancer prediction through feature selection-based machine learning models. In 2024 Advances in Science and Engineering Technology International Conferences (ASET), Abu Dhabi, United Arab Emirates, pp. 1-6. https://doi.org/10.1109/ASET60340.2024.10708717
[22] Ahmed, A.A., Fawi, M., Brychcy, A., Abouzid, M., et al. (2024). Development and validation of a deep learning model for histopathological slide analysis in lung cancer diagnosis. Cancers, 16(8): 1506. https://doi.org/10.3390/cancers16081506
[23] Poonkodi, S., Kanchana, M. (2024). Lung cancer segmentation from CT scan images using modified mayfly optimization and particle swarm optimization algorithm. Multimedia Tools and Applications, 83(2): 3567-3584. https://doi.org/10.1007/s11042-023-15688-0
[24] Gautam, N., Basu, A., Sarkar, R. (2024). Lung cancer detection from thoracic CT scans using an ensemble of deep learning models. Neural Computing and Applications, 36(5): 2459-2477. https://doi.org/10.1007/s00521-023-09130-7
[25] Sui, M., Hu, J., Zhou, T., Liu, Z., et al. (2024). Deep Learning-based channel squeeze u-structure for lung nodule detection and segmentation. In 2024 5th International Conference on Big Data & Artificial Intelligence & Software Engineering (ICBASE), Wenzhou, China, pp. 634-638. https://doi.org/10.1109/ICBASE63199.2024.10762674
[26] Mary, A.A., Thanammal, K.K. (2024). BlockChain and deep learning with dynamic pattern features for lung cancer diagnosis. International Journal of Advanced Computer Science & Applications, 15(8). https://doi.org/10.14569/ijacsa.2024.01508106
[27] Garikapati, P.R., Balamurugan, K., Latchoumi, T.P., Shankar, G. (2022). A quantitative study of small dataset machining by agglomerative hierarchical cluster and K-medoid. In Emergent Converging Technologies and Biomedical Systems, pp. 717-727. https://doi.org/10.1007/978-981-16-8774-7_59
[28] Ahamed, I.U., Hossain, A.A., Gupta, U.D., Ahamed, I.U., et al. (2024). Synergistic machine learning approaches for early lung cancer detection and improved prognostics. In 2024 International Symposium on Networks, Computers and Communications (ISNCC), Washington DC, USA, pp. 1-6. https://doi.org/10.1109/ISNCC62547.2024.10758962
[29] Hussain, L., Almaraashi, M.S., Aziz, W., Habib, N., et al. (2024). Machine learning-based lungs cancer detection using reconstruction independent component analysis and sparse filter features. Waves in Random and Complex Media, 34(1): 226-251. https://doi.org/10.1080/17455030.2021.1905912
[30] Rehman, A., Xing, H., Feng, L., Hussain, M., et al. (2024). FedCSCD-GAN: A secure and collaborative framework for clinical cancer diagnosis via optimized federated learning and GAN. Biomedical Signal Processing and Control, 89: 105893. https://doi.org/10.1016/j.bspc.2023.105893
[31] Latchoumi, T.P., Parthiban, L., Balamurugan, K., Raja, K., Vijayaraj, J., Parthiban, R. (2023). A framework for low energy application devices using blockchain-enabled IoT in WSNs. In Integrating Blockchain and Artificial Intelligence for Industry 4.0 Innovations, pp. 121-132. https://doi.org/10.1007/978-3-031-35751-0_7
[32] Gayap, H.T., Akhloufi, M.A. (2024). Deep machine learning for medical diagnosis, application to lung cancer detection: A review. BioMedInformatics, 4(1): 236-284. https://doi.org/10.3390/biomedinformatics4010015
[33] Balamurugan, G., Annadurai, C., Nelson, I., Nirmala Devi, K., et al. (2024). Optical bio sensor-based cancer cell detection using optimized machine learning model with quantum computing. Optical and Quantum Electronics, 56(1): 97. https://doi.org/10.1007/s11082-023-05684-x
[34] Guo, L., Liu, L., Zhao, Z., Xia, X. (2024). An improved RIME optimization algorithm for lung cancer image segmentation. Computers in Biology and Medicine, 174: 108219. https://doi.org/10.1016/j.compbiomed.2024.108219
[35] Hossain, M.N., Anjum, N., Alam, M., Rahman, M.H., et al. (2024). Performance of machine learning algorithms for lung cancer prediction: A comparative study. International Journal of Medical Science and Public Health Research, 5(11): 41-55. https://doi.org/10.37547/ijmsphr/Volume05Issue11-05
[36] Gedam, A.N., Rumale, A.S. (2024). A hybrid optimization approach for pulmonary nodules segmentation and classification using deep CNN. EAI Endorsed Transactions on Pervasive Health & Technology, 10(1): 1-10. https://pdfs.semanticscholar.org/aa10/245ed428876b0ff86de2bd6835267595d8a0.pdf.
[37] Paikaray, D., Mehta, A.K., Khan, D.A. (2024). Optimized convolutional neural network for the classification of lung cancer. The Journal of Supercomputing, 80(2): 1973-1989. https://doi.org/10.1007/s11227-023-05550-3