Najlaa M. Hadi*![]() | Baidaa Y. Mohemed
| Baidaa Y. Mohemed![]() | Ibtesam O. Radi
| Ibtesam O. Radi![]() | Saja M. Hussein Ali
| Saja M. Hussein Ali![]()
© 2025 The authors. This article is published by IIETA and is licensed under the CC BY 4.0 license (http://creativecommons.org/licenses/by/4.0/).
OPEN ACCESS
In this study, 100 mL of distilled water were used to prepare red cabbage dye solutions at varying concentrations (0.002 g, 0.004 g, and 0.006 g) to investigate how concentration affects optical properties without altering the material's nature. Spectral analysis showed a clear increase in absorption within the visible range (400 nm-700 nm) with higher dye concentrations, indicating strong light-harvesting potential. Subsequently, 1.6 g of zinc oxide (ZnO) nanoparticles were added to each solution. Four solar cells were arranged at the edges of a square basin filled with the dye-ZnO mixtures to evaluate their effect on solar cell efficiency. Results showed a general improvement in efficiency across all concentrations. The highest solar efficiency was recorded at 0.004 g dye with a light concentrator, outperforming the baseline efficiency of 0.6% without it. When epoxy resin was added along with ZnO nanoparticles, the best efficiency shifted to a dye concentration of 0.002 g, suggesting enhanced nanoparticle stability and improved energy transfer. Fluorescence spectra revealed shifts in emission intensity with varying concentrations and ZnO presence, reflecting complex interactions. The dye's quantum yield increased with concentration up to 0.004 g before declining due to self-quenching effects at higher levels. These findings demonstrate that ZnO nanoparticles and epoxy resin synergistically improve the optical and photovoltaic properties of natural red cabbage dye for Solar Applications.
natural dye, Zinc Oxide, absorption, solar cell, efficiency, scanning electron MICROSCOPY, luminescence, epoxy resin
In the face of escalating global energy demands, climate change, and the depletion of fossil fuel reserves, the shift toward renewable and sustainable energy resources has become a global imperative. Among the various forms of renewable energy, solar energy stands out as the most abundant, inexhaustible, and universally accessible resource. Every hour, the Earth receives more energy from the Sun than the entire world consumes in a year. However, the effective harnessing and conversion of this energy into electricity remains a scientific and engineering challenge [1].
Conventional photovoltaic (PV) technologies, such as silicon-based solar cells, have achieved commercial success due to their relatively high efficiencies and long-term stability. Nevertheless, their production involves energy-intensive processes and costly materials, raising concerns about sustainability, particularly in developing countries. In contrast, dye-sensitized solar cells (DSSCs) offer a low-cost, lightweight, and environmentally friendly alternative that mimics natural photosynthesis by using dyes to absorb sunlight and generate electricity [2-4].
The core components of a DSSC include a photoanode (usually Titanium dioxide or Zinc Oxide), a sensitizer dye, an electrolyte, and a counter electrode. The performance of DSSCs heavily relies on the light-harvesting ability of the dye, which must efficiently absorb visible light and inject electrons into the conduction band of the semiconductor. While synthetic dyes, particularly those based on ruthenium complexes, have shown high performance, they suffer from high costs, complex synthesis, and potential environmental toxicity [5].
This has led to a growing body of research into natural dyes extracted from plant sources, which offer several advantages: they are biodegradable, non-toxic, widely available, and inexpensive. Among the various classes of natural pigments, anthocyanins—a subclass of flavonoids—have garnered attention for their ability to absorb light in the visible spectrum, particularly in the 500-600 nm range. These pigments are found in fruits, flowers, and vegetables, such as blueberries, hibiscus, black rice, and notably, red cabbage (Brassica oleracea var. capitata f. rubra) [6-8].
Red cabbage is an especially promising candidate for DSSCs due to its high concentration of anthocyanins, water solubility, and stability under acidic conditions. Anthocyanins exhibit pH-dependent coloration, ranging from red in acidic environments to greenish-yellow in alkaline ones. This property reflects changes in the molecular structure, which also affects their light absorption and emission behavior—critical characteristics in photovoltaic applications [9].
However, one of the major limitations of natural dyes is their relatively low photostability and poor binding affinity to semiconductor surfaces, which can limit the efficiency and lifetime of the solar cell. To address these challenges, recent studies have explored the use of nanotechnology to enhance the interaction between dyes and semiconductors, improve charge transfer dynamics, and reduce recombination losses [10].
Among the most promising nanomaterials for DSSCs is zinc oxide (ZnO), a wide-bandgap (3.37 eV) semiconductor with high exciton binding energy (60 meV), low toxicity, and versatile nanostructuring capabilities. ZnO can be synthesized in various forms—nanorods, nanowires, nanoparticles—and offers excellent electron mobility and large surface area for dye loading [11-13]. When integrated with natural dyes, ZnO nanoparticles (ZnO NPs) can facilitate better anchoring of dye molecules, enhance light scattering, and improve overall device efficiency.
Furthermore, ZnO nanoparticles exhibit unique optical and electronic properties at the nanoscale due to quantum confinement effects. They can participate in energy transfer processes with organic dyes, acting as both electron conductors and optical enhancers. Moreover, they can reduce dye aggregation and photodegradation by providing a more favorable environment for dye adsorption [14, 15].
In addition to photovoltaic measurements, optical characterization techniques such as UV-Vis absorbance spectroscopy and fluorescence (photoluminescence) spectroscopy are essential for understanding the interaction between dyes and nanoparticles. These techniques reveal important parameters such as absorption peaks, emission wavelengths, and Stokes shifts, which provide insights into the energy levels and transitions involved in light harvesting [16].
This research aims to investigate the optical and photovoltaic behavior of red cabbage dye as a photosensitizer in DSSCs and to evaluate the enhancement effects of ZnO nanoparticles on its performance. Specifically, we focus on:
The extraction and characterization of red cabbage anthocyanins.
The synthesis and stabilization of ZnO nanoparticles.
The preparation and testing of DSSCs with and without ZnO incorporation.
Comparative analysis of absorbance, fluorescence, and current-voltage (I-V) characteristics.
Exploring the mechanisms by which ZnO nanoparticles influence light absorption, emission behavior, and solar cell efficiency.
By combining natural materials with nanostructured semiconductors, this study contributes to the ongoing efforts to develop green, cost-effective, and scalable photovoltaic technologies [17]. The findings may pave the way for future innovations in eco-friendly solar energy conversion systems, particularly in regions with abundant natural resources and limited access to high-tech manufacturing.
2.1 Materials
Fresh red cabbage (Brassica oleracea var. capitata f. rubra) was selected as the natural dye source due to its rich content of anthocyanin pigments [18]. The dye extraction process was conducted in a controlled environment to preserve the color integrity and chemical stability of the anthocyanins. Zinc oxide (ZnO) nanoparticles [19], with particle sizes ranging from 10 to 30 nm, were procured from SkySpring Nanomaterials Inc. (USA), a certified ISO 9001 manufacturer. All other chemicals and reagents used were of analytical grade, and distilled water was used throughout all experiments to avoid contamination.
2.2 Preparation of red cabbage dye extract
Red cabbage leaves were first thoroughly washed with distilled water to eliminate surface impurities. The cleaned leaves were then chopped and soaked in distilled water and subjected to gentle heating at 75℃. The mixture was boiled slowly to avoid pigment degradation, and approximately 20% of the water volume was evaporated to concentrate the extract while retaining its characteristic odor and color.
After boiling, the mixture was filtered to separate the liquid dye extract. The residual pulp was oven-dried at 75℃ for 10 hours, and then mechanically ground into a fine powder. This powder served as a dry pigment stock for preparing dye solutions of different concentrations.
To prepare the dye solutions, 1.0 g, 2.0 g, and 3.0 g of the powdered red cabbage dye were each dissolved in 1 liter of distilled water, resulting in three concentrations. These aqueous dye solutions were stirred magnetically for 30 minutes to ensure complete dissolution. The UV-Vis absorbance spectra and fluorescence spectra of each solution were then measured using a UV-Vis spectrophotometer and a fluorescence spectrometer, respectively.
2.3 Preparation of ZnO nanoparticles suspension and concentration calculations
ZnO nanoparticles were weighed using a high-precision analytical balance. A mass of 0.8 g of ZnO was added per gram of dye in accordance with the application concentration equation below [20].
$C=W \times 1000 \backslash M w \times V$ (1)
where,
C: is the concentration of ZnO nanoparticles (mol/L). W: is the weight of ZnO in grams. Mw: is the molecular weight of ZnO (81.38 g/mol). V: is the volume of the solvent in milliliters.
Each nanoparticle-dye mixture was prepared by dispersing ZnO nanoparticles into 200 mL of distilled water via ultrasonication for 30 minutes to achieve a homogeneous colloidal solution. This nanomaterial suspension was then added to the previously prepared dye solutions at varying volumes, from 10 mL to 100 mL, based on dye concentration.
2.4 Optical characterization
All dye solutions—before and after the addition of ZnO nanoparticles—were subjected to optical analysis. The absorbance was measured over a wavelength range of 300-800 nm using a UV-Vis spectrophotometer, and fluorescence emission was measured by exciting the samples at a fixed wavelength (typically near the absorption maximum) and recording the emission spectra. Measurements were repeated for each dye concentration (1 g/L, 2 g/L, and 3 g/L) both in the presence and absence of ZnO.
2.5 Solar cell fabrication and efficiency measurement
An experimental luminescent solar concentrator (LSC) setup was designed for evaluating the photovoltaic performance of the dye solutions. The LSC consisted of a rectangular transparent basin filled with the dye solutions, in which four commercial silicon-based solar cells were mounted along the sides to capture the light emitted by the dye under solar simulation.
The solar cells were tested under identical illumination conditions for all dye concentrations, with and without ZnO nanoparticles. The output current (I) and voltage (V) of each cell were measured using a digital multimeter, and the power conversion efficiency (η) was calculated using the standard photovoltaic efficiency formula:
$\eta=P_{\text {out }} \backslash P_{\text {in }} \times 100=I \times V \backslash A \times G \times 100$ (2)
where,
I: is the output current. V: is the output voltage. A: is the area of the solar cell. G: is the incident solar power per unit area (typically 1000 W/m² under standard test conditions) [21].
The baseline efficiency of the solar cell without dye was measured to be 0.600%. All experiments were repeated three times to ensure reproducibility. The improvement or reduction in efficiency upon dye addition and nanoparticle doping was documented for each concentration.
3.1 Luminescent materials
To maintain an efficient concentration system, luminescent materials require certain properties. An emission spectrum that fits the band gap of the employed photovoltaic cell, a broad range of absorbance, improved absorbance efficiency, and little overlap between the emission spectrum and absorbance to prevent reabsorption, and stability in the face of external weather conditions are some of these characteristics. In comparison to inorganic fluorescent dyes, the initial luminescent materials utilized in LSC often have high quantum efficiency and are reasonably priced. It is also discovered that some of them are rather stable. They do, however, exhibit a significant overlap between their emission and absorption spectra, which results in significant losses from reabsorption [22].
To maintain an efficient luminescent solar concentrator (LSC) system, luminescent materials must possess several critical properties. These include a broad absorption range, high absorbance efficiency, an emission spectrum that matches the bandgap of the employed photovoltaic cell, minimal overlap between absorption and emission spectra (to avoid reabsorption losses), and chemical as well as photonic stability under environmental exposure [23, 24].
A key parameter affecting LSC performance is the Stokes shift, which represents the energy difference between the maximum absorption and emission wavelengths. Materials with a large Stokes shift help minimize reabsorption by ensuring that re-emitted photons are not reabsorbed by the same or adjacent molecules [25].
Another fundamental property is the quantum yield, defined as the ratio of photons emitted to photons absorbed. High quantum yield dyes, especially organic fluorophores, can significantly enhance the photon harvesting capability of LSCs [26]. Although inorganic phosphors tend to be more stable under prolonged exposure to light and temperature, they often have lower quantum yields and require more complex synthesis routes [27].
Moreover, the refractive index of the waveguiding matrix plays an important role in light trapping. Materials with a suitable refractive index can support total internal reflection (TIR), effectively guiding the emitted light toward the photovoltaic edges with minimal loss [28].
In recent years, ZnO nanoparticles have emerged as promising additives in luminescent systems. Their wide bandgap (~3.37 eV), high exciton binding energy, and efficient photoluminescence characteristics make them excellent candidates to enhance both absorbance and emission in dye-based systems. ZnO can also reduce non-radiative recombination and improve the overall energy transfer within the matrix [29].
Stability is another concern in LSCs. Many organic dyes are susceptible to photobleaching—a degradation under UV exposure. Therefore, integrating photostable inorganic materials or hybrid organic-inorganic composites is considered an effective strategy to enhance durability [30].
3.2 Photovoltaic cell (solar cell)
The solar cell, one kind of electronic device that directly converts light energy into electrical power, is a photovoltaic cell, often referred to as a photovoltaic device [1]. It is a kind of photoelectric cell, which is described as an apparatus that changes its electrical properties, including resistance, voltage, and current, in response to light. The electrical components of photovoltaic modules, commonly referred to as solar panels, are often individual solar cells. The highest open-circuit voltage of a single-junction silicon solar cell is normally between 0.5 and 0.6 volts [24]. A photovoltaic panel is one kind of semiconductor device made of semiconductor material. Typically, semi-conductive materials are solids that are either crystalline or amorphous. As temperatures go closer to absolute zero (0 Kelvin), solids act as insulators because they lack free electrons. However, at room temperature, certain insulators have a large number of unbound electrons. The bond energies between the nucleus and valence electrons of an atom are (3-5) eV. Materials classified as semiconductors have electrical conductivity that ranges from ambient temperature to absolute zero [22].
3.3 Parameters for photovoltaics
A solar cell's photovoltaic characteristics include its efficiency, power production, fill factor, open-circuit voltage, and short-circuit current.
3.3.1 Open circuit voltage (Voc)
The highest voltage that may be achieved It is known that when the solar cell's electrical circuit is open, both ends as the voltage potential (Voc). Eq. (3) can be used to express the load resistance (RL = ∞).
$V o c=K T / q \operatorname{Ln}(I L / I O+1)$ (3)
where, q is the electron charge, K is Boltzmann's constant, and T is absolute temperature [31].
3.3.2 Short circuit current (Isc)
The utmost flow that a solar cell can create when its stations are shorted to produce current while the loop tonnage is zero is known as the short circuit current, or Isc. Conversely, when the voltage at the PV cell's terminals is zero, the Isc is the current flowing through the cell [32].
$I S C=I O(eqVoc / K T-1)$ (4)
$I=I L=I S C$ (5)
3.3.3 Solar cell efficiency (ƞ)
The efficiency of a solar cell is the ratio of the solar cell's electrical output power at the maximum power point of the current voltages to its input power [33].
The PV-cell power conversion Efficiency, ƞ, can be
$\eta=\frac{V_{\max } I_{\max }}{P_{i n}}=\frac{P_{\max }}{P_{i n}}=\frac{V_{o c} I_{s c} F F}{P_{i n}}$ (6)
The most often used metric for evaluating the performance of solar cells is their efficiency. Consequently, the equation provides the improvement ratio of the solar cell efficiency [27].
$\Delta \eta=\frac{(\Delta \%)_{L S C}-(\Delta \%)_{\text {bare }}}{(\mathrm{n} \%)_{\text {bare}}} \times 100 \%$ (7)
where, (ƞ%) LSC, when a luminous solar concentrator is mounted on the solar cell, the conversion efficiency is (ƞ%)bare [27].
3.4 External Quantum Efficiency (EQE) and Internal Quantum Efficiency (IQE)
EQE measures the percentage of incident photons converted to electrons, while IQE accounts only for photons that are absorbed, excluding those lost to reflection or transmission [34].
3.5 Thermal effects on solar cell performance
Temperature significantly affects PV parameters. As the temperature increases: Voc decreases due to higher recombination rates. Isc slightly increases. Overall efficiency tends to decrease.
This underscores the importance of thermal management in real-world photovoltaic installations [35].
3.6 Geometric and optical design in LSCs
The geometry of LSCs (e.g., flat plates vs. cylindrical forms) plays a critical role in optical performance. A well-designed geometry maximizes internal reflection and minimizes escape cone losses. Internal reflection and minimizes escape cone losses. Incorporating reflective coatings or photonic structures can further enhance light trapping, leading to improved photon absorption and ultimately higher power conversion efficiency of the solar cell [36].
4.1 Scanning Electron Microscope (SEM)
In Figure 1, because of their special physical and chemical characteristics, zinc oxide (ZnO) nanoparticles hold great promise as materials for industrial and medicinal applications. In order to investigate the variations in size, shape, and surface texture between zinc oxide nanoparticles (ZnO NPs) and microparticles (ZnO SMPs), this study will evaluate scanning electron microscopy (SEM) images of the two types. In contrast to microparticles that displayed uneven forms and rough surface textures, the results demonstrated that the nanoparticles had normal spherical structures and micron diameters. This study emphasizes how crucial morphological analysis is in identifying the proper uses for each kind of these particles.

Figure 1. Scanning Electron Microscopy (SEM) images of zinc oxide nanoparticles (ZnO NPs)

Figure 2. SEM image of ZnO nanoparticles dispersed in epoxy resin
In order to investigate the size, shape, and surface characteristics of the particles, scanning electron microscopy was carried out in the Iran University of Tehran labs using a high-resolution scanning electron microscope (HR-SEM) at an accelerating voltage of 5-15 kV. Images were taken at various magnifications.
ZnO NPs and ZnO SMPs differed significantly, according to SEM images: SEM scans of ZnO NPs revealed that they exhibited a homogeneous size distribution and a uniform spherical shape with a diameter ranging from 20 to 100 nm. ZnO SMPs: The micronized particles ranged in size from 500 nm to 2 μm and had an uneven appearance with sharp edges [37]. Surface area and chemical activity are strongly influenced by particle size. Because ZnO NPs are so tiny, they are more reactive due to their larger surface area, although ZnO SMPs might be more stable in a particular structural form.
The SEM image illustrates a relatively uniform distribution of ZnO nanoparticles within the epoxy resin matrix (Figure 2). The nanoparticles display minimal agglomeration, indicating effective dispersion. This suggests enhanced interfacial compatibility between ZnO and the epoxy medium, which can significantly improve the optical and photovoltaic performance of the resulting composite.
4.2 Transmission Electron Microscopy (TEM)
Figure 3 shows transmission electron microscopy (TEM) images of zinc oxide (ZnO) nanoparticles. The purpose of the TEM study was to determine the size and crystallographic properties of the nanoparticles. The TEM images of ZnO support the SEM results, which show that the particles are quasi-hexagonal in shape with slight thickness variation. According to this image, the majority of the zinc oxide nanoparticles (ZnO NPs) have a hexagonal shape, with typical particle sizes of 100 nm. The synthesized ZnO TEM diffraction rings exhibited the ordered Debye-Scherrer rings 010, 002, 011, 012, 110, and 103, respectively, according to the SAED pattern.

Figure 3. TEM images of ZnO nanoparticles
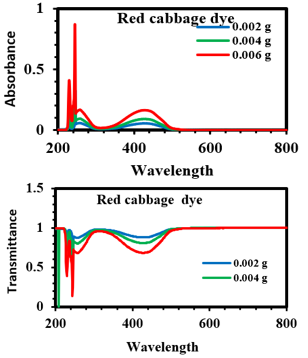
Figure 4. Absorbance spectra of red cabbage dye solutions at varying dye weights
In Figure 4, the absorbance capacity of each dye solution at specific quantities (0.002, 0.004, 0.006 g) was plotted using the UV apparatus.
The absorbance and radiation transmission curves of red cabbage dye diluted in distilled water solvent at varying weights 0.002 g, 0.004 g, and 0.006 g are displayed in Table 1 and Figure 4. As can be seen from the figure, the absorbance increases and the transmittance decreases as the dye concentration rises. The rise in the dye's concentration in the solvent is the cause of this, and this It complies with the legislation of Beer-Lambert. The absorbance curves reveal two electronic transitions: the first, caused by the transition type δ-δ*, occurs in the UV region at a wavelength of 250 nm, and the second, caused by the transition type π-π*, occurs in the visible light region at a wavelength of 426 nm.
Table 1. Optical properties of red cabbage dye at different concentrations
|
Dye |
Dye W (g) |
A |
T |
R |
α |
K |
n |
Ɛr |
Ɛimag |
|
Red cabbage |
0.002 |
0.056 |
0.879 |
0.064 |
0.128 |
4*10-7 |
1.287 |
1.657 |
1*10-6 |
|
0.004 |
0.092 |
0.808 |
0.099 |
0.212 |
7*10-7 |
1.485 |
2.147 |
2*10-6 |
|
|
0.006 |
0.165 |
0.683 |
0.151 |
0.379 |
1*10-6 |
1.775 |
3.151 |
4*10-6 |
Figure 5 and Figure 6 illustrate the results, visualizing trends in optical and photovoltaic behavior.
Figure 5. UV-Vis absorbance and transmittance spectra of red cabbage dye solutions doped with ZnO NPs, showing the effect of varying dye concentrations on optical performance
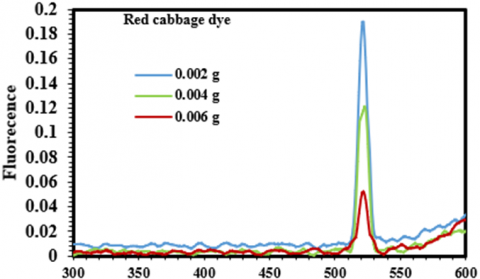
Figure 6. Fluorescence emission spectra of red cabbage dye solutions at varying concentrations
Table 2 demonstrates that the most significant optical characteristics increase when ZnO is added to a solution of red cabbage dye with varying weights.
The size of ZnO nanoparticles (10-30 nm) critically influences their optical and photovoltaic behavior. At the nanoscale, ZnO exhibits quantum confinement effects, leading to a widened bandgap and enhanced UV absorption. Smaller particle sizes provide a larger surface area for dye adsorption, improving electron transfer and reducing recombination. These attributes contribute to higher photoluminescence intensity and improved solar cell efficiency.
A fluorescent instrument was used to measure the red cabbage dye solution's fluorescence. Figure 6 makes it evident that the phenomena of self-absorption are the cause of the drop in fluorescence intensity that occurs as concentration rises. The reason for this is the high dye molecule concentration, which causes the absorption and emission spectra to overlap. Pigment molecules absorb photons and change into an excited state when they come into contact with light.
Table 2. Optical properties of red cabbage dye solution at different weight doped with ZnO NPs
|
Dye + ZnO NPs |
Dyes co. (g) |
λ (nm) |
A |
T |
R |
ɑ |
K |
n |
ƐR |
Ɛimag |
|
Red cabbage |
0.002 0.004 0.006 |
508 508 508 |
0.133 0.176 0.281 |
0.734 0.665 0.516 |
0.131 0.157 0.197 |
0.308 0.429 0.659 |
1*10-6 2*10-6 3*10-6 |
1.650 1.818 2.098 |
2.821 3.211 3.622 |
3*10 4*10 5*10 |
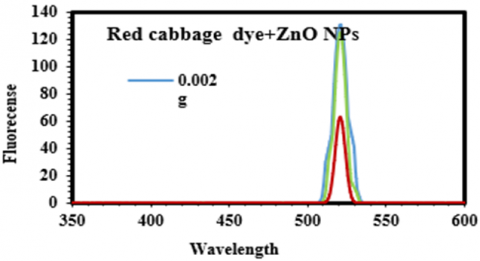
Figure 7. Fluorescence emission spectra of red cabbage dye solutions doped with ZnO nanoparticles
By improving the surface interactions between nanomaterials and dye molecules, adding ZnO NPs to the red cabbage dye solution can increase the fluorescent spectrum. This is because it increases the transfer of energy to the dye molecules, increases the absorption of light photons, transfers energy to the dye molecules so they become more excited, and decreases It minimizes energy loss by self-damping and offering several pathways for light in the solution. Figure 7 illustrates how the addition of ZnO causes the dye to glow.

Figure 8. Photovoltaic I-V characteristics of red cabbage dye sensitized solar cell
The efficiency of the solar cell for red cabbage dye weighing (W=0.004 g) dissolved in distilled water is displayed in Figure 8. When using Eq. (6), the solar cell's efficiency, which was ƞ ̞=1.080, becomes ƞΔ̞= 1.16% percent As in Table 3. Given that the efficiency of the solar cell without a solar concentrator was ƞ ̞=0.600, this indicates that the dye boosted the solar cell's efficiency.
Table 3. Photovoltaic properties of solar cells fabricated with red cabbage dye
|
Dye |
Dye Weight (g) |
Imax mA |
Vmax volt |
Isc mA |
Voc volt |
FF |
Ƞ |
Δƞ% |
|
Red cabbage |
0.002 0.004 0.006 |
34.30 34.70 31.60 |
4.892 4.850 4.703 |
36.00 37.00 34.70 |
5.654 5.652 5.631 |
0.824 0.805 0.775 |
1.076 1.080 0.970 |
1.152 1.16 0.94 |
Table 4. Photovoltaic properties of solar cells fabricated with red cabbage dye solutions doped with ZnO nanoparticles at various dye concentrations
|
Dyes + ZnO NPs |
Dye Weight (g) |
Imax (mA) |
Vmax (V) |
Isc (mA) |
Voc (V) |
FF |
Ƞ |
Δƞ% |
|
Red cabbage |
0.002 0.004 0.006 |
54.50 54.10 52.40 |
4.883 4.852 4.882 |
55.30 62.50 57.90 |
5.702 5.70 5.635 |
0.843 0.820 0.784 |
1.705 1.682 1.639 |
2.41 2.364 2.278 |

Figure 9. Photovoltaic I-V characteristics of red cabbage dye and ZnO nanoparticles sensitized solar cell
For every weight of the dye solution that was determined, ZnO nanomaterial was added at a 1:1 ratio to the red cabbage dye solution (Imax, Vmax, Isc, Voc, FF, ̞ƞ, Δ̞). The solar cell efficiency reaches its maximum at (w=0.002 g) ƞ ̞=1.705, according to Table 4. Using Eq. 6, the solar cell efficiency percentage increases to Δ̞ƞ=2.41%, as shown in Figure 9. Improved energy transfer between solution molecules and greater light absorption and scattering inside the solar cell are the causes of this rise in solar cell efficiency levels.
Figure 10 illustrates the investigation of solar cell efficiency achieved by mixing red cabbage dye with epoxy resin and ZnO nanomaterial. The computed efficiency results are presented in Table 5. The results in Table 5 show that incorporating epoxy resin into the red cabbage dye solution containing ZnO nanoparticles leads to a further enhancement in the solar cell’s performance parameters. The presence of epoxy resin improves dye adhesion and stability on the photoanode surface, which reduces dye desorption and enhances light-harvesting efficiency. Consequently, the short-circuit current (Isc), open-circuit voltage (Voc), and fill factor (FF) increase, resulting in a higher overall power conversion efficiency (ƞ).
We draw the conclusion that as concentration rises, so does the absorption of natural colors. We also determine that the dye's absorption is increased by the addition of a nanomaterial. The light concentrator is made up of a dye and a nanomaterial. The dye improves the efficiency of the solar cell by enhancing light absorption, preventing scattering, and uniformizing its orientation [38].

Figure 10. Solar cell I-V characteristics with red cabbage dye, ZnO nanoparticles, and epoxy resin
Table 5. Photovoltaic properties of solar cells fabricated with red cabbage dye solutions doped with ZnO nanoparticles and epoxy resin at various dye concentrations
|
Dye |
Weight Dye (g) |
Ƞdye+ZnO NPs |
|
Red cabbage |
0.002 0.004 0.006 |
0.948 0.941 0.930 |
This study examined the optical properties of natural paprika dye dissolved in distilled water, by analyzing the absorption spectra and refractive index over the spectral range from 180 to 800 nm. The results showed that paprika dye exhibits strong absorption in the ultraviolet and visible light regions, with a primary absorption peak observed at short wavelengths, followed by a gradual decrease in absorption intensity toward the infrared region. The absorption relationship with dye concentration was shown to follow the Beer-Lambert law, demonstrating linear optical behavior and a regularity in light absorption with increasing concentration.
Regarding the refractive index, measurements revealed a decreasing behavior with increasing wavelength, a typical behavior of most organic dye-based materials. This behavior is reflected in the refractive properties of paprika dye, enhancing its potential for use in applications requiring precise light control, such as the fabrication of DSSCs and other photonic devices.
These results indicate that natural paprika dye, thanks to its easy accessibility, low cost, and environmentally safe properties, is a promising option for advanced optical and photonic applications. Its excellent linear optical properties also open the way for its integration into practical optical systems that require efficient and stable materials.
The study recommends further research to develop the dye by improving its chemical and thermal stability, as well as studying its performance in different operating environments, which would enhance its potential for use in renewable energy applications and advanced optical devices.
This work was supported by the College of Education for Pure Sciences, University of Babylon, Iraq. The authors would also like to express their sincere gratitude to Dr. Baha’a for his valuable guidance and continuous support throughout this research.
|
B |
dimensionless heat source length |
|
CP |
specific heat, J·kg⁻¹·K⁻¹ |
|
g |
gravitational acceleration, m·s⁻² |
|
k |
thermal conductivity, W·m⁻¹·K⁻¹ |
|
Nu |
local Nusselt number along the heat source |
|
Greek symbols |
|
|
$\alpha$ |
thermal diffusivity, m²·s⁻¹ |
|
$\beta$ |
thermal expansion coefficient, K-1 |
|
$\phi$ |
solid volume fraction |
|
Ɵ |
dimensionless temperature |
|
µ |
dynamic viscosity, kg·m⁻¹·s⁻¹ |
|
Subscripts |
|
|
p |
nanoparticle |
|
f |
fluid (pure water) |
|
nf |
nanofluid |
[1] Armaroli, N., Balzani, V. (2007). The future of energy supply: Challenges and opportunities. Angewandte Chemie International Edition, 46(1-2): 52-66. https://doi.org/10.1002/anie.200602373
[2] Duran, K., Monti, A. (2025). A data-driven framework for predicting solar rooftop adoption in Germany based on open-source data. Energy Informatics, 8(1): 100. https://doi.org/10.1186/s42162-025-00562-0
[3] Dhabab, J. (2013). Modern methods and techniques in automated chemical analysis. Al-Mustansiriya University, College of Science.
[4] Dhonde, M., Bhojane, P., Sahu, K., Murty, V.V.S. (2023). Dye-sensitized photoelectrochemical cells in water splitting. In Solar- Driven Green Hydrogen Generation and Storage, pp. 157-191. https://doi.org/10.1016/B978-0-323-99580-1.00005-4
[5] Fonash, S.J. (2012). Solar Cell Device Physics. Elsevier.
[6] Hashem, A.H., El-Naggar, M.E., Abdelaziz, A.M., Abdelbary, S., et al. (2023). Bio-based antimicrobial food packaging films based on hydroxypropyl starch/polyvinyl alcohol loaded with the biosynthesized zinc oxide nanoparticles. International Journal of Biological Macromolecules, 249: 126011. https://doi.org/10.1016/j.ijbiomac.2023.126011
[7] Jablonski, A. (1933). Efficiency of anti-stokes fluorescence in dyes. Nature, 131(3319): 839-840. https://doi.org/10.1038/131839b0
[8] Li, R., Wang, S., Chuwongin, S., Zhou, W. (2013). Nanoscale silver-assisted wet etching of crystalline silicon for anti-reflection surface textures. Journal of Nanoscience and Nanotechnology, 13(1): 493-497. https://doi.org/https://doi.org/10.1166/jnn.2013.6916
[9] Lin, X.X., Zeng, Y., Zhong, S.H., Huang, Z.G., et al. (2015). Realization of improved efficiency on nanostructured multicrystalline silicon solar cells for mass production. Nanotechnology, 26(12): 125401. https://doi.org/10.1088/0957-4484/26/12/125401
[10] Mahajan, U., Prajapat, K., Dhonde, M., Sahu, K., et al. (2024). Natural dyes for dye-sensitized solar cells (DSSCs): An overview of extraction, characterization and performance. Nano-Structures Nano-Objects, 37: 101111.
[11] Mohamed, A.M., Hassan, A.F. (2015). Improve solar cell energy conversion efficiency by using illuminescent dyes concentrators. Journal of Kufa-Physics, 7(2): 8-15.
[12] Cox, A.W. (1988). Solar and geothermal energy. In Information Sources in Energy Technology, Butterworth-Heinemann, pp. 263-289.
[13] Pallares-Rusiñol, A., Bernuz, M., Moura, S.L., Fernández-Senac, C., et al. (2023). Advances in exosome analysis. Advances in Clinical Chemistry, 112: 69-117. https://doi.org/10.1016/bs.acc.2022.09.002
[14] Upstone, S.L. (2000). Ultraviolet/visible light absorption spectrophotometry in clinical chemistry. Encyclopedia of Analytical Chemistry, pp. 1699-1714.
[15] Meulenkamp, E.A. (1998). Synthesis and growth of ZnO nanoparticles. The Journal of Physical Chemistry B, 102(29): 5566-5572.
[16] Reisfeld, R. (1983). Future technological applications of rare-earth-doped materials. Journal of the Less Common Metals, 93(2): 243-251. https://doi.org/10.1016/0022-5088(83)90163-7
[17] Rowan, B.C., Wilson, L.R., Richards, B.S. (2008). Advanced material concepts for luminescent solar concentrators. IEEE Journal of Selected Topics in Quantum Electronics, 14(5): 1312-1322. https://doi.org/10.1109/JSTQE.2008.920282
[18] Singh, L.K., Koiry, B.P. (2018). Natural dyes and their effect on efficiency of TiO2 based DSSCs: A comparative study. Materials Today: Proceedings, 5(1): 2112-2122. https://doi.org/10.1016/j.matpr.2017.09.208
[19] Hegedus, S. (2006). Thin film solar modules: The low cost, high throughput and versatile alternative to Si wafers. Progress in Photovoltaics: Research and Applications,14(5): 393-411.
[20] Sols, K. (2010). Simulation of solar cell losses depending on cell design. https://hdl.handle.net/20.500.12380/131067.
[21] Salman, H.E. (2019). Adsorption study of the interaction between Zinc oxide nanoparticles with albumin and creatinine. Doctoral dissertation. University of Kerbala.
[22] Atkins, P.W. (2017). Computational studies of halide and hybrid perovskite materials for solar cells. Doctoral dissertation, University of Bath.
[23] Truant, J.P., Brett, W.A., Thomas Jr, W. (1962). Fluorescence microscopy of tubercle bacilli stained with auramine and rhodamine. Henry Ford Hospital Medical Journal, 10(2): 287-296.
[24] Sark, W.G.V., Barnham, K.W., Slooff, L.H., Chatten, A.J., et al. (2008). Luminescent solar concentrators-A review of recent results. Optics Express, 16(26): 21773-21792. https://doi.org/10.1364/OE.16.021773
[25] Weinstein, L.A. (1988). Electromagnetic waves. Radio i svyaz’, Moscow.
[26] Rachid, R. (2022). Epifluorescence microscopy. In Principles of Light Microscopy: From Basic to Advanced, pp. 57-75. https://doi.org/https://doi.org/10.1007/978-3-031-04477-9_3
[27] Hadi, N.M., Hassan, A.F., Abaas, T.M. (2024). Nanomaterial mixed with dyes to make solar cell concentrator. Acta Innovations, 51: 29-35.
[28] Debije, M.G., Verbunt, P. P.C. (2012). Progress in LSC technologies. Solar Energy, 86(7): 2157-2175.
[29] Currie, M.J., Mapel, J.K., Heidel, T.D., Bawendi, M.G. (2008). Photonic down-shifting in LSCs. Science, 321(5886): 226-228. https://doi.org/10.1126/science.1158342
[30] Meinardi, F., Colombo, A., Velizhanin, K.A., Simonutti, R., et al. (2014). Large-area luminescent solar concentrators based on ‘Stokes-shift-engineered’nanocrystals in a mass-polymerized PMMA matrix. Nature Photonics, 8(5): 392-399. https://doi.org/https://doi.org/10.1038/nphoton.2014.54
[31] Banal, J.L., Ghiggino, K. P., Smith, T.A. (2016). Quantum yield enhancement. ACS Photonics, 3(5): 803-812.
[32] Kalyani, N.T., Dhoble, S.J. (2012). Organic light emitting diodes: Energy saving lighting technology—A review. Renewable and Sustainable Energy Reviews, 16(5): 2696-2723. https://doi.org/https://doi.org/10.1016/j.rser.2012.02.021
[33] Batchelder, J.S., Zewail, A.H., Cole, T. (1979). Waveguiding in LSCs. Applied Optics, 18(18): 3090-3100.
[34] Wahab, R., Ansari, S.G., Kim, Y.S., Seo, H.K., et al. (2007). Low temperature solution synthesis and characterization of ZnO nano-flowers. Materials Research Bulletin, 42(9): 1640-1648. https://doi.org/10.1016/j.materresbull.2006.11.035
[35] Chen, X., Mao, S.S. (2007). Titanium dioxide nanomaterials: Synthesis, properties, modifications, and applications. Chemical Reviews, 107(7): 2891-2959.
[36] Brendel, R. (2011). Thin-Film Crystalline Silicon Solar Cells: Physics and Technology. John Wiley Sons.
[37] Skoplaki, E., Palyvos, J.A. (2009). On the temperature dependence of photovoltaic module electrical performance: A review of efficiency/power correlations. Solar Energy, 83(5): 614-624.
[38] Reinders, A., Verlinden, P.J., Van Sark, W., Freundlich, A. (2017). Photovoltaic Solar Energy: From Fundamentals to Applications, Volume 1. John Wiley Sons.