Mahesh Balu![]() | Palanivel Rajan Selva Kumaran*
| Palanivel Rajan Selva Kumaran*![]()
© 2025 The authors. This article is published by IIETA and is licensed under the CC BY 4.0 license (http://creativecommons.org/licenses/by/4.0/).
OPEN ACCESS
Coronary artery disease (CAD) has led to huge worldwide mortalities in recent decades. To overcome these issues, early detection and accurate assessment are necessary to attain an effective prevention of CAD. In the proposed system, a novel CAD risk decision-making system is designed by integrating both data mining and image processing techniques for mining and image data. This proposed system used advanced Deep Learning methods to train and validate both clinical data and cardiac imaging for CAD risk assessment. In the data mining process, the proposed system applied a hybrid feature selection with an Elman neural network to calculate the severity score. For image data, a modified Feature Pyramid Network is proposed that has a Triplet attention mechanism that is used to segment a fat region in a patient's Computer Tomography (CT) image accurately. For classification, the SVM model is used to calculate a severity score. At last, a fusion model is combined with both image and data mining scores to recommend the severity level of CAD accurately. The experimental result shows that the proposed system has achieved a higher accuracy of CAD risk assessment that outperforms all the traditional methods. This enhancement provided clinically valuable visions for better decision-making and patient care.
coronary artery disease (CAD), image processing techniques, Computer Tomography (CT), triplet attention mechanism
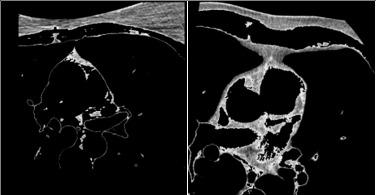
The term ‘Epicardial fat (ECF)’ is defined as the fat deposits on the heart muscles and their surroundings by a thin pericardium membrane [1]. It is essential to differentiate ECF from paracardial fat that is positioned outside the pericardium. This fat is often connected with other fat deposits in the area of the mediastinum [2], as shown in Figure 1. The ECF is known to release pro-inflammatory substances and contribute to atherosclerosis growth in the coronary arteries. The ECF volume holds clinical significance because of its association with major adverse cardiovascular events. Thus, an accurate ECF volume evaluation plays a major role in diagnosing cardiac conditions.
Figure 1. Heart fat CT images
Research studies have established a strong association between the amount of ECF and the presence of CAD [3, 4]. The exact mechanisms associated are not fully understood, but several hypotheses have been proposed. One theory recommends that ECF secretes certain bioactive molecules and hormones known as adipokines. These adipokines can have detrimental effects on the cardiovascular system. These adipokines cause inflammation, oxidative stress, and endothelial dysfunction that can contribute to the evolution of CAD. In addition, ECF is near the coronary arteries which can have direct mechanical effects on the arterial walls. These processes potentially impair blood flow and promote the formation of atherosclerotic plaques.
The ECF detection and quantification are complex because of its structure which is not fully visible in scanned images. Additionally, fat is closely attached to the heart muscle, adding more complexity to fat segmentation. Manual segmentation of the fat region is particularly challenging for clinical professionals when assessing the data. The amount of fat deposits is associated with an increased risk of CAD, making them valuable for risk prediction [5]. Recently, the deep learning (DL) model has been used for image processing approaches to provide a promising solution for segmenting and classifying medical images [6-8]. It also supports to detection of an abnormality and the categorization of different health conditions of patients [9]. Likewise, the DL model is used in data mining techniques to extract valuable insights from large volumes of healthcare data. This model can be used for diagnosis, treatment planning, and disease prediction effectively when combined with suitable feature selection algorithms [10, 11].
Despite recent advances in computer-aided diagnosis, existing CAD severity assessment approaches still face significant limitations. The existing image processing-based studies are based on conventional U-Net or FPN architectures. These models suffer from feature loss and insufficient representation of small fat regions. Likewise, data mining approaches using traditional classifiers are limited by their inability to effectively capture the dynamic dependencies within patient clinical data. Furthermore, the majority of existing methods evaluate imaging data or clinical data in isolation. This leads to incomplete risk assessment and reduces diagnostic reliability. These gaps highlight the need for a comprehensive and multimodal system to achieve robust CAD severity prediction.
To address these challenges, the key contributions and novelty of this work are summarised as follows:
In recent years, several studies have focused on developing advanced techniques for image segmentation. Ronneberger et al. [12] proposed a network called U-Net for image segmentation. In the encoder-to-decoder path, the new attention mechanisms are added to extract all relevant features.
Likewise, Zhou et al. [13] proposed UNet++ for medical image segmentation. The developed architecture uses skip connections to improve the segmentation accuracy. Also, the skip connections are used to reduce the semantic gap between the encoder and decoder networks. Another approach was developed by Rodrigues et al. [14]. The parameters of the learning model are optimized by the Genetic Algorithm. Their method models each pericardium slice with an optimal ellipse to separate the epicardial and mediastinal fats effectively.
Militello et al. [15] presented a semi-automatic method for fat segmentation and quantification that does not need initial training or modeling. It calculates fat regions using Region of Interest (ROI) interpolation. In a similar vein, Zlokolica et al. [16] proposed a semi-supervised slice-by-slice segmentation method for epicardial fat quantification from 3D CT images. Their approach incorporates local adaptive morphology, fuzzy clustering, and a geometric ellipse prior to removing unnecessary portions of the cluster.
Turečková et al. [17] extended Convolutional Neural Networks (CNN) by incorporating deep supervision and attention gates called Deep Spatial Varying (DSV) UNET. Their experimental evaluation demonstrated consistent improvement in detection accuracy for different data sets. For the automatic segmentation of epicardial adipose tissue (EAT) from coronary computed tomography angiography (CCTA), He et al. [18] proposed a 3D deep attention U-Net method called Attention Gate (AG) UNET. Their approach was evaluated through retrospective investigations of 200 patients using different cross-fold validations.
Commandeur et al. [19] introduced a hybrid segmentation model for quantifying heart fat. The hybrid model uses multi-task CNNs called ConvNet with a statistical shape model to predict fat regions. Zhang and Zhang [20] developed a Pyramid Medical Transformer (PMTrans) for medical image segmentation. PMTrans architecture combines multi-scale attention with dilated convolution for accurate feature learning. This integration is used to capture multi-range relations and retain informative relations to increase segmentation accuracy.
Feng et al. [21] developed CPFNet, a Context Pyramid Fusion Network that has two pyramidal modules to fuse global/multi-F scale data. This method involved a global pyramid guidance element and a scale-aware pyramid fusion element to increase accuracy. Next, Zhang et al. [22] developed an improved Feature Pyramid Fusion Network based on multi-scale fusion named MS-PDN. This stacked PDN is used to extract multiple features to enhance the segmentation performance. Further, this method explored data mining methods for CAD to focus on their application and effectiveness in CAD-related dataset analysis.
Purwar and Singh [23] proposed a Hybrid Prediction Model with an integration of Missing Value Imputation (HPM-MI). Also, K-means clustering with a Multilayer Perceptron is involved for a higher accuracy. Tsipouras et al. [24] developed a fuzzy rule-based decision support system (DSS) to diagnose a CAD. This system used a decision tree to extract data and perform fuzzy-based classification.
To increase classification performance, a hybrid model is proposed by Kahramanli and Allahverdi [25]. The hybrid model includes both an artificial neural network (ANN) and a fuzzy neural network (FNN) for classification. Lin and Hsieh [26] presented a hybrid model for CAD detection that was optimized by the evolutionary algorithm of endocrine-based particle swarm optimization (EPSO) to increase the prediction accuracy. This approach effectively selects optimal feature subsets for dataset classification, contributing to improved accuracy.
Kupusinac et al. [27] proposed a solution for the primary estimation of cardiometabolic risk using an ensemble neural network learning model. The parameters of the learning model are tuned by an evolutionary algorithm. Verma et al. [28] presented a novel hybrid model for CAD diagnosis. Their approach uses a correlation-based feature selection process and PSO-based classification. In the study conducted by Muhammad et al. [29], various machine learning classification algorithms were explored. To performance of classification algorithms is analyzed for different noise removal and feature selection algorithms in terms of accuracy and sensitivity rates. Md Idris et al. [30] conducted a study aimed at identifying significant features for building models to predict the severity level of patients with CAD. The research employed three feature selection methods, namely the Chi-squared test, recursive feature elimination, and Embedded Decision Tree, to identify the most relevant features. To address the issue of imbalanced datasets, the oversampling technique was applied.
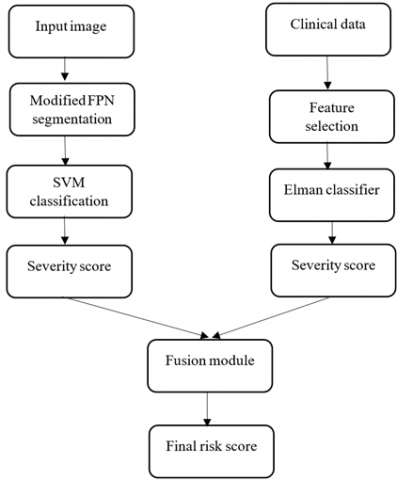
The proposed method combines both image processing and data mining approaches to predict a severity level in CAD. The proposed system is divided into two steps: modified FPN-based fat segmentation, SVM-based severity classification. Then, the Elman neural network (ENN)-based severity prediction using clinical data is shown in Figure 2.
Figure 2. Overall workflow
3.1 Modified FPN (Triplet attention-based FPN)
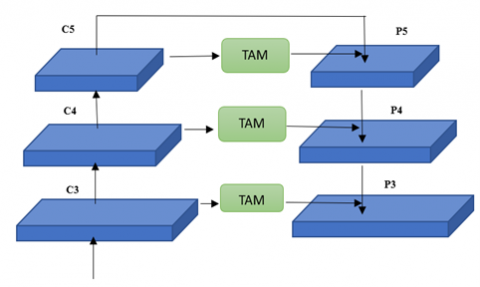
FPNs are used to improve the representation of features for detecting portions of varying dimensions by combining features. However, these networks have some drawbacks. Firstly, the fusion process in FPNs, which involves adding or concatenating features in the channel dimension, is not sufficient due to differences in semantic meaning and feature similarity. It requires different weights to effectively combine a feature from different layers. Additionally, at the top-level feature, specifically C5 in Figure 3, there is a loss of information due to its single-scale representation and fewer channels compared to the features in previous layers. For example, the channel dimension of feature p5 is reduced from 2048 to 256 to get feature C5, resulting in a loss of information. Still, another feature, such as C4, has the ability to combine the features from the backbone with upsampled features from the preceding layer. So, it is essential to address this issue by adding a module or modifying the structure of the network.
Figure 3. Modified FPN
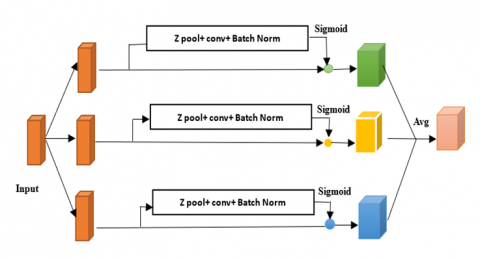
Triplet attention is a recently introduced method that computes attention weights by detecting relations between different dimensions through the triplet attention mechanism [31]. In conventional techniques, channel attention is computed by first calculating weights and then uniformly scaling the feature maps based on these weights. But, to find the channel’s weights, there is a need to spatially decompose the input tensor into one pixel using global average pooling. The triplet attention method is shown in Figure 4. The First Branch is used to compute the interactions between the channel dimension (C) and the spatial dimension (W). The second Branch captures the dependencies between the channel dimension (C) and the spatial dimension (H). The third Branch (Blue) is used for computing the spatial dependencies between the height (H) and width (W) dimensions.
Figure 4. Triplet attention mechanism
The output of the triplet attention mechanism is obtained by averaging the resultant feature maps from these branches, taking into account the captured cross-dimensional interactions.
The Triplet Attention block in the FPN enables the capture of the relation between the channel dimension and the spatial dimensions (height and width) of the input tensor, enhancing the representation of features.
Feature Pyramid Construction: It is used to construct a feature pyramid by combining features from various layers of a backbone network. Each pyramid level, like C5, C4, and C3 denotes features at various spatial scales.
Triplet Attention Module: This module is applied to each level of the feature pyramid independently to consider a single level.
a). Branches: it has several connections to learn the dependencies among various dimension pairs: (C, H), (C, W), and (H, W). It facilitates the capture of cross-dimensional interactions and dependencies within the feature maps.
b). Cross-Dimension Interactions: Within each branch, the module processes the feature map to capture interactions among the specified dimension pair. For instance, in the (C, H) branch, the module is used to focus on connections between the channel dimension and the height dimension.
c). Dimension Fusion: After processing each branch, the Triplet Attention module fuses the information from all branches. It is used to capture dependencies among the channel and spatial dimensions. This fusion can involve operations like concatenation or element-wise addition.
Feature Fusion and Upsampling: Once the Triplet Attention module is applied to each level of the feature pyramid, the feature maps are fused and upsampled, if necessary, to match the dimensions of the original input image. This fusion and upsampling ensured that the multi-scale data was preserved for segmentation.
By integrating the Triplet Attention mechanism into each layer of the FPN (e.g., C5 to P5, C4 to P4, and C3 to P3), the network effectively captures the relation between the channel and spatial dimensions, addressing the limitations of previous approaches. Additionally, the Triplet Attention module introduces minimal computational overhead, making it suitable for integration into FPN architectures.
3.1.1 SVM classification
After segmentation, the features of area, perimeter, compactness, and texture features are extracted for classification. The texture features captured statistical properties and texture patterns. In classification, SVM is used to classify the severity of fat like high, medium, and low, based on the segmented fat region. SVM is a popular classification algorithm known for its efficiency in handling both linear and non-linear classification tasks. SVM aims to discover an optimal hyperplane that splits different categories by exploiting the margin between them.
3.2 Classification of data mining
The data mining technique is used to calculate the severity score of patients based on clinical data. Initially, the significant features are selected by combining three algorithms. For severity classification, the optimized ENN is used.
3.2.1 Feature selection
The proposed method uses an ensemble approach to select the best features for accurate prediction. The feature selection process involves applying different techniques to identify the most relevant features for a given dataset. The Chi-Square Test is used to assess the relationship between categorical features and the target variable. Based on the calculated chi-square statistics or significance values, the top-K features with the highest relevance are selected [32].
After the Chi-Square test, the Recursive Feature Elimination (RFE) is applied to further refine the feature set. RFE iteratively eliminates the least important features. The process continues until the desired number of features or a stopping criterion is reached.
ReliefF is used to estimate the relevance of the remaining features. It calculates the ability of features to distinguish between samples of the same and different classes. The features are ranked based on their ReliefF scores. These ranks are used to detect the most informative ones. The rankings or scores obtained from the Chi-Square Test, RFE, and ReliefF are then combined. This can be done by assigning weights to each technique's results based on their performance or significance.
Finally, the final set of features is selected based on the combined rankings or scores. This can be done by choosing the top-N features based on the combined ranking/score or setting a threshold value. These selected features are considered for severity classification.
The pseudocode for the proposed feature selection is given below:
Step 1: Apply Chi-Square Test
chi2_scores=chi2(X, y)#Calculate chi-square scores for each feature
sorted_indices=np.argsort(chi2_scores)#Sort feature indices based on scores
top_k_features=sorted_indices[-K:]#Select top-K features
Step 2: Apply Recursive Feature Elimination (RFE)
rfe=RFE(estimator, n_features_to_select=desired_num_features)#Initialize RFE with desired number of features
selected_features=rfe.fit_transform(X[:, top_k_features], y) # Perform RFE on top-K features
Step 3: Apply ReliefF
relieff_scores=reliefF(X[:, top_k_features], y)#Calculate ReliefF scores for remaining features
sorted_indices=np.argsort(relieff_scores)#Sort feature indices based on scores
Step 4: Combine the Results
combined_scores=alpha*chi2_scores[top_k_features]+beta*sorted_indices#Combine scores using weights alpha and beta
Step 5: Select Final Features
sorted_indices=np.argsort(combined_scores)#Sort feature indices based on combined scores
final_selected_features=sorted_indices[-N:]#Select top-N features
3.2.2 ENN-based prediction
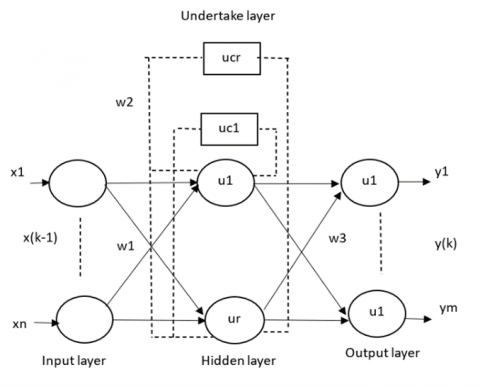
The ENN is a feedback Neural Network (NN) that extends the traditional back propagation neural network by adding an additional layer called the "undertake" layer, which serves as a delay operator for memory purposes. This allows the network to adjust to time-varying dynamic features and exhibit strong global stability. The network architecture consists of four layers: input layer (IL), hidden layer (HL), undertake layer (UL), and output layer (OL) as shown in Figure 5. The undertake layer remembers the output of the hidden layer, acting as a step delay operator and enabling sensitivity to historical data. This internal feedback mechanism enhances the ability of a network to handle dynamic information and adapt to time-varying characteristics, thereby providing a dynamic mapping function.
Given $n$ inputs, $m$ outputs, $r$ hidden neurons, $r$ undertake neurons, ($k-1$) as the input of the NN, $x(k)$ as the output of the $\mathrm{HL}, x c(k)$ as the output of the UL, and $y(k)$ as the output of the NN, the relationship can be expressed as follows:
$x(k)=f\left(w_2 x_c(k)+w_1(u(k-1))\right)$ (1)
where,
$x_c(k)=x(k-1)$ (2)
Figure 5. Structure of Elman network
w1, w2 and w3 are the weights of the layers from the input to the hidden layer, from the undertake to the hidden layer and from the hidden to the output layer. The hidden layer function f is
$f(x)=\left(1+e^{-x}\right)^{-1}$ (3)
$y(k)=g\left(w_3 x(k)\right)$ (4)
where, $g$ is the transfer function of the output layer
$E=\sum_{K=1}^m\left(t_k-y_k\right)^2$ (5)
The network uses backpropagation to update the weight.
The classification performance of a network purely depends on the parameters of the Number of hidden units, Learning rate, Momentum, Activation function, Initialization of weights, and Epochs. Here, the parameters are tuned using particle swarm optimization to achieve a better accuracy level.
3.3 Fusion module
The fusion process combines the severity assessments from both image-based and data mining-based classifications. Each modality (image and clinical data) is assigned a weighting coefficient, denoted as λm, which can be customized based on the importance of each modality in the overall assessment. The final severity score for each patient in a particular severity class is computed using the weighted summation of the probabilities or labels obtained from the two classifications:
Severity $_{\text {score }(s, c)}=\Sigma\left(\lambda_m{ }^* \mathrm{p}_{m c}(s)\right)$, for $\mathrm{m}=1$ to M (6)
where, Severityscore(s, c) represents the final severity score for samples in severity class c. pmc (s) denotes the probability or label for samples in severity class c obtained from the image and data mining classifications. By appropriately assigning weighting coefficients to each modality, the fusion module ensures a robust and comprehensive severity classification, enhancing the accuracy of patient assessments.
The experimental datasets used in this study are obtained from the link (http://visual.ic.uff.br/en/cardio/ctfat/index.php). It consists of features collected from 340 patients. Due to the non-availability of images and clinical data from a single source, the clinical data is generated synthetically using probabilistic models and statistical imputation. The data set includes the attributes of Age, Sex, Chest Pain Type, Blood Pressure, Cholesterol rate etc. For training the networks, the RMSprop optimizer and mean squared error loss were used. All experiments were conducted using Python. For the modified FPN, a learning rate of 0.0001, batch size of 8, three pyramid levels (C3-C5), and triplet attention kernel size of 7 are used. For the ENN, the number of hidden neurons is set to 32, the learning rate to 0.01, and the momentum to 0.9 with activation functions selected as sigmoid for the hidden layer and linear for the output layer.
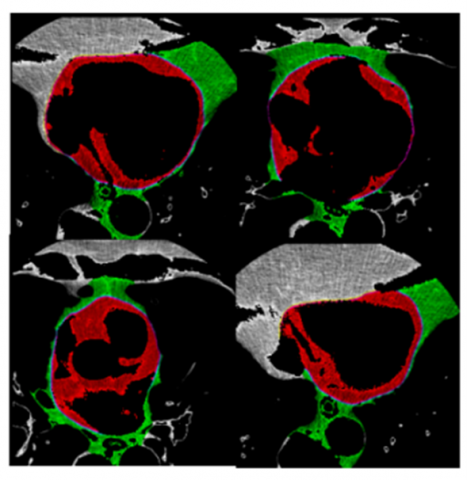
The performance of the modified FPN-based model is compared with existing models in terms of the Dice similarity coefficient (DSC), Jaccard similarity coefficient (JSC), and Hausdorff distance (HD). The validity and repeatability of the proposed method were evaluated through 10-fold cross-validation experiments on an input dataset. Each fold involved splitting the dataset into seventy percent for training and thirty percent for validation. The model output is shown in Figure 6(a). The red color denotes the epicardial fat segmentation and the green color denotes the mediastinal fat segmentation outputs. It is observed that the Modified FPN model successfully identifies and differentiates between the epicardial and pericardial fat depots.
(a)
(b)
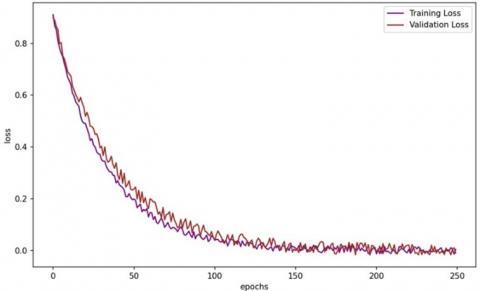
Figure 6. (a) Segmentation results; (b) loss analysis
Table 1. Performance analysis of the proposed modified FPN model
|
Method |
DSC |
JSC |
HD |
|
AG-UNET |
0.68 |
0.54 |
5.2 |
|
DSV-UNET |
0.73 |
0.61 |
4.8 |
|
U-NET ++ |
0.61 |
0.46 |
6.5 |
|
CPFNet |
0.80 |
0.69 |
3.2 |
|
MS-PDN |
0.85 |
0.76 |
2.8 |
|
U-NET |
0.52 |
0.37 |
7.1 |
|
TransUNet |
0.88 |
0.81 |
2.1 |
|
Swin-UNet |
0.89 |
0.83 |
1.9 |
|
Proposed |
0.92 |
0.86 |
1.5 |
The proposed segmentation model learning curve is given in Figure 6(b). It is observed that steady decrease in both training and validation loss. The final loss values are near zero which denotes good segmentation performance. In addition, both curves remain close throughout training with minor variations in validation loss. This represents minimal overfitting and suggests that the model generalizes well to unseen data.
Table 1 compares the DSC, JSC and HD of different methods. Among the methods, the Proposed method stands out as the best model. It achieves an impressive DSC of 0.92, indicating a high level of intersection between the predicted and ground truth segmentation masks. Additionally, it demonstrates a substantial JSC of 0.86, indicating strong set similarity between the predicted and ground truth masks. Moreover, it boasts the lowest HD value of 1.5, suggesting excellent alignment with the ground truth boundaries.
The extracted features from segmentation models are combined with different classifier models like Decision Tree (DT), Adaboost and XGboost models for severity classification. The accuracy is calculated for different classifier combinations. For every segmentation technique, the model with maximum accuracy is given in Table 2. Among the techniques evaluated, the proposed FPN combined with SVM achieved the highest accuracy of 0.93. This shows that the proposed method performed well in accurately classifying severity compared to the other methods. It confirmed a strong ability to correctly identify both TPs and TNs and keep FPs and FNs to a minimum.
To evaluate the effectiveness of the Triplet Attention mechanism integrated within the improved FPN, an ablation study is conducted by training the model both with and without TA under identical settings.
From Table 3, it is observed that the addition of the Triplet Attention mechanism significantly enhances the model’s performance.
Table 2. Performance analysis of the proposed modified FPN+SVM classifier model
|
Method |
Accuracy |
Precision |
Recall |
F1-Score |
|
AG-UNET+Adaboost |
0.75 |
0.78 |
0.70 |
0.74 |
|
DSV-UNET+DT |
0.80 |
0.84 |
0.80 |
0.82 |
|
U-NET+++SVM |
0.70 |
0.71 |
0.60 |
0.65 |
|
CPFNet+DT |
0.85 |
0.90 |
0.90 |
0.90 |
|
MS-PDN+ XGboost |
0.90 |
0.92 |
0.95 |
0.94 |
|
U-NET+ XGboost |
0.65 |
0.65 |
0.55 |
0.60 |
|
FPN+SVM |
0.94 |
0.96 |
0.98 |
0.97 |
Table 3. Quantification of triplet attention mechanism contribution
|
Configuration |
Accuracy (%) |
Sensitivity (%) |
Specificity (%) |
F1-Score |
AUC |
|
Baseline FPN (without TA) |
92.4 |
90.2 |
91.2 |
0.91 |
0.936 |
|
Improved FPN + Triplet Attention |
94.1 |
92.6 |
94.2 |
0.96 |
0.962 |
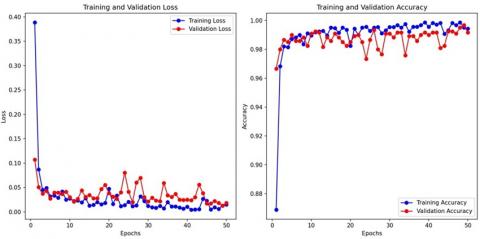
Figure 7. Proposed ENN model loss and accuracy curve
Table 4. Classification performance of the ENN classifier model for clinical data
|
Method |
Accuracy |
Precision |
Recall |
F1 Score |
|
Naïve bayes |
78.9 |
82 |
76 |
79 |
|
NN |
83.4 |
78 |
83 |
.80 |
|
Functional trees |
72 |
75 |
72 |
73 |
|
SVM |
87.5 |
88 |
84 |
86 |
|
CNN |
92.4 |
92 |
89 |
91 |
|
Logistic regression |
70 |
70 |
63 |
66 |
|
Proposed |
98.5 |
97 |
95 |
96 |
The training and loss curve of the ENN model is given in Figure 7. The proposed model effectively learns the training data and achieves very low loss and high accuracy. The measured values of the proposed classifier model are given in Table 4. Among the methods listed, the proposed ENN-based model achieved the highest accuracy of 98.5%, indicating its strong ability to correctly classify samples. It also demonstrated a high precision of 97%, suggesting a low rate of FPs. The recall value of 95% specifies a good ability to identify TP’s, while the F1 score of 96% denotes a well-adjusted performance between precision and recall.
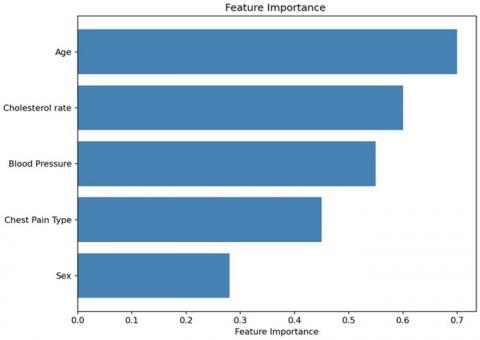
Figure 8. Feature importance plot
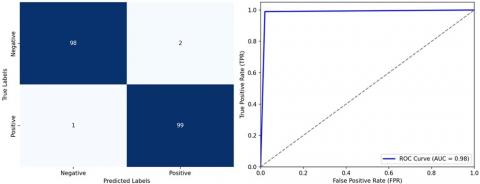
Figure 9. Visualisation of the confusion matrix and ROC plot of different models
The CNN method also performed well with an accuracy of 92.4%. It achieved a high precision of 92%, indicating a low rate of FPs. The recall value of 89% suggests a good ability to identify true positives, resulting in an F1 score of 91%. SVM showed a high accuracy of 87.5% and a precision value of 88%, indicating a relatively low rate of FPs. The recall value of 84% suggests a good ability to identify TP’s, resulting in an F1 score of 86%. The NN method achieved an accuracy of 83.4%, with a precision value of 78%, demonstrating a moderate rate of FPs. The recall value of 83% suggests a good ability to identify true positives, resulting in an F1 score of 80%. Lastly, Functional trees and logistic regression show a relatively lower performance compared to the other methods.
The visualization of the feature importance plot for the ENN classifier is shown in Figure 8. It highlights that Age and Cholesterol rate are the most influential factors and Sex has the least impact. The visualisation of the confusion matrix and the ROC plot of the proposed ENN models is shown in Figure 9. The confusion matrix for the proposed method reveals remarkable diagnostic accuracy. It correctly identifies 98 cases of the medical condition (True Positives) and accurately recognises 99 instances without the condition (True Negatives). With only 2 False Positives, it exhibits high precision, avoiding unnecessary alarms. Additionally, the method minimizes missed diagnoses, with just 1 False Negatives, highlighting its excellent sensitivity. In summary, the proposed method excels in both precision and sensitivity, making it a highly promising approach for medical image classification and disease diagnosis.
4.1 Severity calculation
The fusion process combines the severity assessments from both image-based and data mining-based classifications. Each modality is assigned a weighting coefficient, denoted as λm, which can be customized based on the importance of each modality in the overall assessment. These thresholds categorize the classifier's response into different severity levels. A Low Label occurs only when the response value is below 0.3, a response value between 0.3 and 0.7 is "Medium," and a response above 0.7 is "High. All these labels are based on classification results and the predefined thresholds; the ECF region is labeled with its corresponding severity level (Low, Medium, or High). Similarly, data mining-based classification results are also included in a probability score or a class label for each patient's clinical data. Table 5 shows an estimated sample severity score for the patients.
Table 5. Severity scores calculation
|
Patient id |
Image-Based Score |
Data Mining-Based Score |
Weighted Sum (Final Severity Score) |
Final Severity Level |
|
1 |
High |
Medium |
(0.7*0.6)+(0.3*0.4)=0.58 |
Medium |
|
2 |
Medium |
Low |
(0.6*0.2)+(0.4*0.1)=0.32 |
Low |
|
3 |
Low |
High |
(0.6*0.8)+(0.4*0.7)=0.74 |
High |
|
4 |
High |
High |
(0.6*0.8)+(0.4*0.7)=0.77 |
High |
|
5 |
Medium |
Medium |
(0.6*0.6)+(0.4*0.4)=0.52 |
Medium |
Table 6. Evaluation of the proposed model under different conditions
|
Condition |
Accuracy (%) |
F1-Score |
AUC |
Dice |
IoU |
|
Clean Data |
94.8 |
0.97 |
0.97 |
0.91 |
0.88 |
|
Gaussian Noise (σ=0.01) |
93.2 |
0.93 |
0.95 |
0.89 |
0.85 |
|
Gaussian Noise (σ=0.05) |
90.6 |
0.91 |
0.93 |
0.86 |
0.82 |
|
Gaussian Noise (σ=0.1) |
87.4 |
0.88 |
0.90 |
0.82 |
0.78 |
|
Resolution 75% |
92.7 |
0.93 |
0.95 |
0.88 |
0.84 |
|
Resolution 50% |
89.1 |
0.90 |
0.91 |
0.83 |
0.80 |
|
Real-Only Test Subset |
93.8 |
0.94 |
0.96 |
0.90 |
0.87 |
To assess the practicality of the proposed model in real-world scenarios, experiments are conducted by introducing variations in data quality. The data quality is varied using noise injection, resolution degradation, and data distribution shift. In noise injection, Gaussian noise with different variances is added to simulate acquisition artefacts. In resolution degradation, the images are downsampled to 75% and 50% of the original resolution and then upsampled back. Similarly, in data distribution shift, a subset of synthetic data is withheld, and testing is performed only on real patient-like samples to evaluate adaptability. The obtained values are given in Table 6.
It is observed that the proposed model maintains stable performance across varying noise levels and reduced image quality with only a minimum decline in accuracy and segmentation metrics. Even under heavy noise (σ=0.1) and 50% resolution, the model achieved an accuracy of 87.4% and a Dice coefficient of 0.82.
The computational analysis of the proposed model is carried out based on inference time, FLOPs (Floating Point Operations), model size and memory usage. The Inference Time is measured as the average time to process a single input image on both the GPU and CPU environments. The FLOPs indicate the total number of operations required by the model. The obtained values are given in Table 7.
Table 7. Practical evaluation metrics
|
Model Variant |
Inference Time (ms) |
FLOPs (G) |
Model Size (MB) |
Memory Usage (GB) |
|
Baseline FPN |
92.3 |
46.8 |
124.6 |
3.2 |
|
FPN+Triplet Attention |
101.7 |
51.4 |
128.1 |
3.5 |
|
Proposed Model (Full) |
109.6 |
54.2 |
131.9 |
3.7 |
The proposed model slightly increases inference time and computational load due to the triplet attention and improved feature fusion mechanisms. However, the model demonstrates improved DSC and IoU along with deployability on modern GPUs and optimized CPUs, which ensures robust and practical clinical use.
A limitation of this study is the use of synthetically generated data derived from probabilistic models and statistical imputation. Additionally, synthetic data is used to increase the sample size and address data imbalance. This data may not entirely represent the complex pathological variations observed in real patients, which may influence the generalizability of the model in actual clinical scenarios. In future work, the incorporation of larger and more diverse real patient datasets from multiple institutions will be essential to validate the proposed system and enhance its translational applicability in real-world CAD severity assessment.
In this work, the novel work of both data mining and image processing technique scores is trained and validated using the DL model for CAD risk assessment. This proposed work is used to analyse the complete evaluation of CAD severity. The data mining used a hybrid feature selection method and an ENN classifier to predict accurate risk scores. The image processing-based classification used an improved FPN to segment ECF followed by an SVM classifier. The experimental result showed that the work has the potential to assist clinicians in early detection and accurate risk assessment of CAD. The proposed work has a peculiar way of DL model assessment in both data mining and image processing that can aid efficient treatment planning and decision-making. A key limitation of this work is the reliance on synthetic clinical data rather than real-time patient data from a single source. In future work, we plan to extend the system using real patient data to improve clinical applicability. The key challenges involve data privacy, secure anonymization, and accurate annotation of epicardial fat regions. These challenges are addressed through federated learning, semi-automated annotation tools with expert validation, and multi-institutional datasets to enhance model robustness and generalizability.
[1] Hajar, R (2017) Risk factors for coronary artery disease: Historical perspectives. Heart Views, 18(3): 109-114. https://doi.org/10.4103/HEARTVIEWS.HEARTVIEWS_106_17
[2] Rosito, G.A., Massaro, J.M., Hoffmann, U., Ruberg, F.L., Mahabadi, A.A., Vasan, R.S., O’Donnell, C.J., Fox, C.S. (2008). Pericardial fat, visceral abdominal fat, cardiovascular disease risk factors, and vascular calcification in a community-based sample: The framingham heart study. Circulation, 117(5): 605-613. https://doi.org/10.1161/CIRCULATIONAHA.107.743062
[3] Rashid, N.A., Nawi, A.M., Khadijah, S. (2019). Exploratory analysis of traditional risk factors of ischemic heart disease (IHD) among predominantly Malay Malaysian women. BMC Public Health, 19(Suppl 4): 545. https://doi.org/10.1186/s12889-019-6855-5
[4] Narain, R., Saxena, S., Goyal, A.K. (2016). Cardiovascular risk prediction: A comparative study of Framingham and quantum neural network based approach. Patient Preference and Adherence, 2016: 1259-1270. https://doi.org/10.2147/PPA.S108203
[5] Kim, M., Yun, J., Cho, Y., Shin, K., Jang, R., Bae, H.J., Kim, N. (2019). Deep learning in medical imaging. Neurospine, 16(4): 657-668. https://doi.org/10.14245/ns.1938396.198
[6] Hesamian, M.H., Jia, W., He, X., Kennedy, P. (2019). Deep learning techniques for medical image segmentation: Achievements and challenges. Journal of Digital Imaging, 32(4): 582-596. https://doi.org/10.1007/s10278-019-00227-x
[7] Renard, F., Guedria, S., Palma, N.D., Vuillerme, N. (2020). Variability and reproducibility in deep learning for medical image segmentation. Scientific Reports, 10(1): 13724. https://doi.org/10.1038/s41598-020-69920-0
[8] Zhou, X. (2020). Automatic segmentation of multiple organs on 3D CT images by using deep learning approaches. Deep Learning in Medical Image Analysis: Challenges and Applications, 1213: 135-147. https://doi.org/10.1007/978-3-030-33128-3_9
[9] Singh, S.P., Wang, L., Gupta, S., Goli, H., Padmanabhan, P., Gulyás, B. (2020). 3D deep learning on medical images: A review. Sensors, 20(18): 5097. https://doi.org/10.3390/s20185097
[10] Arabasadi, Z., Alizadehsani, R., Roshanzamir, M., Moosaei, H., Yarifard, A.A. (2017). Computer aided decision making for heart disease detection using hybrid neural network-genetic algorithm. Computer Methods and Programs in Biomedicine, 141: 19-26. https://doi.org/10.1016/j.cmpb.2017.01.004
[11] Samuel, O.W., Asogbon, G.M., Sangaiah, A.K., Fang, P., Li, G. (2017). An integrated decision support system based on ANN and fuzzy_AHP for heart failure risk prediction. Expert Systems with Applications, 68: 163-172. https://doi.org/10.1016/j.eswa.2016.10.020
[12] Ronneberger, O., Fischer, P., Brox, T. (2015). U-net: Convolutional networks for biomedical image segmentation. Lecture Notes in Computer Science, 9351: 234-241. https://doi.org/10.1007/978-3-319-24574-4_28
[13] Zhou, Z., Rahman Siddiquee, M.M., Tajbakhsh, N., Liang, J. (2018). Unet++: A nested U-net architecture for medical image segmentation. Lecture Notes in Computer Science, 11045: 3-11. https://doi.org/10.1007/978-3-030-00889-5_1
[14] Rodrigues, É.O., Rodrigues, L.O., Oliveira, L.S.N., Conci, A., Liatsis, P. (2017). Automated recognition of the pericardium contour on processed CT images using genetic algorithms. Computers in Biology and Medicine, 87: 38-45. https://doi.org/10.1016/j.compbiomed.2017.05.013
[15] Militello, C., Rundo, L., Toia, P., Conti, V., Russo, G., Filorizzo, C., Maffei, E., Cademartiri, F., Grutta, L.L., Midiri, M., Vitabile, S. (2019). A semi-automatic approach for epicardial adipose tissue segmentation and quantification on cardiac CT scans. Computers in Biology and Medicine, 114: 103424. https://doi.org/10.1016/j.compbiomed.2019.103424
[16] Zlokolica, V., Krstanović, L., Velicki, L., Popović, B., Janev, M., Obradović, R., Ralević, N.M., Jovanov, L., Babin, D. (2017). Semiautomatic epicardial fat segmentation based on fuzzy c-means clustering and geometric ellipse fitting. Journal of Healthcare Engineering, 2017(1): 5817970. https://doi.org/10.1155/2017/5817970
[17] Turečková, A., Tureček, T., Komínková Oplatková, Z., Rodríguez-Sánchez, A. (2020). Improving CT image tumor segmentation through deep supervision and attentional gates. Frontiers in Robotics and AI, 7(106): 446. https://doi.org/10.3389/frobt.2020.00106
[18] He, X., Guo, B.J., Lei, Y., Wang, T., Fu, Y., Curran, W.J., Zhang, L.J., Liu, T., Yang, X. (2020). Automatic segmentation and quantification of epicardial adipose tissue from coronary computed tomography angiography. Physics in Medicine & Biology, 65(9): 095012. https://doi.org/10.1088/1361-6560/ab8077
[19] Commandeur, F., Goeller, M., Betancur, J., Cadet, S., Doris, M., Chen, X., Berman, D.S., Slomka, P.J., Tamarappoo, B.K., Dey, D. (2018). Deep learning for quantification of epicardial and thoracic adipose tissue from non-contrast CT. IEEE Transactions on Medical Imaging, 37(8): 1835-1846. https://doi.org/10.1109/TMI.2018.2804799
[20] Zhang, Z., Zhang, W. (2021). Pyramid medical transformer for medical image segmentation. arXiv Preprint arXiv: 2104.14702. https://doi.org/10.48550/arXiv.2104.14702
[21] Feng, S., Zhao, H., Shi, F., Cheng, X., Wang, M., Ma, Y., Xiang, D., Zhu, W., Chen, X. (2020). CPFNet: Context pyramid fusion network for medical image segmentation. IEEE Transactions on Medical Imaging, 39(10): 3008-3018. https://doi.org/10.1109/TMI.2020.2983721
[22] Zhang, B., Wang, Y., Ding, C., Deng, Z., Li, L., Qin, Z., Ding, Z., Bian, L., Yang, C. (2023). Multi-scale feature pyramid fusion network for medical image segmentation. International Journal of Computer Assisted Radiology and Surgery, 18(2): 353-365. https://doi.org/10.1007/s11548-022-02738-5
[23] Purwar, A., Singh, S.K. (2015). Hybrid prediction model with missing value imputation for medical data. Expert Systems with Applications, 42(13): 5621-5631. https://doi.org/10.1016/j.eswa.2015.02.050
[24] Tsipouras, M.G., Exarchos, T.P., Fotiadis, D.I., Kotsia, A.P., Vakalis, K.V., Naka, K.K., Michalis, L.K. (2008). Automated diagnosis of coronary artery disease based on data mining and fuzzy modeling. IEEE Transactions on Information Technology in Biomedicine, 12(4): 447-458. https://doi.org/10.1109/TITB.2007.907985
[25] Kahramanli, H., Allahverdi, N. (2008). Design of a hybrid system for the diabetes and heart diseases. Expert Systems with Applications, 35(1-2): 82-89. https://doi.org/10.1016/j.eswa.2007.06.004
[26] Lin, K.C., Hsieh, Y.H. (2015). Classification of medical datasets using SVMs with hybrid evolutionary algorithms based on endocrine-based particle swarm optimization and artificial bee colony algorithms. Journal of Medical Systems, 39(10): 119. https://doi.org/10.1007/s10916-015-0306-3
[27] Kupusinac, A., Stokic, E., Kovacevic, I. (2016). Hybrid EANN-EA system for the primary estimation of cardiometabolic risk. Journal of Medical Systems, 40(6): 138. https://doi.org/10.1007/s10916-016-0498-1
[28] Verma, L., Srivastava, S., Negi, P.C. (2016). A hybrid data mining model to predict coronary artery disease cases using non-invasive clinical data. Journal of Medical Systems, 40(7): 178. https://doi.org/10.1007/s10916-016-0536-z
[29] Muhammad, Y., Tahir, M., Hayat, M., Chong, K.T. (2020). Early and accurate detection and diagnosis of heart disease using intelligent computational model. Scientific Reports, 10(1): 19747. https://doi.org/10.1038/s41598-020-76635-9
[30] Md Idris, N., Chiam, Y.K., Varathan, K.D., Wan Ahmad, W.A., Chee, K.H., Liew, Y.M. (2020). Feature selection and risk prediction for patients with coronary artery disease using data mining. Medical & Biological Engineering & Computing, 58(12): 3123-3140. https://doi.org/10.1007/s11517-020-02268-9
[31] Misra, D., Nalamada, T., Arasanipalai, A.U., Hou, Q. (2021). Rotate to attend: Convolutional triplet attention module. In Proceedings of the IEEE/CVF Winter Conference on Applications of Computer Vision, pp. 3139-3148.
[32] Wang, Y., Zhou, C. (2020). Feature selection method based on chi-square test and minimum redundancy. International Conference on Intelligent and Interactive Systems and Applications, 1304: 171-178. https://doi.org/10.1007/978-3-030-63784-2_22