Radhika Moorthy*![]() | Balasubadra Kandasamy
| Balasubadra Kandasamy![]()
© 2025 The authors. This article is published by IIETA and is licensed under the CC BY 4.0 license (http://creativecommons.org/licenses/by/4.0/).
OPEN ACCESS
Diabetic retinopathy (DR) is the most common long-term eye disease that can cause permanent vision loss due to increased blood sugar levels. Early recognition and timely intervention significantly reduce the risk of DR and its complications. DL networks have advanced clinical image processing, particularly in retinal disease recognition, by enabling automated grading of DR stages and minimizing manual effort. The objective of this research is to develop an automatic retinal disease grading model using a Residual 3D Network (Res3DNet) with a Contextual Attention Module (CAM), termed ResCAM. ResCAM employs Res3DNet to extract shallow features and CAM to capture deeper semantic attributes of fundus images, including hard exudates, soft exudates, microaneurysms, and hemorrhages. The use of CAM improves feature representation while reducing the number of hyperparameters, making the network lightweight and easier to train. The model was validated using the Asia Pacific Tele-Ophthalmology Society (APTOS) database with suitable preprocessing and augmentation strategies. Experimental results demonstrate that ResCAM achieves 98.90% accuracy, 97.1% sensitivity, 85.80% specificity, 92.70% precision, and 93.60% F1-score, with a minimum ρ-value of 0.5%. Low standard deviation values confirm its reliability proving superior performance over existing DR identification networks in healthcare applications.
contextual attention mechanism, deep networks, retinal disease, residual network, feature extraction
Diabetic retinopathy (DR) is a microvascular complication arising due to the long-term consequences of diabetes mellitus. Hyperglycemia (or elevated blood sugar levels) can harm the retinal blood vessels, leading to retinopathy, where fluid and blood can seepage into the retina, causing reduced vision and potentially impaired vision if not addressed promptly [1]. As stated by the International Diabetes Federation (IDF), the number of people living with diabetes will rise to 643 million by 2030 and 783 million by 2045 from 366 million in 2011 [2]. The rise in diabetes occurrence is ascribed to features such as lifestyle behavior, heredity, and the aging population [3]. According to National Eye Institute reports, 11.3 million people are expected to have retinal disease by 2030, related to 7.7 million patients today [4]. Besides, 46.5% of those with diabetes mellitus have not been identified [5]. In the initial stage of DR, the central retina has fluid retention and waxy exudates in which fluid leaks from abnormal blood vessels. In general, vision is not considerably affected in the initial stages, but if it progresses, it can cause vision impairment. In the progressive stages, the blockage of blood vessels decreases blood flow to the retina, leading to macular edema to deteriorate further.
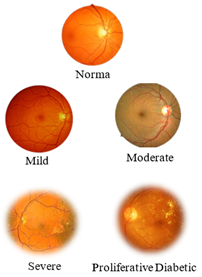
DR is classified into two stages based on its severity: proliferative DR (PDR) and Non-proliferative DR (NPDR) [6]. NDPR is the less severe and earlier stage, in which blood vessels in the retina may leak or swell, leading to minor hemorrhages or fluid backlog. It is characterized by slight blood vessel changes. Though it may remain asymptomatic, it has the potential to lead to more severe issues, if it left untreated. NDPR is categorized into 4 stages: normal, mild, moderate, and severe. The normal stage indicates diabetic patients without retinal injuries. In mild retinopathy, microaneurysms (small bulging area in the blood vessels) are present. Microaneurysms might not cause noticeable symptoms, but they can serve as an early warning of damage. At the end of the microaneurysm, circular red dots are visible. Moderate retinopathy is marked by microaneurysms along with additional alterations in the blood vessels, such as hemorrhages and exudates. Hemorrhages refer to minute fluid spots that seep out of the blood vessels, whereas exudates are deposits of lipid and protein material that leak from injured blood vessels. In this stage, red spots in the microaneurysms penetrate the deeper layers of the retina, triggering a hemorrhage. Severe retinopathy is characterized by the existence of some exudates, hemorrhages, and microaneurysms. This can lead to considerable vision impairment or blindness.
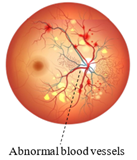
PDR is a more progressive and severe stage of DR. In this stage, new and anomalous retinal blood vessels are developed, which can bleed into the vitreous and cause low vision or even permanent impairment. Figure 1 illustrates each stage of retinopathy. Early recognition of this disease is a complex process as it is asymptomatic or appears with slight signs, leading to vision impairment [7]. If diabetic retinal disease is identified early, ophthalmologists create small burns around the retinal tears using lasers to avoid fluid seepage and prevent the development of new blood vessels that avert blindness.
(a)
(b)
Figure 1. (a) Stages of NPDR; (b) PDR [8]
Retinopathy is diagnosed by a trained medical professional or ophthalmologist from color fundus scans. Due to low adherence and availability of retinal imaging modalities, numerous unidentified patients have missed out suitable clinical service. The prevalence of retinopathy among diabetic patients has reached epidemic levels. The early detection of retinopathy and its growth are important to prevent the jeopardy of retinopathy allowing for timely intervention with the most suitable treatment before it becomes serious. The jeopardy of vision impairment can be minimized considerably using evidence-based disease management. Recent research works highlight that around 90% drop of the jeopardy is possible through effective treatment, emphasizing the importance of early intervention and management [9]. For example, laser surgery has been considered an effective treatment for the early stages of retinopathy to seal off seeping vessels and thwart new ones from developing.
Deep Learning (DL) networks are transforming evidence-based decision-making models that can fetch numerous innovations in computer vision [10]. After performing a complete state-of-the-art survey on the retinopathy diagnosis models, observed that DL algorithms achieved better detection accuracy related to other existing approaches. DL excel in extracting complex attributes from clinical scans using filters. The potential of these networks stems from their capacity to process huge databases [11]. DL networks, mainly, Convolutional Neural Networks (CNN) have been implemented as efficient networks for DR detection [12]. The primary advantage of these models is their application of transfer learning, which enables models trained on a specific task to be repurposed to identify or classify new samples. A serious limitation of DL models is their dependence on large datasets for training. It is usually difficult to collect huge data samples in the healthcare sector. Multi-layer convolutional filters are used to extract shallow (low-level) features (i.e., colour and texture) while deep (high-level) features comprise more abstract information for image classification. Improved feature engineering is critical to increase the performance of retinopathy detection methods.
An attention module is usually included in the image classifiers to make the model pay more attention to the Region of Interest (RoI) on the medical scans. This research develops a deep network, called ResCAM incorporates a CAM unit to the Res3DNet to implement both the concepts of residual learning and contextual attention mechanism. In this research, we first develop a Low-Level Feature Extraction (LFE) module to extract colour, texture, etc., and Res3DNet architecture to reduce the number of model parameters by focusing on shallow attributes. Then, develop our CAM unit to support deep feature extraction of retinopathy (e.g., exudates, hemorrhages, microaneurysms, intra-retinal microvascular anomalies, venous beading, etc.). The primary contributions of this study include:
(a) Develop an efficient automatic DR diagnosis network, called ResCAM with better classification performance.
(b) The proposed ResCAM model implements CAM to learn the semantic features of retinopathy and Res3DNet to classify patient fundus scans based on the given features.
(c) The performance of the ResCAM network is verified and studied over the APTOS database with respect to designated performance indicators.
The rest of this manuscript is structured as follows: Review the relevant research works about retinopathy recognition networks in Section 2. Delve into the details of the proposed Res3DNet model for classifying fundus images in Section 3. Section 4 presents the implementation details of the ResCAM model. In Section 5, provide an analysis of the results. Section 6 provides the concluding remarks.
Recently, medical professionals and investigators have widely contributed to abnormality detection and classification in the domain of image processing. The utilization of radical deep networks has transformed medical image classification, feature engineering, RoI segmentation, etc. developed an effective network using several deep learning algorithms to study and evaluate their performance, which contributes to feature engineering and DR detection from fundus images [13]. The authors demonstrated that the DenseNet-201 realized a better training accuracy of 99.58% and a testing accuracy of 76.80%. Proposed a Residual U-Net that uses ResNet-34 to segment the RoIs from retinal photographs [14]. This model was evaluated on IDRiD and E_OPHTHA_EX databases and realized better performance with 93.88% accuracy.
Developed an Inception-V3 network with transfer learning for recognizing NPDR stages [15]. This network employs 7-field color retinal images and classifies DR based on the rigorousness of retinal disease. Propsoed a new 3D CNN to identify bleedings, a primary indication of retinopathy, through a pre-trained VGG-19 network to excerpt attributes from isolated RoIs [16]. The performance of this network was verified using 1509 fundus photographs from various databases. This model realized 97.71% accuracy. Presented a DL to diagnose and classify fundus photographs automatically according to the rigorousness of retinopathy stages through AlexNet [17]. This model selects the most significant features using the Resnet101 network. In this network, the interrelated layers are used to identify important features; also, the Ant Colony Algorithm is employed to choose the appropriate attributes. This model employs a Support Vector Machine with multiple kernels to categorize the fundus photographs according to the selected attributes. It achieves better classification results with 93% accuracy.
Proposed three DL namely InceptionV3, ResNet151, and Inception-ResNetV2 [18]. These networks are executed independently using retinal photographs and realize an accuracy of 87.91%, 87.20%, and 86.18%, respectively. This model achieved 88.21% classification accuracy when all these networks were ensembled using the AdaBoost algorithm. Proposed a ResNet-based retinopathy classifier using fundus images [19]. The authors use the feature map obtained from the ResNet model and send it to the Random Forest classifier. The empirical outcomes derived from this model prove that the proposed network surpasses other existing networks with an accuracy of 96%. Developed an optimized MobileNet-V3 network for classifying rigorous levels of retinopathy from fundus photographs [20]. The author applied the intended model to EyePacs and APTOS databases. The results demonstrated that the MobileNet-V3 achieves an accuracy of 98% and 98.4% in the APTOS and EyePacs databases, correspondingly. Developed a novel network, called EfficientNet to identify and classify retinopathy stages with better classification performance and reduced processing complexities [21]. The projected model includes an effective skin connection mechanism, a dense layer with a suitable activation function, and a softmax layer. This model achieves 86.34% of classification accuracy.
Current research works on retinopathy detection models were hinged on the physically designated features to measure the optic disc and the blood vessels, and on recognizing the anomalies like hemorrhages, microaneurysms, soft exudates, hard exudates, etc. Then the classification was achieved by exploiting these features using various deep networks. Some research works use an attention technique that allows the models to focus only on important attributes to increase the performance of the system [22]. Developed MobileNet with local and global attention modules to categorize retinal photographs into normal or retinopathy [23]. This network achieves a classification accuracy of 78.13%. Developed a multi-scale attention network for retinopathy recognition [24]. This model employs an encoder unit to map the input retinal photographs in a high-dimensional space, where the mixture of mid and high-level attributes is applied to increase the representation. Then, a multi-scale attribute map is used to define the retinal structure in various positions.
From this review, observe some issues related to the traditional DL in retinopathy identification. To train deep networks, it is indispensable to exploit huge datasets that are both of greater resolution and large. Also, it is perplexing to collect assorted and characteristic databases of fundus photographs, particularly when processing advanced DR stages. The application imbalanced datasets may deteriorate the system enactment. It brings some practical difficulties in identifying data samples precisely. Classifying fundus photographs in real-time for later detection in point-of-care or telemedicine scenarios can enforce a substantial necessity for effective resources and cutting-edge technologies. The present deep learning networks, like DenseNet, VGG, Inception V3, MobileNet, etc., need vast processing power and memory for diagnosing retinopathy stages. There is an urgent need for lightweight networks to handle the abovementioned issues and to recognize retinopathy.
This section discusses proposed ResCAM model which employs the Res3DNet with the CAM module to classify DR stages. The ResCAM uses the Res3DNet to extract shallow features and CAM to excerpt deep attributes of the retinal images. By applying the concept of CAM, network extracts particular semantic features including microaneurysms, hemorrhages, soft exudates, and hard exudates. This network achieves a substantial reduction in the number of hyperparameters to develop a lightweight model.
3.1 Structure of Res3Dnet
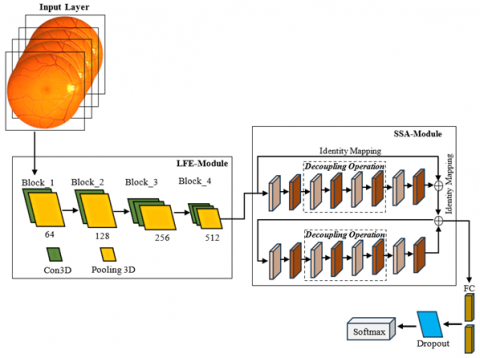
A 3D CNN is proposed to excerpt the most important attributes from fundus images [16]. Conversely, the shallow structure of this network makes it problematic to extract deep features. Introduced attention-based feature selection modules to determine both deep and shallow attributes of fundus images through residual learning and classify them using these features [25]. This network can grade the fundus images with an accuracy of 93.4%. Conversely, it delivers a poor kappa value denotes that more images have been categorized wrongly. To overcome the limitations of 3D CNN and ResNet configurations and make use of these two networks, we propose a Res3DNet with a CAM module. The Res3DNet is employed to excerpt shallow attributes and CAM is used to determine the most important features from the retinal pictures. Figure 2 displays the structure of the ResCAM model. The intended architecture comprises an input layer, an attribute extraction module, a dense module, and an output module.
The input layer accepts 2D or 3D input retinal images and sends them to the feature extraction modules to extract the global features. These features are transferred to the output module for further processing. Develop the feature selection module with two individual components: (i) a Low-level Feature Extraction (LFE) unit to extract the shallow features like texture and colour from retinal photographs; and (ii) a High-level Feature Extraction (HFE) unit. This module uses the residual 3D configuration with a CAM module. The dense layer comprises the dense and dropout or skip connection mechanism. The utilization of a dropout link increases the possibility of random dropout and reduces the number of connections among neurons, consequently preventing the probability of overfitting issues. The output layer categorizes the retinopathy stages according to the attributes. It enables multi-classification using the softmax layer.
Figure 2. Structure of the ResCAM model with Res3DNet and CAM module
3.2 LFE module in Res3DNet
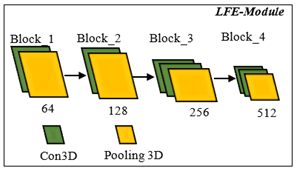
This module receives input images and sends them to convolution and pooling functions to excerpt the low-level attributes from the fundus photographs. The structure of this unit is demonstrated in Figure 3. The convolutional layer processes the input retinal image (X) and computes the dot product of the weights and the neurons in the input layer. The input layer comprises input data or a feature map constructed from an earlier convolutional module. Therefore, convolution modules execute a conversion process on the image to determine attributes from it; this transformation is known as the activation function. Each convolutional layer comprises kernels, activation maps, parameter sharing, and hyperparameters of a specific layer.
The Rectified Linear Unit (ReLU) is a potential option for the activation function. The pooling function extracts various shallow features from the fundus photographs. The output of this module is transferred to the HFE module for further processing. The architecture of the LFE module comprises four small blocks. Each block contains one or more convolutions and one pooling layer to excerpt low-level attributes. The convolution function refers to the execution of a 3D kernel (the size of the kernel used in this research is 3×3×3) to excerpt the attributes of the input retinal photographs. The pooling layer decreases the dimensions of the attribute vector obtained from the convolution layer without losing important data. This reduces processing complexity and evades overfitting issues. It enables the succeeding convolutional modules to excerpt features at a diverse scale.
Figure 3. Model for extracting low level features
3.3 3D residual module
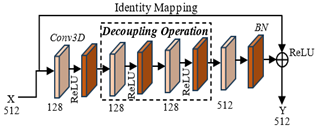
To handle the vanishing gradient problem of the system, we intend to develop a typical residual structure [26]. In this research, we propose a 3D residual network that is suitable for high-level feature selection. Figure 4 shows the structure of the 3D residual unit. It receives the low-level features extracted by the LFE unit and then sends them to the convolutional and standardization units to excerpt the abstract and higher-level features. Through residual modules, input images can be sent faster over shortcut connections across layers. The residual unit is deemed as an exceptional case of the multi-branch Inception unit. This model comprises two residual structures. Each structure comprises 4 convolutional layers, 4 normalization layers, and a summation layer. The convolution layer is followed by a Batch Normalization (BN) layer and a ReLU. Then, skip 2 convolution layers using the decoupling process and add the input to the final ReLU module. This form of architecture makes the output of the two convolutional layers need to be of equal dimension as the input; therefore, they can be added together. If the number of channels, it is required to include an additional 1×1 convolutional layer to convert the input into the desired dimension for the addition operation.
Figure 4. 3D residual structure
From this model, it is observed that the architecture of the 3D residual module uses a drop-out mechanism on Conv_2 and Conv_3 and divides into two operations such as 2D spatial convolution and 1D temporal convolution. This operation is more promising to select deep features. The normalization layer is used to standardize the input data to enable uniform data distribution, thus reducing the effect of the imbalance dataset problem on training and eliminating overfitting problems. This procedure can be executed using four basic steps as given below:
(a) Calculate the mean value of each data batch. Consider the input data $x \in\left\{x_1, x_2, x_3 \ldots x_n\right\}$. The mean value $\mu$ can be calculated using Eq. (1).
$\mu \in \frac{1}{n} \sum_{i=1}^n x_i$ (1)
(b) Compute the variance $\sigma^2$ of the input data batch using Eq. (2).
$\sigma^2=\frac{1}{n} \sum_{i=1}^n\left(x_i-\mu\right)^2$ (2)
(c) Apply $\sigma^2$ and $\mu$ to standardize the data by Eq. (3).
$\widehat{x}_{\imath}=\frac{x_i-\mu}{\sqrt{\sigma^2+\varepsilon}}$ (3)
where, $\widehat{x_{\imath}} \in\left\{\widehat{x_1}, \widehat{x_2}, \widehat{x_3} \ldots \widehat{x_n}\right\}$ is a normalized data point, and $\varepsilon$ is trivial (typically equal to 10−5), applied to stop the denominator from being zero.
(d) Apply scale transformation and translation operations to the standardized data samples $\widehat{x}_{\imath}$ as given in Eq. (4).
$y_i=\gamma \widehat{x}_{\imath}+\beta$ (4)
where, $\gamma$ is the transformation limit and $\beta$ is the translation limit gained by the network during training.
To map the input received by the residual block to the output, we employ identity transformation addition that copies the input data into the output without any modification. Once this procedure is over, this result is transmitted to the $ReLU$ to improve its output nonlinearity.
3.4 Contextual attention unit
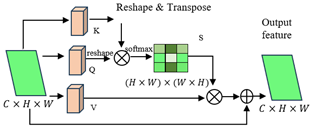
Each stage of retinopathy has certain features. These stages are identified based on the existence of hemorrhage, microaneurysms, soft exudates, and hard exudates [27]. The feature map $F \in R^{d \times w \times c}$ obtained by the deep networks only contains the high-quality attributes and it is difficult to excerpt the specific attributes for each stage. In this research, we develop a CAM module to excerpt the exact semantic features of retinal disease. Figure 5 displays the structure of the projected CAM, which receives the feature map $F \in R^{d \times w \times c}$ as the input and implements the contextual attention mechanism to spatial and/or temporal relationships between the features. First, the input attribute vector is transformed into three components: query, key, and value. The query is employed to calculate the similarity among attributes. The key is used to match the relevance between various sections of the input. Value is the actual data transmitted to the subsequent module. These components are derived by linear projections of the input attribute vector as given in Eqs. (5)-(7).
$Query = W_q F$ (5)
$Key = W_k F$ (6)
$Value = W_v F$ (7)
where, $W_q, W_k, W_v$ are learnable weight matrices.
Figure 5. Structure of CAM
The attention map is calculated by relating the Query and Key tensors to determine how regions are related to each other. This is usually performed by scaled dot-product attention. The raw attention scores between the queries and keys are calculated using Eq. (8):
$A=\frac{Q \circ K^T}{\sqrt{C}}$ (8)
where, $A$ is the attention score matrix, $\circ$ denotes the dot product between the query and key, $\sqrt{C}$ is a scaling factor to evade large values that could deter the softmax operation. To ensure that the attention weights are between 0 and 1 and sum to 1, we apply the softmax operation over the attention scores as given in Eq. (9):
$A_{s m}=S M(A, \operatorname{dim}=-1)$ (9)
The softmax operation standardizes the attention scores along the last dimension so that each row $A_{s m}$ sums to 1. After getting a standardized attention map, we use it to weight the Value matrix to generate the ultimate attended attributes as given in Eq. (10):
$F_{ {attended }}=A_{s m} \cdot V$ (10)
where, $F_{ {attended }}$ is the output attribute vector after paying attention to the value attributes. This provides attended attributes, where more significant areas are highlighted, and less significant areas are inhibited based on the gained attention scores. To ensure that significant data does not vanish during attention weighting, a residual connection is included. The output of this stride is a set of contextually weighted attributes that emphasize the related sections of the input data. After the attention-weighted attributes are calculated, they can be combined with the input attributes, either by adding, concatenating, or other functions. The idea is to preserve both the input data and the attended attributes together, allowing the model to learn from both. This fusion helps the network keep the basic attributes while also including the data from the attention mechanism. The original attributes $F$ are added to the attended attributes as given in Eq. (11):
$F_{ {output }}=F_{ {attended }}+F$ (11)
The inclusion of the residual connection enables the network to preserve the input attributes during training. Finally, the result is transferred through $ReLU$ to add non-linearity into the network as given in Eq. (12):
$F_{ {output }}={ReLU}\left(F_{ {output }}\right)$ (12)
This ensures that the network can learn complex patterns in the data. This process helps the network learn contextually significant attributes by concentrating on germane spatial or temporal regions of the input data. Table 1 shows the parameters related to the proposed CAM module in ResCAM.
Table 1. Parameters related to CAM
|
Layer |
Parameter |
Shape of Parameter |
|
Input Feature Map |
$F$ |
$R^{d \times W \times C}$ |
|
Query Projections |
$W_q$ $Q$ |
$R^{C \times C}$ $R^{d \times W \times C}$ |
|
Key Projections |
$W_k$ $K$ |
$R^{C \times C}$ $R^{d \times W \times C}$ |
|
Value Projections |
$W_v$ $V$ |
$R^{C \times C}$ $R^{d \times W \times C}$ |
|
Attention Score Calculation |
$\frac{Q \circ K^T}{\sqrt{C}}$ |
$R^{d \times W \times d \times W}$ |
|
Softmax Normalization |
$S M(A, \operatorname{dim}=-1)$ |
$R^{d \times W \times d \times W}$ |
|
Weighted Sum of Values |
$A_{s m} \cdot V$ |
$R^{d \times W \times d \times W}$ |
|
Residual Connection |
$F_{ {attended }}+F$ |
$R^{d \times W \times C}$ |
|
Activation Function ($ReLU$) |
${ReLU}\left(F_{{output }}\right)$ |
$R^{d \times W \times C}$ |
|
Output Feature Map |
$F_{{output}}$ |
$R^{d \times W \times C}$ |
Proposed ResCAM employs Res3DNet as the mainstay network to categorize attributes extracted from input images. The dense and softmax layers of Res3DNet achieve classification. CAM is mainly used to select the significant attributes that are strong enough to represent the local differences. The features from each spatial domain are considered here. ResCAM not only increases the receptive area of kernels across layers but also decreases memory and computational overhead by decreasing the resolution of the feature maps while preserving significant information required for classification.
The main goal of the ResCAM is to automatically and accurately recognize fundus photographs as benign and malicious by applying the vital signs of retinopathy. The detection performance is improved in the present study using a Res3DNet model with a CAM module. We carry out the empirical analysis on a test bed using an 3.06 GHz speed, 16GB RAM, Intel Core i7-4790 Processor and Windows 10 operating system. All the DR classification models including ResCAM are implemented using MATLAB R2024a/Deep learning toolbox. This toolbox offers functions, apps, and Simulink blocks for scheming, applying, and modeling deep networks. Table 2 shows the parameter setting of experimental setup.
Table 2. Training hyperparameters for ResCAM
|
Parameter |
Value/Setting |
|
Optimizer |
Adam ($\beta 1$ = 0.9, $\beta 2$ = 0.999) |
|
Initial Learning Rate |
0.001 (cosine annealing to 1e-6) |
|
Batch Size |
32 |
|
Epochs |
200 |
|
Loss Function |
Categorical Cross-Entropy |
|
Weight Initialization |
He initialization |
|
Regularization |
L2 weight decay = 1e-5 |
|
Dropout |
0.3 (fully connected layers) |
|
Early Stopping |
Patience = 15 epochs (no val. loss improvement) |
4.1 Dataset
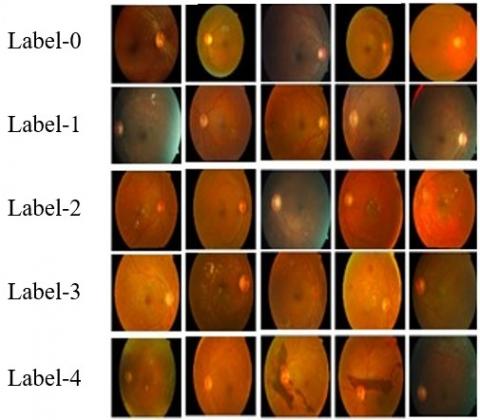
In this study, collected retinal photographs for training and testing our ResCAM model from an open-source database, APTOS-2019 [28]. It comprises 3662 retinal images captured under different conditions and sizes, out of which 3367 images are NPDR and 295 samples belong to the PDR. The sample retinal photographs with equivalent labels are given in Figure 6.
Figure 6. Sample fundus photographs in the APTOS-2019 database [28]
Table 3 displays the class distribution statistics of the APTOS-2019 database. An ophthalmologist has categorized each image based on the rigorousness of retinal disease on a measure of 0 to 4.
Table 3. Data distribution in APTOS-2019 [28]
|
Stage |
Label |
Number of Samples in the Dataset |
|
Benign |
0 |
1805 |
|
Minor DR |
1 |
370 |
|
Moderate DR |
2 |
999 |
|
Severe DR |
3 |
193 |
|
Proliferative DR |
4 |
295 |
|
Total |
3662 |
|
4.2 Preprocessing of data samples
Retinal photographs are high-resolution images, which need high computational power for processing. Moreover, the artifacts and noise removal from these photographs is a perplexing procedure in the DR classification process. To eliminate artifacts and noise from the retinal images, we apply a simple thresholding technique. In this technique, each pixel $(x,y)$ can be recognized and pigeonholed as an artifact using a restraint given in Eq. (13):
$\left\{(Q(x, y)>\varphi_1\right\}$ and $\left\{\left(Q(x, y)-Q_{ {avg }}(x, y))>\varphi_2\right)\right\}$ (13)
where, $Q$ is the image with pixel $(x, y)$ and $Q_{\text {avg }}(x, y)$ is the average brightness of the adjacent pixel which is calculated by the local mean filter with size of $12 \times 12$. In this research, we select the threshold values $\varphi_1=0.87$ and $\varphi_2=0.096$ derived from [29]. The original intensity of a pixel is defined by Eq. (14):
$I_p=I_p 0+\varepsilon$ (14)
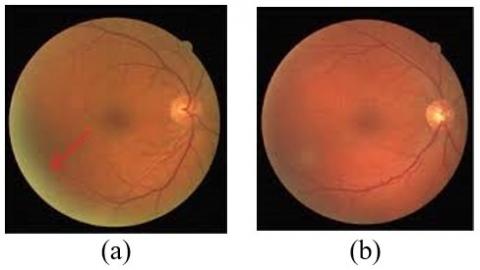
where, $I_p 0$ is the real intensity of the pixel and $\varepsilon$ is the noise in that picture element. We can achieve $I_p=I_p 0$ when the average value of artifacts and noise is zero. Figure 7 shows sample input image and an image after removing noise.
Figure 7. Threshold-based noise removal (a) Input image; (b) Image after removing noise
Along with the noise removal process, we use two preprocessing methods, viz. Graham processing (GP) [30] and Contrast Limited Adaptive Histogram Equalization (CLAHE) [31] to increase the quality of image. Both techniques can handle the issues due to the low contrast, blur, and irregular illumination that is extant in the images. GP is used to remove image quality deprivation due to deviations in brightness or scanners. Given a fundus photograph $Q$, the pre-processed picture $\widetilde{Q}$ after using GP is computed by Eq. (15):
$\widetilde{Q}=\gamma_1 Q+\gamma_2 \delta(\varphi) \circledast Q+\gamma_3$ (15)
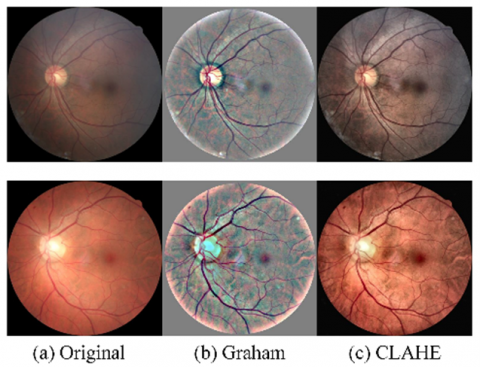
where, $\delta(\varphi) $ is a 2D Gaussian filter with a standard deviation $\theta, \circledast$ is the convolutional function; $\gamma_1, \gamma_2$, and $\gamma_3$ are weighting factors. By following the technique proposed in [32], we select $\varphi=10, \gamma_1=4, \gamma_2=-4$, and $\gamma_3=128$. CLAHE is a contrast improvement technique to emphasize lesions in retinal pictures. Histogram equalization enhances the contrast of the image by scattering the most normally befalling intensity values in the histogram, but it exaggerates noise. CLAHE prevents noise intensification by cutting the histogram at a threshold value. The lesions are highlighted after applying GP and CLAHE methods as shown in Figure 8.
Figure 8. Image improvement using GP and CLAHE methods
4.3 Data augmentation
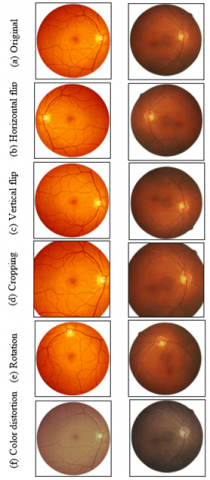
DL need large datasets for training to provide accurate results. On the other hand, in the healthcare sector, collecting large databases is a key challenge due to security and privacy problems [33]. Hence, data augmentation methods are adapted to increase size of the database for training by making small modifications to the existing images. Data wrapping or oversampling methods are used to increase the number of pictures in the training databases or support the model to handle data imbalance and overfitting problems. In this research, we add more samples by varying the image parameters using rotation, flipping, cropping, scaling, and color-shifting. Table 4 shows the parameters used in this study.
Table 4. Operations used for data augmentation
|
Parameter |
Value |
Action |
|
Vertical_flip |
True |
Rotates the image along the vertical axis |
|
Horizontal_flip |
True |
Rotates the image along the horizontal axis |
|
Fill_mode |
closest |
The value of the adjacent pixel is selected to fill the null values |
|
Zoom_range |
0.2 |
Zoom in or out of the picture from the center |
|
Rotation_range |
10 |
Adjust the orientation of the input image |
|
Shear_range |
0.2 |
Resize the picture |
|
Width_shift_range |
0.2 |
The picture is randomly relocated horizontally |
|
Channel_shift_range |
10 |
Randomly varies channel parameters to modify the color |
|
Height_shift_range |
0.2 |
The picture is randomly moved vertically |
Figure 9. Sample images gained from augmentation methods
Table 5. Data distribution in APTOS-2019 after applying data augmentation methods
|
Stage |
Label |
Number of Original Samples |
Number of Samples After Applying Augmentation |
|
PDR |
4 |
295 |
1853 |
|
Severe DR |
3 |
193 |
1786 |
|
Moderate DR |
2 |
999 |
1961 |
|
Minor DR |
1 |
370 |
1887 |
|
Benign |
0 |
1805 |
1805 |
|
Total |
3662 |
9292 |
|
By applying the image augmentation technique, we generate 5630 extra images in each stage of retinopathy to make 9292 training samples. Figure 9 shows some of the pictures produced by augmentation techniques. Table 5 shows the details of the augmentation techniques and the final amplified retinal images of each stage of retinopathy.
4.4 Performance indicators
To assess the performance of the ResCAM model, we consider 6 important indicators including accuracy, precision, sensitivity, specificity, F1-measure, and ρ-value. These evaluation metrics (except ρ-value) are essential to be greater to increase the efficiency of the DR classifier. The accuracy is defined in Eq. (16):
${Accuracy}(A C C)=\frac{T^{-}+T^{+}}{T^{-}+T^{+}+F^{-}+F^{+}}$ (16)
where, $T^p$ (true positives) indicates an image is correctly classified as malevolent; $F^n$ (false negatives) represents a malevolent image is wrongly considered as benign; $T^n$ (true negatives) indicates an image is appropriately classified as benign, and $F^p$ (false positives) signifies a benign image is incorrectly considered as malevolent.
Sensitivity defines the true positive rate of the system which defines the ability of a proposed method to correctly categorize pictures with DR. It is calculated using Eq. (17). Specificity is the true negative rate which represents the capacity of the system to correctly categorize normal pictures as defined by Eq. (18). Precision is the capability of a system to categorize only the appropriate images. This performance metric determines the number of malevolent images that really belong to the DR as defined by Eq. (19). F1-measure provides a score about the sensitivity and precision of the model. It is calculated using Eq. (20):
$Sensitivity (S E N)=\frac{T^p}{T^p+F^n}$ (17)
$Specificity (S P E)=\frac{T^n}{T^n+F^p}$ (18)
${Precision}(P R E)=\frac{T^p}{T^p+F^p}$ (19)
$F 1- measure (F 1-M)=\frac{T^p}{T^p+\frac{1}{2}\left(F^p+F^n\right)}$ (20)
A nonparametric statistical test, Wilcoxon's rank-sum test [34], is performed to assess whether the proposed model offers a significant improvement over other models. The test was conducted at a 5% significance level. P-values less than 0.05 suggest the rejection of the null hypothesis, indicating a meaningful change at the 5% level. On the other hand, p-values greater than 0.05 imply no significant difference between the compared models.
4.5 Ablation study
While deep residual networks and attention mechanisms have been individually employed in DR classification, the novelty of ResCAM lies in its synergistic integration of a Res3DNet with a CAM. Most existing attention-based DR models primarily emphasize feature re-weighting, but they often lack the ability to effectively capture contextual dependencies across spatial and depth dimensions. Similarly, conventional ResNet-based approaches excel at hierarchical feature extraction but fail to adequately highlight clinically salient regions. By embedding CAM into Res3DNet, ResCAM is able to explicitly model semantic relationships between local pathological signs and their broader retinal context, which is crucial for differentiating between adjacent DR stages. This hybrid design also reduces redundant parameters by avoiding overly complex multi-branch attention architectures, thereby making the model both lightweight and performance-efficient. To reinforce this contribution, we conducted an ablation study where (i) baseline Res3DNet was tested without CAM; (ii) standalone CAM-enhanced 2D residual networks were evaluated; (iii) full ResCAM (Res3DNet + CAM) was compared against both.
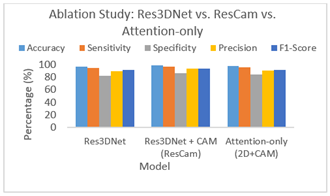
The results show that ResCAM consistently outperforms standalone residual and attention-based variants, with notable improvements in sensitivity (↑2.3%), F1-score (↑2.7%), and specificity (↑3.1%). This indicates that the performance gain arises specifically from the integration of CAM into Res3DNet, and not merely from using attention or residual components independently. The ablation results clearly demonstrate the added value of integrating CAM into Res3DNet. Table 6 and Figure 10 display the results obtained from ablation study.
Table 6. Results obtained from ablation study
|
Model |
ACC (%) |
SEN (%) |
SPE (%) |
PRE (%) |
F1-M (%) |
|
Res3DNet (Baseline) |
96.1 |
94.8 |
82.7 |
89.5 |
90.9 |
|
Attention-only (2D+CAM) |
97.2 |
95.6 |
83.5 |
90.2 |
91.5 |
|
ResCAM (Res3DNet + CAM) |
98.9 |
97.1 |
85.8 |
92.7 |
93.6 |
Figure 10. Results obtained from ablation study
The baseline Res3DNet achieves strong performance, but it lacks the ability to emphasize clinically significant regions, resulting in relatively lower specificity (82.7%). The Attention-only variant improves sensitivity but remains limited in overall feature extraction, yielding moderate precision and F1-score. In contrast, ResCAM (Res3DNet + CAM) achieves the best performance across all metrics, with notable improvements in accuracy (+2.8%), specificity (+3.1%), and F1-score (+2.7%) over the baseline. These gains confirm that the performance boost does not arise solely from residual learning or attention, but from their synergistic integration, which effectively captures both local retinal lesions and their broader contextual dependencies. Thus, ResCAM establishes itself as a lightweight yet powerful architecture for DR grading, outperforming existing standalone residual or attention-based networks.
4.6 Analysis of computational complexity
Compare the computational complexity and efficiency of the proposed ResCAM against baseline networks commonly used for DR grading to prove the lightweight nature. Compare the proposed model in terms of the number of parameters (in millions), Floating Point Operations (FLOPs, in GigaFLOPs per image), and average inference time (ms per image). The results indicate that ResCAM reduces parameter count and FLOPs by ~35% compared to Res3DNet while achieving superior classification performance. The average inference time per retinal image is also reduced to under 10 ms, demonstrating that ResCAM can operate in real-time clinical environments. This validates the “lightweight” claim: ResCAM not only delivers improved accuracy and robustness but also does so with lower computational overhead, making it highly suitable for deployment on resource-constrained healthcare systems. Table 7 compares the computational efficiency of different models including the ResCAM network.
Table 7. Computational efficiency comparison
|
Model |
Parameters (M) |
FLOPs (GFLOPs) |
Inference Time (ms/image) |
|
ResNet-50 |
25.6 |
4.1 |
15.2 |
|
DenseNet-121 |
8.1 |
2.9 |
12.4 |
|
Res3DNet (Baseline) |
12.3 |
3.5 |
13.1 |
|
Attention-only (2D+CAM) |
10.7 |
3.2 |
12.7 |
|
ResCAM (Proposed) |
7.9 |
2.4 |
9.8 |
The effectiveness of the ResCAM model is evaluated by comparing the numerical outcomes with that of a few analogous retinopathy identification models, including DenseNet-201 [13], Inception-V3 [15], VGG-19 [16], AlexNet [17], ResNet [19], MobileNet-V3 [20], and EfficientNet [21]. Table 8 gives the performance measures gained by our ResCAM on the APTOS-2019 database for all 10 folding. From these performance indicators, it is observed that the ResCAM achieves 98.90% accuracy, 97.1% sensitivity, 85.80% specificity, 92.70% precision, and 93.60% F1 measure. Besides, it achieves a reduced ρ-value (i.e., 0.5%) which designates that the results obtained from our ResCAM are significant. Moreover, ResCAM produces the lowest SD values in the classification task with 1.0% accuracy, 0.9% sensitivity, 2.8% specificity, 1.6% precision, 1.7% F1-measure, and 0.5% ρ-value.
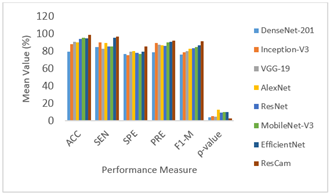
Table 9 presents the results obtained from various DR identification networks on the APTOS-2019 database regarding the mean value of performance measures. The mean and Standard Deviation (SD) values of the performance indicators of each model are illustrated in Figures 11 and 12. From these figures, it is found that the DenseNet-201 has realized 79.89% accuracy, 84.83% sensitivity, 77.05% specificity, 79.41% precision, 76.50% F1-Measure, and 4.3% ρ-value. The Inception-V3 model has realized 88.27% accuracy, 90.74% sensitivity, 75.79% specificity, 79.41% precision, 78.90% F1-Measure, and 5.39% ρ-value. It is found that the VGG-19 outdoes DenseNet-201 and Inception-V3 considerably with accuracy (91.25%), sensitivity (82.78%), specificity (79.55%), precision (87.85%), F1-Measure (80.40%), and ρ-value (4.76%).
Table 8. Performance of ResCAM for various folding
|
Fold |
ACC (%) |
SEN (%) |
SPE (%) |
PRE (%) |
F1-M (%) |
ρ-value (%) |
|
#1 |
99.70 |
97.20 |
88.40 |
90.10 |
91.00 |
2.70 |
|
#2 |
99.00 |
98.20 |
86.20 |
91.40 |
92.40 |
2.60 |
|
#3 |
98.40 |
98.10 |
84.10 |
91.00 |
91.90 |
3.50 |
|
#4 |
97.90 |
97.30 |
88.90 |
92.10 |
93.00 |
2.60 |
|
#5 |
99.70 |
96.20 |
80.20 |
94.00 |
95.00 |
3.30 |
|
#6 |
99.80 |
96.90 |
84.40 |
95.00 |
96.00 |
3.10 |
|
#7 |
99.40 |
96.50 |
87.30 |
93.90 |
94.90 |
2.10 |
|
#8 |
97.90 |
98.50 |
87.70 |
94.40 |
95.40 |
3.00 |
|
#9 |
99.60 |
95.70 |
87.90 |
93.10 |
94.10 |
2.20 |
|
#10 |
97.10 |
96.20 |
82.60 |
92.00 |
92.90 |
3.20 |
|
Mean |
98.90 |
97.10 |
85.80 |
92.70 |
93.60 |
2.80 |
|
SD |
1.00 |
0.90 |
2.80 |
1.60 |
1.70 |
0.50 |
Table 9. Mean value of evaluation metrics achieved by different DR detection models
|
Algorithm |
ACC (%) |
SEN (%) |
SPE (%) |
PRE (%) |
F1-M (%) |
ρ-value (%) |
|
DenseNet-201 |
79.89 |
84.83 |
77.05 |
79.41 |
76.50 |
4.30 |
|
Inception-V3 |
88.27 |
90.74 |
75.79 |
89.39 |
78.90 |
5.39 |
|
VGG-19 |
91.25 |
82.78 |
79.55 |
87.85 |
80.40 |
4.76 |
|
AlexNet |
90.66 |
90.04 |
80.52 |
87.34 |
82.80 |
12.62 |
|
ResNet |
94.56 |
85.54 |
78.70 |
86.32 |
83.50 |
9.72 |
|
MobileNet-V3 |
95.97 |
85.59 |
77.22 |
90.35 |
85.00 |
10.45 |
|
EfficientNet |
95.03 |
95.50 |
79.47 |
91.23 |
86.80 |
9.81 |
|
ResCAM |
98.86 |
97.05 |
85.76 |
92.72 |
91.70 |
2.83 |
Figure 11. Mean value of performance measures achieved by different DR detection models
The AlexNet-based retinopathy diagnostic model provides better performance with classification accuracy of 90.66%, sensitivity of 90.04%, specificity of 80.52%, precision of 87.34%, F1-Measure of 82.80%, and ρ-value of 12.62%. The ResNet-based DR detection model produces improved performance through a skip connection mechanism. This model delivers enhanced performance regarding the accuracy, sensitivity, specificity, precision, F1-Measure, and ρ-value with 94.56%, 85.54%, 77.22%, 90.35%, 85.00%, and 10.45%, respectively. By applying the improved feature engineering, MobileNet-V3 shows greater DR classification enactment with an accuracy of 95.97%, sensitivity of 85.59%, specificity of 77.22%, precision of 90.35%, F1-Measure of 85.00%, and ρ-value of 9.81%.
By introducing a dropout mechanism and a dense layer with an appropriate activation function, EfficientNet provides better results regarding evaluation measures. It achieves accuracy, sensitivity, specificity, precision, F1-Measure, and ρ-value with 95.03%, 95.50%, 79.47%, 91.23%, 86.80%, and 9.81%, respectively. From the empirical results, it is clear that the ResCAM realizes 98.90% accuracy, 97.1% sensitivity, 85.80% specificity, 92.70% precision, and 93.60% F1-measure. Besides, it achieves a reduced ρ-value (i.e., 0.5%) which designates that the results of ResCAM are significant.
Table 10. SD value of evaluation metrics achieved by different DR detection models
|
Algorithm |
ACC (%) |
SEN (%) |
SPE (%) |
PRE (%) |
F1-M (%) |
ρ-value (%) |
|
DenseNet-201 |
4.74 |
7.64 |
4.51 |
4.40 |
4.22 |
1.11 |
|
Inception-V3 |
3.93 |
5.76 |
3.15 |
4.25 |
4.02 |
2.03 |
|
VGG-19 |
9.17 |
8.37 |
4.53 |
4.22 |
5.98 |
1.28 |
|
AlexNet |
5.09 |
4.79 |
4.11 |
3.54 |
2.73 |
10.09 |
|
ResNet |
1.62 |
4.40 |
3.05 |
4.15 |
3.30 |
7.77 |
|
MobileNet-V3 |
1.65 |
4.98 |
2.97 |
2.62 |
3.21 |
8.33 |
|
EfficientNet |
2.02 |
1.35 |
3.95 |
2.48 |
2.15 |
8.11 |
|
ResCAM |
0.98 |
0.95 |
2.84 |
1.64 |
1.66 |
0.47 |
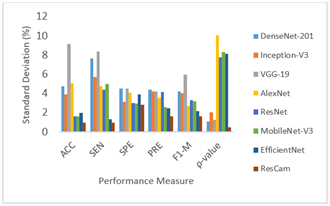
ResCAM produces the lowest SD values in the classification task with 1.0% accuracy, 0.9% sensitivity, 2.8% specificity, 1.6% precision, 1.7% F1-measure, and 0.5% ρ-value. The SD value of performance measures gained from the APTOS-2019 database by each DR classification network is listed in Table 10. From Figure 11, it is clear that the SD of the ResCAM is less than other retinopathy detection models. Hence, the ResCAM generates much more reliable results for classifying DR as compared with the other models. Therefore, ResCAM is considered a very feasible model for classifying diabetic retinal disease in the medical industry.
Figure 12. Results of various DR detection models regarding SD values
DR is the leading cause of irreversible vision impairment among diabetic patients. Automatic DR recognition supports medical professionals in planning personalized treatments for patients. Therefore, it is of primary importance in clinical practice. Deep networks perform a vital role in recognizing DR stages and decrease the human effort to identify and decide whether patients are in any of the stages of retinopathy. The main goal of this study is to develop a deep learning model, known as ResCAM for automatic and accurate classification of retinopathy. The proposed ResCAM employs Res3DNet and CAM modules to excerpt the attributes and classify fundus images accurately. By executing CAM, the ResCAM learns the semantic features of DR stages, like microaneurysms, hemorrhage, hard exudates, and soft exudates, efficiently. Also, this model reduces the number of models hyperparameters considerably. As a result, this model is lighter and easier to train. Our ResCAM is developed with suitable preprocessing and data augmentation techniques and evaluated using the APTOS-2019 database. ResCAM achieves performance improvement with 98.90% accuracy, 97.1% sensitivity, 85.80% specificity, 92.70% precision, and 93.60% F1 measure. Besides, it achieves a reduced ρ-value (i.e., 0.5%) which designates that the results of ResCAM are significant. Furthermore, ResCAM produces the lowest SD values in the classification task with 1.0% accuracy, 0.9% sensitivity, 2.8% specificity, 1.6% precision, 1.7% F1-measure, and 0.5% ρ-value. Moreover, it is proved that the proposed network has realized better classification performance as compared with some cutting-edge retinopathy identification networks. In future work, we plan to generate and validate CAM-based attention heatmaps in collaboration with ophthalmologists to enhance the interpretability and clinical trust of the proposed model.
[1] Szymanska, M., Mahmood, D., Yap, T.E., Cordeiro, M.F. (2021). Recent advancements in the medical treatment of diabetic retinal disease. International Journal of Molecular Sciences, 22(17): 9441. https://doi.org/10.3390/ijms22179441
[2] Hossain, M.J., Al-Mamun, M., Islam, R.R. (2024). Diabetes mellitus, the fastest growing global public health concern: Early detection should be focused. Health Science Reports, 7(3): e2004. https://doi.org/10.1002/hsr2.2004
[3] Das, U., Kar, N. (2023). Prevalence and risk factor of diabetes among the elderly people in West Bengal: Evidence-based LASI 1st wave. BMC Endocrine Disorders, 23(1): 170. https://doi.org/10.1186/s12902-023-01421-3
[4] Tăbăcaru, G., Moldovanu, S., Răducan, E., Barbu, M. (2024). A robust machine learning model for diabetic retinopathy classification. Journal of Imaging, 10(1): 8. https://doi.org/10.3390/jimaging10010008
[5] Salazar, J., Angarita, L., Morillo, V., Navarro, C., et al. (2020). Microbiota and diabetes mellitus: Role of lipid mediators. Nutrients, 12(10): 3039. https://doi.org/10.3390/nu12103039
[6] Yang, Z., Tan, T.E., Shao, Y., Wong, T.Y., Li, X. (2022). Classification of diabetic retinopathy: Past, present and future. Frontiers in Endocrinology, 13: 1079217. https://doi.org/10.3389/fendo.2022.1079217
[7] Kropp, M., Golubnitschaja, O., Mazurakova, A., Koklesova, L., et al. (2023). Diabetic retinopathy as the leading cause of blindness and early predictor of cascading complications—Risks and mitigation. EPMA Journal, 14(1): 21-42. https://doi.org/10.1007/s13167-023-00314-8
[8] Bhulakshmi, D., Rajput, D.S. (2024). A systematic review on diabetic retinopathy detection and classification based on deep learning techniques using fundus images. PeerJ Computer Science, 10: e1947. https://doi.org/10.7717/peerj-cs.1947
[9] Ansari, P., Tabasumma, N., Snigdha, N. N., Siam, N. H., et al. (2022). Diabetic retinopathy: An overview on mechanisms, pathophysiology and pharmacotherapy. Diabetology, 3(1): 159-175. https://doi.org/10.3390/diabetology3010011
[10] Ahmed, S.F., Alam, M.S.B., Hassan, M., Rozbu, M.R., et al. (2023). Deep learning modelling techniques: current progress, applications, advantages, and challenges. Artificial Intelligence Review, 56(11): 13521-13617. https://doi.org/10.1007/s10462-023-10466-8
[11] Munappy, A.R., Bosch, J., Holmström Olsson, H., Arpteg, A., Brinne, B. (2022). Data management for production quality deep learning models: Challenges and solutions. Journal of Systems and Software, 191: 111359. https://doi.org/10.1016/j.jss.2022.111359
[12] Akhtar, S., Aftab, S., Ali, O., Ahmad, M., Khan, M.A., Abbas, S., Ghazal, T.M. (2025). A deep learning based model for diabetic retinopathy grading. Scientific Reports, 15(1): 3763. https://doi.org/10.1038/s41598-025-87171-9
[13] Das, D., Biswas, S.K., Bandyopadhyay, S. (2023). Detection of diabetic retinopathy using convolutional neural networks for feature extraction and classification (DRFEC). Multimedia Tools and Applications, 82(19): 29943-30001. https://doi.org/10.1007/s11042-022-14165-4
[14] Khan, T.M., Mehmood, M., Naqvi, S.S., Butt, M.F.U. (2020). A region growing and local adaptive thresholding-based optic disc detection. PLoS One, 15(1): e0227566. https://doi.org/10.1371/journal.pone.0227566
[15] Rêgo, S., Dutra-Medeiros, M., Soares, F., Monteiro-Soares, M. (2021). Screening for diabetic retinopathy using an automated diagnostic system based on deep learning: Diagnostic accuracy assessment. Ophthalmologica, 244(3): 250-257. https://doi.org/10.1159/000512638
[16] Maqsood, S., Damaševičius, R., Maskeliūnas, R. (2021). Hemorrhage detection based on 3D CNN deep learning framework and feature fusion for evaluating retinal abnormality in diabetic patients. Sensors, 21(11): 3865. https://doi.org/10.3390/s21113865
[17] Fayyaz, A.M., Sharif, M.I., Azam, S., Karim, A., El-Den, J. (2023). Analysis of diabetic retinopathy (DR) based on the deep learning. Information, 14(1): 30. https://doi.org/10.3390/info14010030
[18] Jiang, H., Yang, K., Gao, M., Zhang, D., Ma, H., Qian, W. (2019). An interpretable ensemble deep learning model for diabetic retinopathy disease classification. In 2019 41st Annual International Conference of the IEEE Engineering in Medicine and Biology Society (EMBC), Berlin, Germany, pp. 2045-2048. https://doi.org/10.1109/EMBC.2019.8857160
[19] Yaqoob, M.K., Ali, S.F., Bilal, M., Hanif, M.S., Al-Saggaf, U.M. (2021). ResNet-based deep features and random forest classifier for diabetic retinopathy detection. Sensors, 21(11): 3883. https://doi.org/10.3390/s21113883
[20] Wahab Sait, A.R. (2023). A lightweight diabetic retinopathy detection model using a deep-learning technique. Diagnostics, 13(19): 3120. https://doi.org/10.3390/diagnostics13193120
[21] Liu, H., Yue, K., Cheng, S., Pan, C., Sun, J., Li, W. (2020). Hybrid model structure for diabetic retinopathy classification. Journal of Healthcare Engineering, 2020(1): 8840174. https://doi.org/10.1155/2020/8840174
[22] Qian, Z., Wu, C., Chen, H., Chen, M. (2021). Diabetic retinopathy grading using attention based convolution neural network. In 2021 IEEE 5th Advanced Information Technology, Electronic and Automation Control Conference (IAEAC), Chongqing, China, pp. 2652-2655. https://doi.org/10.1109/IAEAC50856.2021.9390963
[23] He, A., Li, T., Li, N., Wang, K., Fu, H. (2020). CABNet: Category attention block for imbalanced diabetic retinopathy grading. IEEE Transactions on Medical Imaging, 40(1): 143-153. https://doi.org/10.1109/TMI.2020.3023463
[24] Al-Antary, M.T., Arafa, Y. (2021). Multi-scale attention network for diabetic retinopathy classification. IEEE Access, 9: 54190-54200. http://doi.org/10.1109/ACCESS.2021.3070685
[25] Jiang, L., Li, W., Xiong, Z., Yuan, G., et al. (2024). Retinal vessel segmentation based on self-attention feature selection. Electronics, 13(17): 3514. https://doi.org/10.3390/electronics13173514
[26] Yilmaz, A., Poli, R. (2022). Successfully and efficiently training deep multi-layer perceptrons with logistic activation function simply requires initializing the weights with an appropriate negative mean. Neural Networks, 153: 87-103. https://doi.org/10.1016/j.neunet.2022.05.030
[27] Malhi, A., Grewal, R., Pannu, H. S. (2023). Detection and diabetic retinopathy grading using digital retinal images. International Journal of Intelligent Robotics and Applications, 7(2): 426-458. https://doi.org/10.1007/s41315-022-00269-5
[28] APTOS Dataset. APTOS 2019 Blindness Detection. https://www.kaggle.com/c/aptos2019-blindness-detection, accessed on Sep. 22, 2023.
[29] Ali, M.S., Miah, M.S., Haque, J., Rahman, M.M., Islam, M.K. (2021). An enhanced technique of skin cancer classification using deep convolutional neural network with transfer learning models. Machine Learning with Applications, 5: 100036. https://doi.org/10.1016/j.mlwa.2021.100036
[30] Graham, B. (2015). Kaggle diabetic retinopathy detection competition report. University of Warwick.
[31] Wu, J., Zhang, S., Xiao, Z., Zhang, F., Geng, L., Lou, S., Liu, M. (2019). Hemorrhage detection in fundus image based on 2D Gaussian fitting and human visual characteristics. Optics and Laser Technology, 110: 69-77. https://doi.org/10.1016/j.optlastec.2018.07.049
[32] Yang, Y., Li, T., Li, W., Wu, H., Fan, W., Zhang, W. (2017). Lesion detection and grading of diabetic retinopathy via two-stages deep convolutional neural networks. In International Conference on Medical Image Computing and Computer-Assisted Intervention, pp. 533-540. https://doi.org/10.1007/978-3-319-66179-7_61
[33] Sathiya, V., Nagalakshmi, K., Jeevamalar, J., Babu, R., et al. (2023). Reshaping healthcare supply chain using chain-of-things technology and key lessons experienced from COVID-19 pandemic. Socio-Economic Planning Sciences, 85: 101510. https://doi.org/10.1016/j.seps.2023.101510
[34] Derrac, J., García, S., Molina, D., Herrera, F. (2011). A practical tutorial on the use of nonparametric statistical tests as a methodology for comparing evolutionary and swarm intelligence algorithms. Swarm and Evolutionary Computation, 1(1): 3-18. https://doi.org/10.1016/j.swevo.2011.02.002