Devanshu Tiwari![]() | Anand Jha
| Anand Jha![]() | Mohammad Tauheed Ahmad*
| Mohammad Tauheed Ahmad*![]() | Kirti Raj Bhatele
| Kirti Raj Bhatele![]() | Manish Dixit
| Manish Dixit![]()
© 2025 The authors. This article is published by IIETA and is licensed under the CC BY 4.0 license (http://creativecommons.org/licenses/by/4.0/).
OPEN ACCESS
A novel hybrid transfer learning approach called as “CovVoxTrada” was proposed for the COVID-19 positive patient’s detection utilizing X-rays of Chest and CT scans. The CovVoxTrada is a hybrid model/approach which uses Voxnet and TraDaBoost models. Besides chest X-rays, this study also uses CT scans since CT’s proved to be more reliable and accurate in identifying COVID-19 positive patients globally. The CT scan dataset was collected locally at Sanya MRI and CT scan center in Jabalpur, MP, India, while global chest X-rays dataset are also used. This hybrid approach, initially trains VoxNet model for feature extraction and then these features are employed for the training of the TraDaBoost model for performing binary classification. This study also illustrates the brief performance comparison in between the proposed model and additional widely used deep transfer learning models such as InceptionV3, VGG19, ResNet50 VGG16, YoloV9, which are trained on both the datasets. The CovVoxTrada yields 97% and 94.55% accuracy across the two datasets outperforming other hybrid and transfer learning architectures.
COVID-19, VoxNet, deep learning, deep transfer learning, YoloV9, CT scan, chest X rays, image classification.
The world has gone through a tough time due to COVID-19, which is an infectious illness. This infectious illness is caused by SARS-CoV-2 (severe acute respiratory syndrome coronavirus 2). On March Eleventh 2020, the World Health Organization (WHO) classified COVID-19 illness as an epidemic. COVID-19 transmitted through respiratory droplets larger than 5-10µm in dimension that spreads through airborne transmission [1]. This accounts for faster spread of COVID-19 leading to a mortality rate of 2-5% [2]. It is well known fact that COVID-19 cases rise with geometric progression which depicts the sternness of the situation. The COVID-19 cases rises 1000 times in just one month, from 41 on 11th Jan 2020 to 43,109 on 11th Feb 2020. COVID-19 exhibits this high growth rate even when people are taking measures like using masks and social distancing. Mass consciousness leads to a drop in growth factor but resuming normal life activities across the world requires curbing COVID-19 pandemic. Prompt diagnosis of infections is crucial to restrain further spread of COVID-19. Real-Time PCR [3-5] is a well-known diagnostic test for COVID-19 detection; however, it is time-consuming as well. In the present time especially in India, the Covid 19 positive cases are again increasing. So this approach will going to be useful in the future also as it seems like, the Covid 19 will remain in the world and keep on mutating just like other infectious diseases.
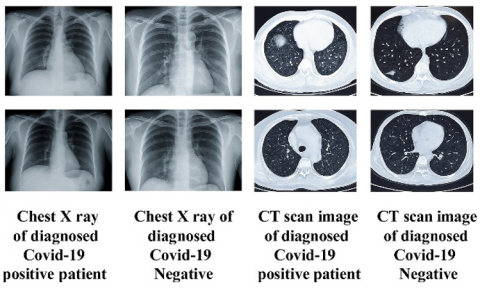
Artificial intelligence with clinical scans can be handy for speedy detection of patients suffering from COVID-19. Numerous recent researches establishes that deep learning (DL) can be suitable for recognizing lung irregularities correlated with COVID-19. Hence, Deep Learning (DL) architectures can be handy to clinicians to make a decision about the degree of complexities and speedy classification of COVID-19 patients using chest X-rays [6-8]. This is possible due to fact that DL can explore patterns in clinical scans like Computed Tomography (CT) and X rays of chest, which are normally missed by radiologists [9-12]. The DL based pathological findings on the clinical image can become a criterion for the clinical opinions such as discharging or conducting additional examination on the patient. The Figure 1 illustrates the CT scans and X-rays of chest of both positive COVID-19 patients and healthy volunteers.
Figure 1. Chest imaging (CT and X-rays) of COVID-19 patients compared with healthy volunteers
Deep Learning (DL) tries to work the way human brain works. The DL become most common technique in Artificial Intelligence (AI) and Big Data analysis due its capabilities such as working with unlabeled data, without feature engineering and significant accuracy [13, 14].
That's why DL has been immensely deployed in the fields such as autonomous vehicles, face detection, object recognition, classification of images etc. [15]. A DL algorithm called CNN (Convolutional Neural Network) is particularly useful in document analysis, recognizing actions, pose recognition, image classification [16, 17]. Hence, recently deep learning algorithms grounded on CNN have grown considerably [18-20]. CNN is more appropriate than any other algorithm for object detection and image classification due to: (1) extort and classify the features from images (2) its self-optimizing property, (2) precise results and (3) less pre-processing of the input data.
Various CNN models like Alexnet, ZFNet, VGGNet have been applied for image classification [21-23]. CNN has been used hugely for disease or anomaly detection [24, 25], such as Coronary Artery Disease (CAD) and Parkinson’s illness using electroencephalogram (EEG) signals [26-28] etc. Many CNN models for the classification of dental clinical images, discovering skin ailments, investigation of Alzheimer’s illness and lots of other diseases have already been proposed by existing research works [29-31]. The mentioned applications of CNN, makes it an obvious algorithm for COVID-19 screening using clinical images. The DL architectures can also be used together with conventional advance machine learning (ML) classifiers to build better hybrid classification frameworks for COVID-19 detection.
Exploring such avenues of hybrid architectures for classification of COVID-19 is primary impetus of this study. Principal contributions of this research work are as follows:
(1) Develop a novel CovVoxTrada (hybrid model), grounded on ensemble learning (EL) and deep transfer learning (DTL) for detecting COVID-19 positive cases.
(2) Implemented VoxNet model for feature extraction along with other conventional machine and ensemble learning models for COVID-19 classification.
(3) Also implemented five mostly utilized DTL models-ResNet50, InceptionV3, VGG16, Yolov9, VGG19 on both the datasets-(1) CT scan (Local) dataset and (2) Global Chest X-rays.
(4) Unlike most existing studies that rely solely on global X-ray (chest) datasets, this research is the first to train and evaluate the proposed CovVoxTrada framework using a locally collected COVID-19 CT scan dataset from India.
This study is structured into 05 distinct sections. The initial section illustrates brief overview about the COVID-19 infection and emphasizing the significance of ML techniques in its detection. The section 2 highlights some of the current and emerging ML based approaches employed for COVID-19 identification. The section 3 illustrates datasets description along with the proposed methodology. The 4 and 5 sections detail and discuss simulation outcomes to highlight the performance of the proposed framework.
Extensive research studies focus on detecting COVID-19 positive cases through chest X-ray images is done worldwide. Some researchers have also proposed DL based approaches for categorization of images (X-rays) of chest alongside CT scans. Narin et al. built models employing 3 pre-trained CNN models-InceptionV3, ResNet-50 & Inception-ResNetV2 to recognize COVID-19 within chest X-ray scans [32]. Their models were trained with 100 X-ray scans of chest (50 healthy, 50 infected with COVID-19). In which InceptionV3 achieved 97% accuracy, Inception-ResNetV2 has an accuracy of 87% while ResNet50 has a higher accuracy of 98%. However, accuracy of models declines as the number of training images increase.
Another DL model for COVID-19 classification was proposed via X-rays (chest) by Zhang et al. [33]. In this model, 100 X-ray images (Chest) were considered out of which seventy scans are of COVID-19 and 30 scans are of patients suffering from pneumonia. One more DL model is by Hall et al. for recognizing patients (COVID-19) used a minor set of X-ray (chest) images [34]. The accuracy of this model is 89.2% and it is based on a ResNet50 model. Sethy and Behera have also proposed a model built on ResNet50 together with SVM leading to accuracy i.e. 95.38% and F1-score i.e. 91.41% for detection of COVID-19 [35]. The research study of Apostolopoulos and Mpesiana [36] developed used transfer learning based on CNN for classification of COVID-19 patients from chest X-rays [36]. They carried out their work considering 504 normal images, 224 X-ray scans (chest) from COVID-19 patients and 714 from pneumonia cases to train the model and their model delivered 96.78% accuracy, specificity of 96.46% and 98.66% sensitivity. Li et al. [37] considered chest CT scans for COVID-19 detection through the established CNN model, COVNet and achieved 90% sensitivity, 96% specificity and 0.96 AUC (Area under the Receiver Operative Curve). A model built on CNN-LSTM delivered an overall 99.4% accuracy, 98.90 % F1-score using a total of 1525 images per group (Pneumonia, normal and COVID-19) [38]. Only 25 X-ray images (chest) were used by a DL model called COVIDX-Net to classify them as normal and COVID-19 by Hemdan et al. [39]. To validate their DarkCovidNet model, Ozturk et al. [40] considered 27 cases of positive COVID-19 X-ray scans (chest) and 500 normal images. Their architecture was Darknet-19 based for multi-class as well as binary classification. Their model achieves around 98 % and 87 % accuracy for classification i.e. binary besides multi-class classification. Bayes-SqueezeNet is trained via Bayesian optimization and enhanced with offline raw data augmentation for chest X-ray based positive COVID-19 detection. Bayes-SqueezeNet performs classification across 3 distinct labels: Normal, Viral Pneumonia, and COVID-19 [41].
The CoroNet [42], another CNN built on Xception [43] after adding dropout layer as well as integration of 2 fully connected layers at the final layer of the model for COVID-19 classification from X-rays (chest). The CoroNet was capable of performing two types of classification. The CoroNet can perform a 3-category classification - Positive COVID-19, Normal and Pneumonia. It can also do 4-category classification (positive COVID-19, healthy, normal, bacterial & viral pneumonia). Another approach for recognizing positive COVID-19 cases i.e. CovidGAN [44] was built using the Generative Adversarial Network (GAN) as a base. CovidGAN architecture was grounded on top of the pre-trained VGG-16 [23], with 04 custom layers are placed at the end which is stacked by the dense layer with 64 units and a 0.5 dropout layer. A YoloV8 based approach [45] was proposed for the effective Covid19 positive cases screening. This framework along with other i.e. InceptionV3, DenseNet, ResNet models are trained with the aid of a large size dataset. This dataset consists of synthetic images. The synthetic images were generated employing Feature Interpolation dependent on Linear Mapping and Principal component analysis (PCA). The generated synthetic images enhance diversity in dataset as well as maintain class balance. This proposed approach achieves an accuracy of 97% and model explainability is attained through Grad-CAM.
The ensemble or hybrid models for medical image identification, combine the strengths of ML and DL methods to boost robustness as well as accuracy in medical image analysis. Ensemble models enhance classification by aggregating predictions from multiple independent models, ensuring greater reliability. These models leverage diverse algorithms or variations of the same algorithm to generate independent predictions, which are then combined using voting mechanisms like majority voting or weighted averaging.
In contrast, hybrid models integrate multiple machine learning techniques within a single framework, enabling deeper interaction and synergy between methods. By combining distinct approaches, such as symbolic and sub-symbolic learning, hybrid models enhance classification performance by refining feature extraction and decision-making. Unlike ensembles that merge independent predictions, hybrid models create a unified system where different techniques work together, making them highly effective for complex classification tasks. Since it’s a novel concept, so some of the recent researches based on this concept are as follows:
The previous study [46] proposes a computational scheme that defines hybrid models by combining an ensemble classifier and deep features obtained through transfer learning. These models were used to categorize histological images of breast, colorectal, and liver tissue. Notably, the best hybrid models achieved 98.00% & 99.32% accuracy, particularly excelling in breast cancer histological images. These models outperformed standardized techniques and classic CNN designs, even when working with augmented datasets. Then another research [47] focuses on utilizing ensemble learning for optimizing medical image classification. The authors present a medical image classification pipeline designed for reproducibility, examining how ensemble learning methods such as stacking, augmenting and bagging impact performance. The pipeline incorporates advanced image preprocessing alongside augmentation techniques and nine deep convolutional neural network architectures
Then a study [48] presents an ensemble-driven multi-tissue approach using a novel hybrid deep learning framework for CRC tissue classification. The method is applied to colorectal cancer histopathology images. The hybrid model significantly improves classification performance, attaining accuracy of 98% and 99% approx. on CRC datasets, while offering meaningful insights for clinical application. Additionally, this approach surpasses existing modern techniques in both computational efficacy and processing time. Another recently proposed hybrid approach enables efficient and truthful pneumonia in detection in chest X-rays, with a CNN for classification and YOLO for localization achieving high accuracy (training: 0.968, validation: 0.83, F1-score: 0.819). This approach reduces diagnostic time and enhances accessibility, particularly in resource-limited healthcare settings [49].
The proposed hybrid model is unique and distinct from the previously mentioned and existing hybrid models, as it effectively addresses the gaps identified in prior research.
1) Existing researches do not use locally collected dataset for training neither for testing.
2) Existing researches do not use proposed hybrid approach. Our hybrid approach uses DL for feature extraction and then ensemble learning classifiers for COVID-19 classification.
3) Besides hybrid approach, this study also proposes a novel comparison approach to compare proposed CovVoxTrada to five widely used Deep transfer learning models.
4) A comparative framework is introduced to assess the performance of the CovVoxTrada model against five widely used DTL models i.e. ResNet50, InceptionV3, VGG19, YoloV9 and VGG16 across two datasets: (1) Local CT scans and (2) Global Chest X-rays.
This study offers a novel hybrid approach called CovVoxTrada. The hybrid approach uses DL for extraction of features and then EL classifiers for classification of Infectious COVID-19. The hybrid approach implements VoxNet model for extraction of features and TraDaBoost model for labeling. The VoxNet is employed to extract deep, domain-specific features from scans i.e. X-rays & CT scans (chest) of infected cases from COVID-19. These extracted features are subsequently applied to train the TraDaBoost classifier for binary labeling of COVID-19. Additionally, this research contrasts the effectiveness of the suggested model with established DTL models, including InceptionV3, VGG19, Yolo V9, ResNet50, and VGG16, across both datasets.
The presented study has used VoxNet for feature extraction instead of CNN. Convolutional Neural Networks (CNNs) are deep supervised architectures primarily designed for image classification. They excel at categorizing images into predefined classes. The CNNs are composed of several layers, among which convolutional layers play a key role. These layers utilize filters (kernels) to examine localized regions of the input image, enabling the identification of underlying patterns and extraction of critical features. The extracted features serve as building blocks for understanding the image content. CNNs exhibit good performance and high generalizability, meaning they perform well not only on known training data but also on unseen test data.
Unlike CNNs, which operate on 2D images, VoxNet processes 3D data directly. VoxNet combines 3D convolutional layers with fully connected layers. Hence, it can easily deep features and learns spatial features from the entire volume during training.
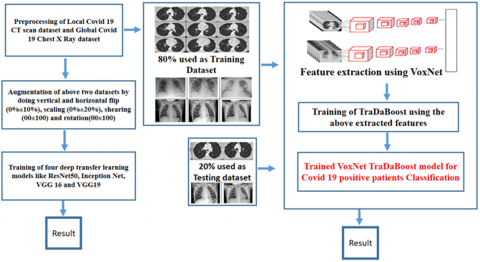
The proposed approach majorly consist of three phases as preprocessing as well as feature extraction using VoxNet model, then training of the TraDaBoost model using the extracted features on the actual two datasets. Whereas the comparison approach consist of preprocessing, augmentation and training of 4 DTL models. The Figure 2 demonstrates the overall methodology adopted in this research study:
Figure 2. Workflow of the CovVoxTrada method for detecting COVID-19 from X-ray and CT (chest)
3.1 Datasets
The Global dataset of Chest X-rays and Local COVID-29 CT scan dataset are the two datasets used in this research study.
COVID-19 CT scan dataset (Local): The dataset comprises chest axial CT volume images from both COVID-19 (infected) cases and healthy individuals. These scans were acquired at the Madhya Pradesh CT scan & MRI Center in Jabalpur using the Optima GE CT 660 scanner. This 64-slice system, designed for advanced imaging such as coronary and cardiac angiography, features a Forty mm V-Res (detector) and a Performix Forty tube (6.3 MHU). The scanner captures up to 64 slices per 360° gantry rotation, enabling high-resolution axial imaging. In total, eighty-six COVID-19 positive patients contributed 2,080 CT scans. The average age of patients was 49.5 ± 19.1 years (ranging from 16 to 88 years), including thirty female and 56 male participants. Additionally, scans from 88 healthy individuals were collected, averaging 41.5 ± 16.8 years in age (ranging from 12 to 81 years), with 48 male and 40 female volunteers. The cases in question were gathered between July 2020 and January 2021. Cough and fever were these patients' primary clinical symptoms. The CT scan data, available in DICOM format with Sixteen-bit grayscale and 512 × 512 resolution, is later converted into format (PNG).
Chest X ray dataset (Global): Due to the limited size of currently accessible COVID-19 datasets, global chest X-ray dataset are explored to create a dataset which large as well as diverse. The X-ray scans (chest) of both infected COVID-19 cases and healthy individuals were sourced from 03 publicly available datasets to construct a balanced and. sufficiently large dataset. Dr. Joseph Cohen has taken about Five hundred COVID-19 X-ray images (Chest) and five hundred regular imageries from the repository of GitHub [50]. The COVID-19 Radiography Database [51] is then utilized to extract 280 normal images and 220 infected COVID-19. Then using the IEEE8023/Covid Chest X-ray Dataset [52], about two hundred ninety COVID-19 infected images and two hundred eighty normal cases scans are extracted. Total 2070 X-ray images (chest) make up the entire dataset, which is further separated into a testing as well as training sub-datasets. After augmentation, this number is further increased. With the aid of Table 1 below, the count of images employed for training and testing in different datasets is demonstrated.
Table 1. The segregation of images used for the proposed hybrid model's COVID-19 classification testing & training
| Datasets | Training Dataset | Testing Dataset | ||
| Infected by COVID-19 | Healthy | Healthy | Infected by Covid 19 | |
| CT Scan (Local) | 900 | 980 | 100 | 100 |
| Chest X-ray (Global) | 910 | 960 | 100 | 100 |
| After Augmentation using the four affine transformation | ||||
| CT Scan (Local) | 64800 | 71280 | 200 | 200 |
| Chest X-ray (Global) | 65610 | 69660 | 200 | 200 |
3.2 Preprocessing and augmentation
In this stage, all the images in the dataset are preprocessed and augmented. Since these images are obtained from various medical machines and mostly contain medical symbols, image artifacts etc., so it is imperative to these medical images to undergone resizing as well as cropping. The input image size is changed to 64-by-64-by 3 for the Hybrid Voxnet TraDaBoost model and 224-by-224-by 3 or 299-by-299-by 3 for the comparison purpose models (deep transfer learning).
The size of the above two datasets are quite adequate to train as well as assess performance of the proposed hybrid framework based on VoxNet and TraDaBoost. But the aforementioned two datasets need to be enhanced in order to train and assess DTL models like InceptionV3, VGG 19, ResNet50, VGG16, and YoloV9. The augmentation techniques employed in this work include affine transformations made up of rotation (00 ± 100), scaling (0% ± 20%), shearing (00 ± 100 %), and vertical and horizontal flip (0% ± 10%). The training and validation split is of 80/20 is used during implementation.
3.3 Proposed approach based on hybrid VoxNet TraDaBoost model
The presented framework to detect infected COVID-19 cases is a 2 – step process. In 1st step, feature maps are obtained from the X ray & CT (Chest) scans using the VoxNet model. Then these mined feature maps are used to train TraDaBoost classifier in 2nd step. Initially the proposed framework is trained with both datasets in actual form i.e. without augmentation and then it is trained with the augmented datasets for the sake of experimentation. The VoxNet architecture as well as the TraDaBoost classifier used in the proposed approach are explained in this section. The algorithm 1 of the suggested hybrid framework for the positive COVID-19 cases detection is given as:
|
Algorithm 1 (Proposed approach) |
|
Input: Images of infected COVID-19 cases chest (X-ray and CT) and healthy controls (CT and X-ray) Output: The trained hybrid VoxNet TraDaBoost framework for detecting infected COVID-19 cases. Steps:
|
To enhance generalization, the study employed a hybrid dataset comprising locally collected CT scans and globally sourced X-ray images, thereby introducing geographical and clinical heterogeneity across demographics, disease severity, imaging protocols, and equipment variations. While the global X-ray dataset included images from multiple machines with varying resolutions, the local CT scans were comparatively uniform, and images were carefully curated from three global repositories to address potential class imbalance, as outlined in Table 1. To reconcile the challenges of combining modalities, a late-stage feature fusion approach was adopted: convolutional layers independently extracted high-level, modality-specific features, enabling the model to capture CT-specific textural and density variations alongside the broader structural patterns in X-rays.
3.3.1 Feature extraction using the VoxNet architecture
Maturana and Scherer [53] initially transformed the ShapeNet into the VoxNet. The architecture begins with an input layer, followed by three convolutional layers, a pooling layer, a fully connected layer, and finally an output layer. A grid of size 64 × 64 × 64 voxels is required for the input layer. Occupancy mode specifies how the value of an individual grid cell is defined, which is reorganized as follows: 'One' for occupied or 'Zero' otherwise. The three layers (convolutional) receive a 4-dimesional input. The 4-dimensioal input consists of 3 spatial dimensions and the fourth one holds feature values. In order to generate new feature values, the three convolutional layers convolve the input with thirty two filters in each layer. The pooling layer reduces the dimensionality of the convolutional output using a 2 × 2 × 2 window. The fully connected layer consists of 128 neurons, each formed as a weighted combination of the features obtained from the pooling layer. The probabilistic output is created using the a softmax non-linear model and ReLU function. Each output corresponds to a distinct class label, resulting in an output dimensionality equal to the count of class labels L. The VoxNet architecture is presented with the aid of Figure 3.
Figure 3. The VoxNet's COVID-19 deep feature extraction architecture
3.3.2 Binary classification using the TraDaBoost classifier
The TrAdaBoost algorithm’s computational complexity is low. By modifying the weights of samples from the source and target domains, TrAdaBoost achieves its adaptive boosting process. The model operates under the premise that source domain errors are closer in distribution to the target data compared to correctly predicted instances. This is because these incorrect instances are considered unrelated to the source domain's distribution. TrAdaBoost retains the original AdaBoost weight updating strategy for instances from the target domain. However, when incorporating training data from the source domain, it attenuates the influence of misclassified instances by applying a predetermined multiplicative factor to reduce their weights, thereby reducing their impact on subsequent iterations.
$x_{i}^{y+1}=\left\{ x_{i}^{y}.{{\delta }^{D\left( {{h}_{y}}\left( {{a}_{i}} \right)\ne b\left( {{a}_{i}} \right) \right)}},~1\le i\le p~x_{i}^{y}.{{\delta }_{y}}^{D\left( {{h}_{y}}\left( {{a}_{i}} \right)\ne b\left( {{a}_{i}} \right) \right)},~p+1\le i\le p+r \right\}$ (1)
where, D is defined as below and known as indicator function
$D\left( {{h}_{y}}\left( {{a}_{i}} \right)\ne b\left( {{a}_{i}} \right) \right)=\left\{ 1,~if~{{h}_{y}}\left( {{a}_{i}} \right)\ne b\left( {{a}_{i}} \right)~0,~if~{{h}_{y}}\left( {{a}_{i}} \right)=b\left( {{a}_{i}} \right) \right\}$ (2)
In this context, r denotes samples from source, p denotes samples from target. The term $x_{i}^{y}$ specifies the weight of the ith sample at yth iteration. Term ai represents the feature vector of ith sample mined from the VoxNet model trained, $b\left( {{a}_{i}} \right)$ denotes the ground truth label,$~{{h}_{y}}\left( {{a}_{i}} \right)$ and indicates the predicted label. The multiplier for source sample data can be defined as δ=1⁄((1+√(2lrp/R))) where R denotes the total count of iterations. The multiplier δy is given as δy$=\left( 1-{{\epsilon }_{y}} \right)/{{\epsilon }_{y}}$ for target samples, where ${{\epsilon }_{y}}$ is the overall error of hy on all target data samples for the iteration y. These multipliers are for classification of binary type and have a max. Total error of 0.5. They upsurge the weightiness of incorrectly predicted target data samples and reduce the weight of incorrectly predicted (source data samples). This way appropriate weights of correctly predicted samples from both domains are maintained. For the better binary classification, this weight updating mechanism is augmented by adopting the forward stage-wise additive modelling of SAMME [54] that uses a loss function (exponential):
$x_{i}^{y+1}=\left\{ x_{i}^{y}.{{e}^{-\frac{L-1}{L}{{\rho }_{y}}}},~if~{{h}_{y}}\left( {{a}_{i}} \right)\ne b\left( {{a}_{i}} \right)~x_{i}^{y}.{{e}^{\frac{1}{L}{{\rho }_{y}}}},~if~{{h}_{y}}\left( {{a}_{i}} \right)=b\left( {{a}_{i}} \right)\right\}$ (3)
Here, ${{\rho }_{y}}$ denotes weight updating parameter created on the basis of multiclass loss and defined as ${{\rho }_{y}}=\frac{log\left( 1-{{\epsilon }_{y}} \right)}{{{\epsilon }_{y}}}+loglog~\left( L-1 \right)~$where ${{\epsilon }_{y}}~$captures the cumulative error of the classifier ${{h}_{y}}$ over the entire sample set at iteration y and L refers to the number of distinct classes. In transfer learning, Eq. (3) enforces a steep decline in the weights of source instances that are classified correctly. To counteract the issue of weight drift, Al-Stouhi and Reddy [55] introduced an adaptive boosting framework for transfer learning. In this scheme, the relative weight balance between all source and target samples is preserved. This is accomplished using a correction factor Cy, generalized to cover L classes:
${{C}_{y}}=L\left( 1-{{\epsilon }_{y}} \right).~{{e}^{-\frac{L-1}{L}{{\rho }_{y}}}}$ (4)
where, ${{h}_{y}}~$overall error at iteration y on all target samples is denoted by the symbol ${{\epsilon }_{y}}$. After combining the target sample weight multipliers as shown in Eq. (3) as well as the source sample weight multipliers found in Eq. (1) adjusted using the factor of correction from Eq. (4). The weight update formulation is given as below:
$\begin{aligned} x_i^{y+1}=\left\{x_i^y \cdot L(1-\right. & \left.\epsilon_y\right) . e^{-\frac{L-1}{L} \rho_y}, \text { if } h_y\left(a_i\right)=b\left(a_i\right) 1 \leq i \\ & \leq p x_i^y . L(1 \left.-\epsilon_y\right) . e^{-\rho} e^{-\frac{L-1}{L} \rho_y}, \text { if } h_y\left(a_i\right) \\ & \neq b\left(a_i\right) 1 \leq i \\ & \leq p x_i^y . e^{-\frac{L-1}{L} \rho_y}, \text { if } h_y\left(a_i\right) \\ & =b\left(a_i\right) p+1 \leq i \\ & \leq p+r x_i^y . e^{\frac{1}{L} \rho_y}, \text { if } h_y\left(a_i\right) \\ & \left.\neq b\left(a_i\right) p+1 \leq i \leq p+r\right\}\end{aligned}$ (5)
where,$~\rho =log(\frac{1}{\left( 1+\sqrt{2lrp/R} \right)}$) and$~{{e}^{\rho }}=\delta $. The four equations represented by Eq. (5) can be condensed and expressed in a more concise manner by dividing them by ${{e}^{-\frac{L-1}{L}{{\rho }_{y}}}}$ and using the indicator function D as follows:
$x_{i}^{y+1}=\left\{ x_{i}^{y}.L\left( 1-{{\epsilon }_{y}} \right).~{{e}^{\rho .D({{h}_{y}}\left( {{a}_{i}} \right)\ne b\left( {{a}_{i}} \right))}},~1\le i\le p~x_{i}^{y}.{{e}^{{{\rho }_{y}}D({{h}_{y}}\left( {{a}_{i}} \right)\ne b\left( {{a}_{i}} \right))}},~if~{{h}_{y}}\left( {{a}_{i}} \right)=b\left( {{a}_{i}} \right)~p+1\le i\le p+r \right\}$ (6)
This weight-updating technique follows the principle of AdaBoost by aiming challenging samples. Its job is to increase the weight of inaccurately predicted target samples while retaining the weights of correctly predicted one’s constant. Weights assigned to misclassified source data points are reduced substantially, as their distribution does not align with the target set. The weight of correctly predicted source data samples is also moderately reduced, so they have less influence on the training process than the target samples. The TraDaBoost algorithm used in this study is as follows after incorporating the weight updating scheme mentioned above in the classification.
|
Algorithm 2 (TraDaBoost) |
|
Input: Source dataset Usrc with size p, unlabelled test dataset V, the maximum iteration count R, target dataset Utar with s samples and a chosen base learner. Output: The hypothesis $DD~\left( x \right)=argmax\underset{y=1}{\overset{R}{\mathop \sum }}\,{{\rho }_{y~}}.D\left( {{h}_{y}}\left( a \right)=g \right)$ Steps: the initial weight vector: x1=(x11, . . ., x1p+r). The initial values x1 as per the proportion of samples across the two datasets are specified by the user. For y=1, ….., R
${{h}_{y}}:X\to B$
${{\epsilon }_{y}}=\mathop{\sum }_{i=1}^{r}\frac{x_{i}^{y}.D\left( {{h}_{y}}\left( {{a}_{i}} \right)\ne b\left( {{a}_{i}} \right) \right)}{\mathop{\sum }_{i=1}^{r}x_{i}^{y}}$
$\rho =log(\frac{1}{\left( 1+\sqrt{2lrp/R} \right)}$)
End |
Any basic binary classifier could serve as the algorithm's base classifier learner. Decision trees were used as the foundational classifier (learner) in experiments. The ratio (weight) between each useful sample in the domain of source and each sample that was rightly classified in the domain (target) could theoretically vary greatly. During iterative updates, source domain positive samples that are properly predicted adjust L times more rapidly than those in the target domain, yet the aggregate weight ratio between source and target datasets stays constant. After numerous iterations, the source samples that were correctly projected will have the most weights, followed by the target samples that were incorrectly projected. The source samples that were incorrectly predicted will have higher weights than the target samples that were correctly projected will be lightest in weight. As a result, the weights of correctly projected target samples may end up being much higher compared to correctly projected source samples. In general, the source data should be given less weight than the target data. Empirical findings indicate that the correction factor $L\left( 1-{{\epsilon }_{y}} \right)$ in Eq. (5) to regulate the rise in weight values of the accurately projected samples (source), set to$2\left( 1-{{\epsilon }_{y}} \right)$. By doing so, negative transfer is mitigated, and the drift of weights toward the target data is decelerated.
The complexity of time for the proposed model is around O(n2). For each iteration of y i.e. for the steps 1-5, the time complexity is O(p+r) = O(r) where r is the no. of weights for the current iteration of y. At step-3, the algorithm iterates through each of the r data points to perform the necessary summations. Since the denominator is a constant value for the entire calculation, the formula in step-3 requires a single pass through the data to compute the weighted sum of errors. As the steps 1-5 are repeated R time, the algorithm complexity of time is O(rxR) = O(n2). The space (memory) complexity is O(r) since the p+r weights (x11, . . ., x1p+r) must be loaded into memory before the calculation begins. This approach can be efficiently implemented under resource-constrained conditions since both the time and space complexity is reasonable.
3.4 Comparison approach
In order to compare as well as to assess using the local CT scan dataset. As per the literature review, the four primarily used DTL models like ResNet50 [56], VGG16 [23], InceptionV3 [57], VGG19 [58] and YoloV9 [59]. The augmented CT scan (local) and X-ray (chest) datasets are used to train and fine-tune these five DTL models at first. This comparison is conducted to demonstrate the performance of frequently employed DTL models on both locally obtained CT scans and globally available chest COVID-19 X-ray datasets. The comparison approach's Algorithm 3 is described as follows:
|
Algorithm 3 |
|
Input: CT and chest radiographs (X-rays) from infected COVID-19 cases and non-infected subjects. Output: Well-tuned 4 DTL models and YoloV9 for infected COVID-19 cases classification or detection. Steps:
|
With the help of Table 2, the configurations for the 4 DTL models along with the YoloV9 are shown. A learning rate of 0.00001, 16 mini-batch size, and Adam [60] optimizer are used in training and validating these DTL models. Variations exist in input image size and the number of epochs needed for convergence across models, and dropout is incorporated to reduce over fitting risk.
Table 2. The settings for InceptionV3, ResNet50, VGG16, VGG19 and Yolov9
| Configurations Details (DTL) | VGG16 | VGG19 | InceptionV3 | ResNet50 | Yolov9 |
| Learning rate | 0.00001 | 0.00001 | 0.00001 | 0.00001 | 0.00001 |
| Momentum | 0.9 | 0.9 | 0.9 | 0.9 | 0.9 |
| Batch size | Sixteen | Sixteen | Sixteen | Sixteen | Sixteen |
| Number of Epochs to converge | Hundred | Hundred | Two hundred | Two hundred | Hundred |
| Optimizer | Adam | Adam | Adam | Adam | Stochastic Gradient Descent (SGD) |
| Number of layers | Sixteen | Nineteen | Forty Eight | Fifty | Nine hundred and sixty two |
| Input image size | 224*224 | 224*224 | 299*299 | 224*224 | 640×640 |
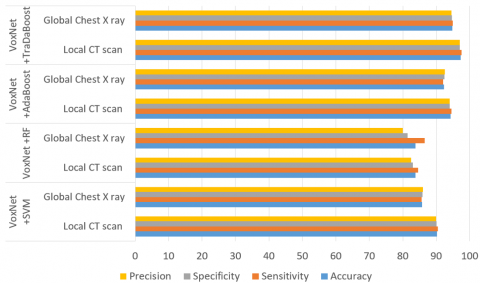
The experiments and simulations conducted in this study were implemented using Python 3.6 on the Google Colaboratory (Colab) platform. This result sections has two parts. The proposed hybrid model's performance is presented in the first section using a variety of statistical parameters or classification rates for both the CT scan as well as X-ray datasets (augmented and without augmentation). The second section simply illustrates the performance of 4 most often utilized DTL models on the augmented Local CT scan dataset as well as on the augmented Global chest X ray dataset. Several statistical and classification indicators are employed in this work, such as Accuracy, Sensitivity, Precision, Specificity, Negative Predictive Value, F1 Score, False Positive Rate, False Discovery Rate, and False Negative Rate. Their values for the proposed hybrid VoxNet TraDaBoost model performance on both the datasets are tabulated in Table 3. For the comparison purpose other conventional ML classifiers are used along with VoxNet model. This combination of VoxNet for extraction of feature along with classifiers like RF, SVM and AdaBoost did not give better performance as compare to our proposed VoxNet TraDaBoost model. Table 4 displays the evaluation metrics for both test datasets. Figure 4 depicts the comparative performance of the hybrid system (proposed) i.e. VoxNet TraDaBoost model with other VoxNet+SVM, VoxNet+RF and VoxNet+AdaBoost models.
Table 3. The capabilities of the proposed hybrid VoxNet TraDaBoost framework on both the testing datasets (with and without augmentation)
| Classification Rates | Chest Global X Ray Dataset | Local CT Scan Dataset | ||
| With Augmentation | Without Augmentation | With Augmentation | Without Augmentation | |
| Specificity | 94.66 | 90.14 | 97 | 94.25 |
| Accuracy | 94.81 | 89.6 | 97.25 | 95.4 |
| Sensitivity | 94.97 | 89.8 | 97.49 | 94.6 |
| Precision | 94.5 | 90.12 | 97 | 94.2 |
| F1 Score | 94.74 | 89.6 | 97.24 | 94.4 |
| False Negative Rate | 5.03 | 7.4 | 2.51 | 3.4 |
| False Discovery Rate | 5.5 | 9.88 | 3 | 3.8 |
| False Positive Rate | 5.32 | 9.86 | 2.99 | 3.75 |
| Negative Predictive Value | 95.12 | 89.32 | 97.5 | 94.4 |
Table 4. The performance of the VoxNet along with SVM, RF and AdaBoost framework on both the augmented testing datasets
| Classification Rates | VoxNet+SVM | VoxNet+RF | VoxNet+AdaBoost | |||
| Local CT Scan | Global Chest X Ray | Local CT Scan | Global Chest X Ray | Local CT Scan | Global Chest X Ray | |
| Precision | 90 | 86 | 82.5 | 80 | 94 | 92.5 |
| Accuracy | 90.25 | 85.75 | 83.75 | 83.75 | 94.25 | 92.25 |
| F1 Score | 90.23 | 85.79 | 83.54 | 83.12 | 94.24 | 92.27 |
| Specificity | 90.05 | 85.93 | 82.93 | 81.4 | 94.03 | 92.46 |
| Negative Predictive Value | 90.5 | 85.5 | 85 | 87.5 | 94.5 | 92 |
| False Positive Rate | 9.55 | 14.07 | 17.07 | 18.6 | 5.97 | 7.5 |
| False Discovery Rate | 10 | 14 | 17.5 | 20 | 6 | 7.5 |
| False Negative Rate | 9.55 | 14.4 | 15.38 | 13.5 | 5.53 | 7.96 |
| Sensitivity | 90.45 | 85.57 | 84.62 | 86.49 | 94.47 | 92.04 |
Figure 4. Performance analysis of the hybrid VoxNet TraDaBoost framework (Proposed) with VoxNet+SVM, VoxNet+RF and VoxNet+AdaBoost
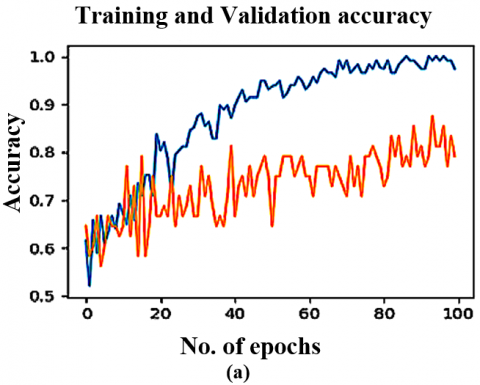
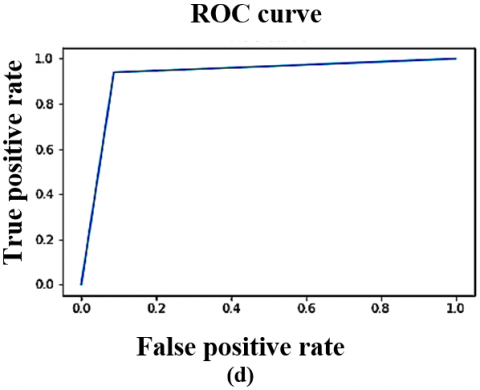
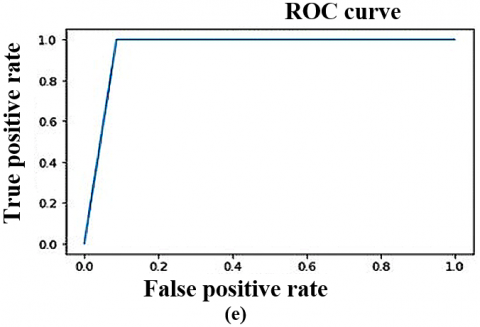
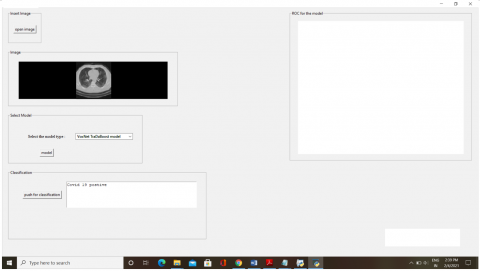
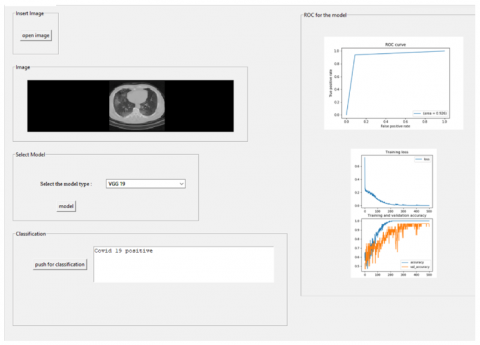
Furthermore, four DTL models alongside the YoloV9 were trained as well as evaluated on the augmented CT scan (Local) and Chest X-ray (Global) datasets to assess their performance relative to the proposed approach. The augmented datasets are utilized in an 80:20 ratio, meaning that 80 percent is utilized for training and 20 percent is used for validation. Using the same statistical parameters as those previously defined, their performance is illustrated in Table 5 below. Training and validation curves, as well as ROC analyses for four DTL models on the local CT scan dataset, are illustrated in Figures 5 and 6. The Figures 7 and 8 presents the AUC-ROC graph, which evaluates as well as showcases the proposed CovVoxTrada approach performance against multiple models on the Local as well as global (CT scan and X-ray) dataset. The Figures 9 and 10 show a screenshot of the CovVoxTrada system's working GUI and comparison approach. The comparison highlights the effectiveness of CovVoxTrada in distinguishing between different classes, showcasing its improved discriminative ability relative to other model.
Table 5. Evaluation outcomes of VGG16, YoloV9, InceptionV3, VGG19 and ResNet50 on the local as well as global (CT scan and chest X ray) augmented testing datasets
| Classification Rates | VGG16 | VGG19 | ResNet 50 | InceptionV3 | YoloV9 | |||||
| Local CT Scan | Global Chest X Ray | Local CT Scan | Global Chest X Ray | Local CT Scan | Global Chest X Ray | Local CT Scan | Global Chest X Ray | Local CT Scan | Global Chest X Ray | |
| Accuracy | 93.75 | 94 | 95 | 94.75 | 94.75 | 92.5 | 91.25 | 92 | 96 | 94.95 |
| Sensitivity | 92.68 | 95.36 | 94.12 | 95.43 | 93.7 | 91.75 | 91.88 | 91.42 | 95.36 | 93.68 |
| Specificity | 94.8 | 92.7 | 95.9 | 94.09 | 92.8 | 89.32 | 90.64 | 91.58 | 93.7 | 94.8 |
| Precision | 95 | 92.5 | 96 | 94 | 93.5 | 89 | 90.5 | 91.5 | 94.5 | 95.4 |
| Negative Predictive Value | 92.5 | 95.5 | 94 | 95.5 | 91.5 | 92 | 92 | 92.5 | 96.5 | 93.5 |
| False Positive Rate | 5.13 | 7.28 | 4.08 | 5.91 | 6.4 | 10.68 | 9.36 | 8.42 | 6.58 | 5.13 |
| False Discovery Rate | 5 | 7.5 | 4 | 6 | 6.5 | 11 | 9.5 | 8.5 | 7.5 | 5 |
| False Negative Rate | 7.32 | 4.64 | 5.88 | 4.57 | 62 | 8.25 | 8.12 | 7.58 | 4.64 | 7.32 |
| F1 Score | 93.83 | 93.9 | 95.05 | 94.7 | 93.61 | 90.36 | 91.18 | 91.96 | 94.9 | 93.83 |
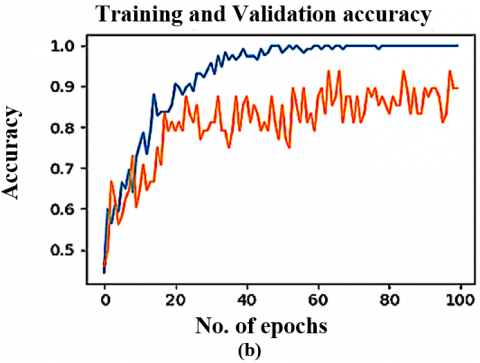
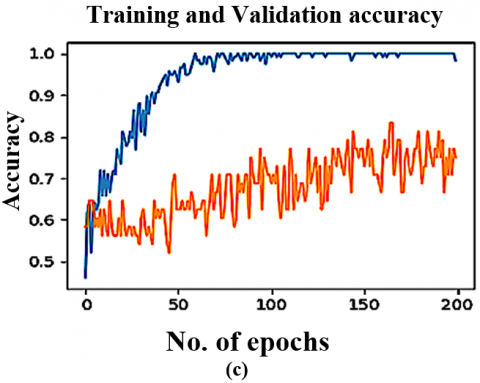
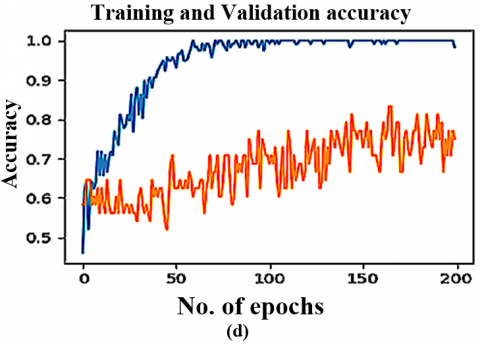
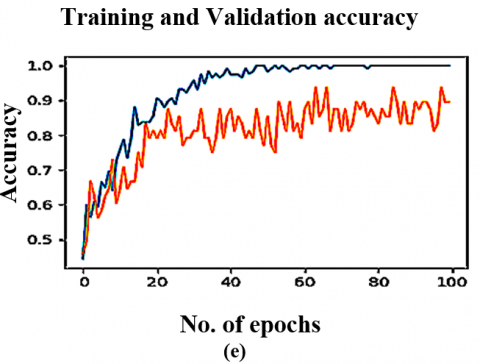
Figure 5. The DTL models training & validation graphs on Local dataset (CT scan) (a) VGG16 (b) VGG19 (c) ResNet50 (d) InceptionV3 (e) YoloV9
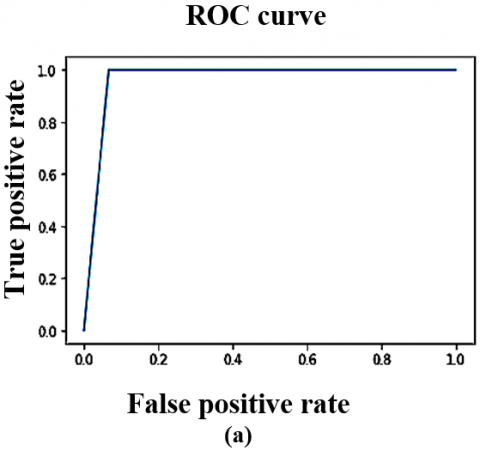
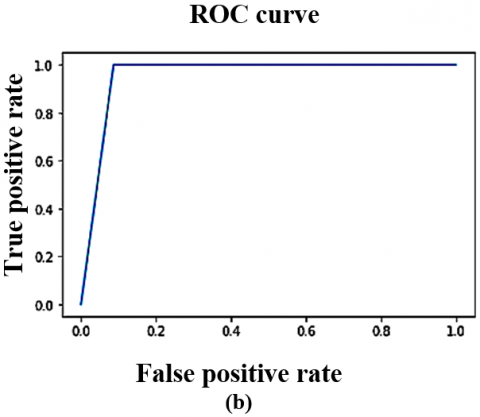
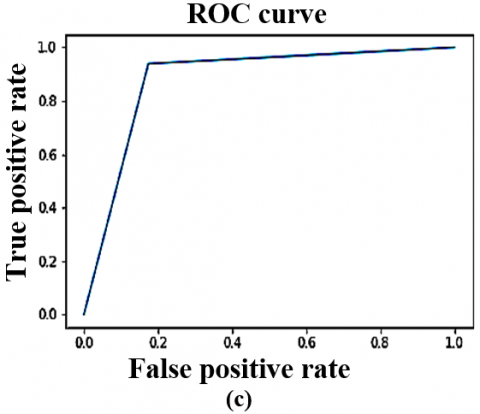
Figure 6. The DTL models ROC curve on CT scan dataset (Local) (a) VGG16 (b) VGG19 (c) ResNet50 (d) InceptionV3 (e) YoloV9
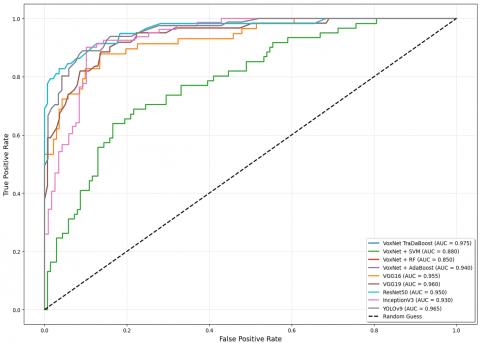
Figure 7. The AUC-ROC graph illustrating the performance of the CovVoxTrada approach (proposed) and other models on Local CT scan dataset used for the training and testing
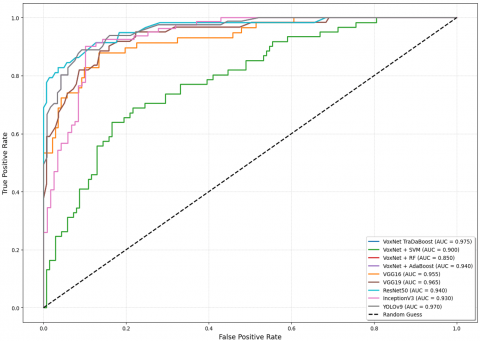
Figure 8. The AUC-ROC graph illustrating the performance of the proposed CovVoxTrada appraoch and other models on global chest X ray dataset used for the training and testing
Figure 9. Screenshot of the working application for positive COVID-19 cases detection based on the proposed hybrid VoxNet TraDaBoost approach
Figure 10. Screenshot of the working application for positive COVID-19 cases detection based on the comparison approach (VGG 19) DTL model
The performance of the proposed VoxNet TraDaBoost model is superior in terms of classifying the positive COVID-19 cases on both the datasets as per the Tables 4, 5. Initially, the VoxNet architecture is used along with various ensemble classifiers like TraDaBoost, AdaBoost, Random Forest and SVM. In which the combination of VoxNet+TraDaBoost delivers the superior performance. The major reasons for this optimum performance lies in the usage of the TraDaBoost along with the VoxNet as each are having some merits. The TraDaBoost model effectively handles minor class imbalance issues. It adaptively adjusts the weights of misclassified instances, which emphasizes correctly classifying the minority class instances. This can be well observed in the improved sensitivity and specificity of the proposed framework compared to others. Additionally, the VoxNet architecture's ability to learn robust features from CT scan as well as X ray (Chest) imageries is enhanced by the TraDaBoost algorithm's capacity to handle noisy and mislabeled instances. Apart from this, the TraDaBoost algorithm's iterative reweighting scheme helps to regularize the VoxNet model, leading to improved performance. Although this performance of the proposed hybrid VoxNet TraDaBoost model is achieved by trying out various values of learning rate and number of base estimators for the TraDaBoost model. The value of learning rate and number of base estimators are 0.01 and 200 respectively is used finally. Likewise, to identify the optimal hyperparameter values for the remaining classifiers, including AdaBoost, Random Forest, and SVM, a brief set of experiments was conducted. This experiment involves testing different hyper parameter values. These parameters include the learning rate, number of base estimators, and maximum depth of decision trees, regularization parameters, and kernel parameters.
In addition to evaluating the proposed hybrid CovVoxTrada model with and without augmentation, we also experimented with the impact of individual affine transformations (rotation, scaling, translation, and horizontal flipping). The results indicated that while rotation and scaling yielded slightly better accuracy and F1-score compared to the others, the improvements were marginal, when any single or pair of transformations were applied in isolation. In contrast, combining all four transformations produced a synergistic effect, leading to the highest overall performance (97% for X-rays of chest and 94.55% for CT). These findings suggest that while individual augmentations offer limited gains, their collective application significantly enhances robustness and generalization, therefore using the integrated augmentation strategy in this study.
To address potential concerns of overfitting, the proposed hybrid VoxNet–TraDaBoost model integrates multiple safeguards that collectively enhance generalization. First, momentum-based optimization was employed to stabilize convergence by accumulating a moving average of gradients, thereby mitigating oscillations and reducing sensitivity to noisy data. Second, data augmentation through affine transformations expanded the variability of the training dataset, ensuring that the model was exposed to a broader range of input conditions and minimizing the risk of memorizing training-specific patterns. Finally, the ensemble learning nature of the hybrid model adds a further layer of regularization, as the averaging of predictions from multiple base estimators counterbalances individual model biases and smooth’s out noise, resulting in more robust aggregated predictions. Together, these mechanisms not only curtailed overfitting but also contributed to the strong generalization performance observed on both global X-ray and local CT scan (chest) datasets.
As per the Table 3, the proposed VoxNet–TraDaBoost hybrid model demonstrates consistently high performance across both datasets, with notable improvements when data augmentation is applied. Particularly, CT scan images yielded superior results compared to chest X-rays, achieving sensitivity and specificity values above 97%, along with the lowest false negative rate (2.51%) and false discovery rate (3.0%). These findings suggest that CT scans serve as a more potent modality for detecting COVID-19 positive cases, ensuring fewer missed diagnoses in clinical practice. The balanced reduction in both false negatives and false positives underscores the model’s potential utility as a supportive diagnostic aid, helping clinicians in early and reliable patient screening while reducing the risks of unnecessary interventions.
The VoxNet TraDaBoost model is also compared with the 4 DTL models and YoloV9. The performance of these models exhibit competitive performance but they are outperformed by the proposed model in terms of accuracy, sensitivity, and specificity. These deep transfer learning models are generalizing over both datasets quite well and converges early. As the VGG 16, YoloV9 and VGG 19 converges at 100 epochs, whereas the remaining two converges at 200 epochs. The Figure 7 illustrating the comparison ROC-AUC curves further support the proposed model's superior performance, demonstrating improved separability between COVID-19 negative and positive cases. The trade-off between sensitivity and specificity is also significant, as the proposed model demonstrates a more equitable diagnostic accuracy than the other models. This balance is particularly critical in COVID-19 detection, focused on decreasing the occurrence of false negatives and false positives is of utmost importance due to their serious implications. Although the comparative analysis especially Figures 7 and 8 highlights that the YoloV9-based approach has performance metrics closest to the proposed CovVoxTrada model, as evidenced in the AUC-ROC scores. This, in turn, signifies that YoloV9 possesses high discriminative capability in distinguishing and identifying the COVID-19 infection samples from both the types of samples. The visual outputs, presented in the supplementary material, confirm YoloV9's strong performance. They also validate its high capability to accurately highlight infection regions.
The proposed hybrid VoxNet TraDaBoost framework performs superior as compare to the other models on both the datasets for the accurate classification of infected COVID-19 cases. Using the VoxNet TraDaBoost model, accuracy exceeds 97% on local dataset of CT scans and reaches about 94% on the global dataset of X-rays. Both these datasets after undergone augmentation are highly balance and large enough to avoid the quotient of over fitting in this research study. The other conventional classifiers like SVM, RF and AdaBoost used along with VoxNet model for COVID-19 classification doesn’t perform that well. The YoloV9 and VGG19 deep transfer learning models demonstrated superior performance compared to InceptionV3, VGG16 and ResNet50 across both augmented COVID-19 datasets. The accuracy of YoloV9 and VGG19 reaches around 95% for local CT scans dataset and about 94% for chest X-ray images of global dataset. Unlike deeper models such as VGG, ResNet, or YoLoV9 that collapse into overfitting on small datasets without heavy augmentation, the proposed lightweight CovVoxTrada model achieves stable training and high performance even with modest data. This demonstrates its practical advantage in real-world scenarios where large-scale annotated datasets are often unavailable.
There is a great scope of enhancing the performance of such COVID-19 detection systems by trying out various combinations of hybrid models consisting of deep learning or deep transfer learning models along with ensemble learning classifiers for eg. XGBoost and its versions. Another approach for improvement is by replacing the feature extraction step (VoxNet) with Yolo models. Yolo can be used as a first-stage "pre-filter" to locate all potential regions of interest in a X-ray or CT (chest) scan. Once Yolo identifies these regions, an ensemble classifier can be used in second-stage to analyze only these specific regions to do final classification. This two-stage approach combines the speed of Yolo for localization with the potentially higher classification accuracy of a second model. Although there is still need of properly annotated large-size datasets for effective training and testing, future work can also explore advanced augmentation strategies such as GAN-generated samples, intensity-based transformations, and noise injection to enrich data diversity. Moreover, benchmarking against modern architectures like Vision Transformers and EfficientNet on larger or synthetically expanded datasets could provide deeper insights into their applicability. Looking ahead, the implementation of such optimized models on hardware platforms such as Field Programmable Gate Arrays (FPGAs) or custom-designed hardware accelerators presents a promising direction, enabling real-time inference with lower latency and improved computational efficiency for clinical deployment.
This paper was supported by the esteemed Deanship of Research and Graduate Studies, King Khalid University, via grant RGP2/668/46 under the Large Research Project.
We gratefully acknowledge the Chief Radiologist of MP MRI and CT Scan Center i.e. Dr. Pushraj Bhatele, Jabalpur, India, for his expert guidance and consistent support in this research.
[1] World Health Organization: Modes of transmission of virus causing COVID-19: Implications for IPC precaution recommendations. (2020). Scientific brief technical report world health organization Geneva, Switzerland. https://www.who.int/news-room/commentaries/detail/modes-of-transmission-of-virus-causing-covid-19-implications-for-ipc-precaution-recommendations, accessed on Feb. 12, 2025.
[2] Msemburi, W., Karlinsky, A., Knutson, V., Aleshin-Guendel, S., Chatterji, S., Wakefield, J. (2023). The WHO estimates of excess mortality associated with the COVID-19 pandemic. Nature, 613(7942): 130-137. https://doi.org/10.1038/s41586-022-05522-2
[3] Ahsan, A., Shabbir, C.A., Qadeer, M.A., Rafiq, A., Yaseen, A., Ali, M.S., Ahmad, I. (2024). Comparison of rapid antigen test with RT-PCR for COVID-19 diagnosis: Performance and limitation. Russian Open Medical Journal, 13(2): e0210. http://doi.org/10.15275/rusomj.2024.0210
[4] Iglesias-Ussel, M.D., Bowie, A., Anderson, J.G., Li, Y., Park, L.P., Cardona, J.F., Dennis, P., Ebuh, V., Geller, S.A., Jain, M., McKenzie, M.M., Merchant-Borna, K., Patel, A., Siegel, A., Strauss, G.S., Thoppil, J.J., Weinberg, A.S., Woods, C.W. (2025). Clinical performance of abbott ID NOW™ COVID-19 2.0 rapid molecular point-of-care test compared to three real-time RT-PCR assays. Microbiology Spectrum, 13(3): e02033-24. https://doi.org/10.1128/spectrum.02033-24
[5] Qaqish, A., Soudah, O., Al-Omari, M.M., Abbas, M.M., Al-Ajaleen, M.A., Abu-Ali, F., Said, R., Ghazo, M. (2025). COVID-19 Molecular diagnosis challenges faced by medical laboratory specialists in hospitals of Jordan: A qualitative study. Jordan Journal of Biological Sciences, 18(1): 163-171. https://doi.org/10.54319/ijbs/180118
[6] Kumar, R., Pan, C.T., Lin, Y.M., Yow-Ling, S., Chung, T.S., Janesha, U.G.S. (2025). Enhanced multi-model deep learning for rapid and precise diagnosis of pulmonary diseases using chest X-ray imaging. Diagnostics, 15(3): 248. http://doi.org/10.3390/diagnostics15030248
[7] Rabbah, J., Ridouani, M., Hassouni, L. (2025). Improving pneumonia diagnosis with high-accuracy CNN-based chest X-ray image classification and integrated gradient. Biomedical Signal Processing and Control, 101: 107239. http://doi.org/10.1016/j.bspc.2024.107239
[8] Ferraz, A., Betini, R.C. (2025). Comparative evaluation of deep learning models for diagnosis of COVID-19 using X-ray images and computed tomography. Journal of The Brazilian Computer Society, 31(1): 99-131. https://doi.org/10.5753/jbcs.2025.3043
[9] Pal, M., Mohapatra, R.K., Sarangi, A.K., Sahu, A.R., Mishra, S., Patel, A., Bhoi, S.K., Elnaggar, A.Y., El Azab, I.H., Alissa, M., El-Bahy, S.M. (2025). A comparative analysis of the binary and multiclass classified chest X-ray images of pneumonia and COVID-19 with ML and DL models. Open Medicine, 20(1): 20241110. https://doi.org/10.1515/med-2024-1110
[10] Lee, K., Brennan, P.C., Lau, E., Suleiman, M.E., Raveendrampillai, S., Tapia, K., Abubakar, A. Ekpo, E. (2025). Urgent findings in CT chest examinations: Radiography and medical students’ capabilities and learning perspectives-a preliminary study. Radiography, 31(2): 102867. https://doi.org/10.1016/j.radi.2025.01.002
[11] Ibrahim, S., Selim, S., Elattar, M. (2025). Facilitating radiograph interpretation: Refined generative models for precise bone suppression in chest X-rays. Journal of Imaging Informatics in Medicine, 1-17. https://doi.org/10.1007/s10278-025-01461-2
[12] Zalewa, K., Olszak, J., Kapłan, W., Orłowska, D., Bartoszek, L., Kaus, M., Klepacz, N. (2025). Application of artificial intelligence in radiological image analysis for pulmonary disease diagnosis: A review of current methods and challenges. Journal of Education, Health and Sport, 77: 56893-56893. https://doi.org/10.12775/JEHS.2025.77.56893
[13] Simard, P.Y., Steinkraus, D., Platt, J.C. (2003). Best practices for convolutional neural networks applied to visual document analysis. In Proceedings of the Seventh International Conference on Document Analysis and Recognition, Edinburgh, UK, 3: 958-963. https://doi.org/10.1109/ICDAR.2003.1227801
[14] O'shea, K., Nash, R. (2015). An introduction to convolutional neural networks. arXiv Preprint arXiv: 1511.08458. https://doi.org/10.48550/arXiv.1511.08458
[15] Bhandare, A., Bhide, M., Gokhale, P., Chandavarkar, R. (2016). Applications of convolutional neural networks. International Journal of Computer Science and Information Technologies, 7(5): 2206-2215. https://ijcsit.com/docs/Volume%207/vol7issue5/ijcsit20160705014.pdf#:~:text=Ashwin%20Bhandare%20et%20al%2C%20/%20(IJCSIT)%20International,of%20Computer%20Science%20and%20Information%20Technologies%2C%20Vol.
[16] Barbedo, J.G.A., Castro, G.B. (2020). A study on CNN-based detection of psyllids in sticky traps using multiple image data sources. AI, 1(2): 198-208. https://doi.org/10.3390/ai1020013
[17] Suzuki, K. (2017). Overview of deep learning in medical imaging. Radiological Physics and Technology, 10(3): 257-273. https://doi.org 10.1007/s12194-017-0406-5
[18] Banihabib, M.E., Bandari, R., Valipour, M. (2020). Improving daily peak flow forecasts using hybrid fourier-series autoregressive integrated moving average and recurrent artificial neural network models. Ai, 1(2): 263-275. https://doi.org/10.3390/ai1020017
[19] Taravat, A., Wagner, M.P., Oppelt, N. (2019). Automatic grassland cutting status detection in the context of spatiotemporal sentinel-1 imagery analysis and artificial neural networks. Remote Sensing, 11(6): 711. https://doi.org/10.3390/rs11060711
[20] Islam, K.T., Wijewickrema, S., Raj, R.G., O’Leary, S. (2019). Street sign recognition using histogram of oriented gradients and artificial neural networks. Journal of Imaging, 5(4): 44. https://doi.org/10.3390/jimaging5040044
[21] Zeiler, M.D., Fergus, R. (2014). Visualizing and understanding convolutional networks. In European Conference on Computer Vision, pp. 818-833. https://doi.org/10.1007/978-3-319-10590-1_53
[22] Krizhevsky, A., Sutskever, I., Hinton, G.E. (2012). Imagenet classification with deep convolutional neural networks. Communications of the ACM, 60(6): 84-90. https://doi.org/10.1145/3065386
[23] Simonyan, K., Zisserman, A. (2014). Very deep convolutional networks for large-scale image recognition. arXiv Preprint arXiv: 1409.1556. https://doi.org/10.48550/arXiv.1409.1556
[24] Litjens, G., Kooi, T., Bejnordi, B.E., Setio, A.A.A., Ciompi, F., Ghafoorian, M., Van Der Laak, J.A., Van Ginneken, B., Sánchez, C.I. (2017). A survey on deep learning in medical image analysis. Medical Image Analysis, 42: 60-88. https://doi.org/10.1016/j.media.2017.07.005
[25] Lundervold, A.S., Lundervold, A. (2019). An overview of deep learning in medical imaging focusing on MRI. Zeitschrift Für Medizinische Physik, 29(2): 102-127. https://doi.org/10.1016/j.zemedi.2018.11.002
[26] Hung, J., Carpenter, A. (2017). Applying faster R-CNN for object detection on malaria images. In Proceedings of the IEEE Conference on Computer Vision and Pattern Recognition Workshops. Honolulu, USA, pp. 56-61. https://doi.org/10.1109/CVPRW.2017.112
[27] Acharya, U.R., Fujita, H., Lih, O.S., Adam, M., Tan, J.H., Chua, C.K. (2017). Automated detection of coronary artery disease using different durations of ECG segments with convolutional neural network. Knowledge-Based Systems, 132: 62-71. https://doi.org/10.1016/j.knosys.2017.06.003
[28] Oh, S.L., Hagiwara, Y., Raghavendra, U., Yuvaraj, R., Arunkumar, N., Murugappan, M., Acharya, U.R. (2020). A deep learning approach for Parkinson’s disease diagnosis from EEG signals. Neural Computing and Applications, 32(15): 10927-10933. https://doi.org/10.1007/s00521-018-3689-5
[29] Prajapati, S.A., Nagaraj, R., Mitra, S. (2017). Classification of dental diseases using CNN and transfer learning. In Proceedings of the 5th International Symposium on Computational and Business Intelligence (ISCBI). Dubai, United Arab Emirates, pp. 70-74. https://doi.org/10.1109/ISCBI.2017.8053547
[30] Farooq, A., Anwar, S., Awais, M., Rehman, S. (2017). A deep CNN based multi-class classification of Alzheimer’s disease using MRI. In Proceedings of the IEEE International Conference on Imaging Systems and Techniques (IST), Beijing, China, pp. 1-6, https://doi.org/10.1109/IST.2017.8261460
[31] Kruthika, K., Rajeswari, Maheshappa, H.D. (2019). CBIR system using capsule networks and 3D CNN for Alzheimer’s disease diagnosis. Informatics in Medicine Unlocked, 14: 59-68. https://doi.org/10.1016/j.imu.2018.12.001
[32] Narin, A., Kaya, C., Pamuk, Z. (2020). Automatic detection of coronavirus disease (COVID-19) using X-ray images and deep convolutional neural networks. arXiv Preprint arXiv: 2003.10849. https://doi.org/10.48550/arXiv.2003.10849
[33] Zhang, J., Xie, Y., Li, Y., Shen, C., Xia, Y. (2020). COVID-19 screening on chest X-ray images using deep learning based anomaly detection. arXiv Preprint arXiv: 2003.12338. https://doi.org/10.48550/arXiv.2003.12338
[34] Hall, L.O., Paul, R., Goldgof, D.B., Goldgof, G.M. (2020). Finding COVID-19 from chest X-rays using deep learning on a small dataset. arXiv Preprint arXiv: 2004.02060. https://doi.org/10.48550/arXiv.2004.02060
[35] Sethy, P.K., Behera, S.K., Ratha, P.K., Biswas, P. (2020). Detection of coronavirus disease (COVID-19) based on deep features and Support Vector Machine. Preprints.org. https://www.preprints.org/manuscript/202003.0300/v2.
[36] Apostolopoulos, I.D., Mpesiana, T.A. (2020). COVID-19: Automatic detection from X-ray images utilizing transfer learning with convolutional neural networks. Physical and Engineering Sciences in Medicine, 43(2): 635-640. https://doi.org/10.1007/s13246-020-00865-4
[37] Li, L., Qin, L., Xu, Z., Yin, Y., Wang, X., Kong, B., Bai, J., Lu, Y., Fang, Z., Song, Q., Cao, K., Liu, D., Wang, G., Xu, Q., Fang, X., Zhang, S., Xia, J., Xia, J. (2020). Artificial intelligence distinguishes COVID-19 from community acquired pneumonia on chest CT. Radiology, 296(2): E65-E71. https://doi.org/10.1148/radiol.2020200905
[38] Islam, M.Z., Islam, M.M., Asraf, A. (2020). A combined deep CNN-LSTM network for the detection of novel coronavirus (COVID-19) using X-ray images. Informatics in Medicine Unlocked, 20: 100412. https://doi.org/10.1016/j.imu.2020.100412
[39] Hemdan, E.E.D., Shouman, M.A., Karar, M.E. (2020). Covidx-net: A framework of deep learning classifiers to diagnose COVID-19 in X-ray images. arXiv Preprint arXiv: 2003.11055. https://doi.org/10.48550/arXiv.2003.11055
[40] Ozturk, T., Talo, M., Yildirim, E.A., Baloglu, U.B., Yildirim, O., Acharya, U.R. (2020). Automated detection of COVID-19 cases using deep neural networks with X-ray images. Computers in Biology and Medicine, 121: 103792. https://doi.org/10.1016/j.compbiomed.2020.103792
[41] Ucar, F., Korkmaz, D. (2020). COVIDiagnosis-net: Deep bayes-SqueezeNet based diagnosis of the coronavirus disease 2019 (COVID-19) from X-ray images. Med Hypotheses, 140: 109761. https://doi.org/10.1016/j.mehy.2020.109761
[42] Khan, A.I., Shah, J.L., Bhat, M.M. (2020). CoroNet: A deep neural network for detection and diagnosis of COVID-19 from chest X-ray images. Computer Methods and Programs in Biomedicine, 196: 105581. https://doi.org/10.1016/j.cmpb.2020.105581
[43] Chollet, F. (2017). Xception: Deep learning with depth wise separable convolutions. arXiv Preprint arXiv: 1610.02357. https://doi.org/10.48550/arXiv.1610.02357
[44] Waheed, A., Goyal, M., Gupta, D., Khanna, A., Al-Turjman, F., Pinheiro, P.R. (2020). Covidgan: Data augmentation using auxiliary classifier GAN for improved COVID-19 detection. IEEE Access, 8: 91916-91923. https://doi.org/10.1109/ACCESS.2020.2994762
[45] Hasib, U.A., Md Abu, R., Yang, J., Bhatti, U.A., Ku, C.S., Por, L.Y. (2025). YOLOv8 framework for COVID-19 and pneumonia detection using synthetic image augmentation. Digital Health, 11: 20552076251341092. https://doi.org/10.1177/20552076251341092
[46] De Oliveira, C.I., do Nascimento, M.Z., Roberto, G.F., Tosta, T.A., Martins, A.S., Neves, L.A. (2024). Hybrid models for classifying histological images: An association of deep features by transfer learning with ensemble classifier. Multimedia Tools and Applications, 83(8): 21929-21952. https://doi.org/10.1007/s11042-023-16351-4
[47] Müller, D., Soto-Rey, I., Kramer, F. (2022). An analysis on ensemble learning optimized medical image classification with deep convolutional neural networks. IEEE Access, 10: 66467-66480. https://doi.org/10.1109/ACCESS.2022.3182399
[48] Khazaee Fadafen, M., Rezaee, K. (2023). Ensemble-based multi-tissue classification approach of colorectal cancer histology images using a novel hybrid deep learning framework. Scientific Reports, 13(1): 8823. https://doi.org/10.1038/s41598-023-35431-x
[49] Kailasam, R., Balasubramanian, S. (2025). Deep learning for pneumonia detection: A combined CNN and YOLO approach. Human-Centric Intelligent Systems, 5: 44-62. https://doi.org/10.1007/s44230-025-00091-9
[50] Cohen, J.P., Morrison, P., Dao, L. (2020). COVID-19 image data collection. arXiv Preprint arXiv: 2003.11597. https://doi.org/10.48550/arXiv.2003.11597
[51] COVID-19 Radiography Database. (2022). https://www.kaggle.com/datasets/tawsifurrahman/covid19-radiography-database, accessed on Feb. 18, 2025.
[52] IEEE8023/Covid Chest X-ray Dataset. (2022). https://github.com/ieee8023/covid-chestxray-dataset, accessed on Feb. 25, 2025.
[53] Maturana, D., Scherer, S. (2015). 3D convolutional neural networks for landing zone detection from lidar. In 2015 IEEE International Conference on Robotics and Automation (ICRA), Seattle, USA, pp. 3471-3478. https://doi.org/10.1109/ICRA.2015.7139679
[54] Zhu, J., Zou, H., Rosset, S., Hastie, T. (2009). Multi-class adaboost. Statistics and Its Interface, 2(3): 349-360. https://chu-data-lab.github.io/CS8803Fall2018/CS8803-Fall2018-DML-Papers/adaboost-multiclass.pdf.
[55] Al-Stouhi, S., Reddy, C.K. (2011). Adaptive boosting for transfer learning using dynamic updates. In Joint European Conference on Machine Learning and Knowledge Discovery in Databases, pp. 60-75. https://doi.org/10.1007/978-3-642-23780-5_14
[56] Liu, T., Wang, Z. (2019). HiCNN: A very deep convolutional neural network to better enhance the resolution of Hi-C data. Bioinformatics, 35(21): 4222-4228. https://doi.org/10.1093/bioinformatics/btz251
[57] He, K., Zhang, X., Ren, S., Sun, J. (2016). Deep residual learning for image recognition. In Proceedings of the IEEE Conference on Computer Vision and Pattern Recognition. Las Vegas, USA, pp. 770-778. https://doi.org/10.1109/CVPR.2016.90
[58] Szegedy, C., Liu, W., Jia, Y., Sermanet, P., Reed, S., Anguelov, D., Erhan, D., Vanhoucke, V., Rabinovich, A. (2015). Going deeper with convolutions. In Proceedings of The IEEE Conference on Computer Vision and Pattern Recognition, Boston, USA, pp. 1-9. https://doi.org/10.1109/CVPR.2015.7298594
[59] Wang, C.Y., Yeh, I.H., Mark Liao, H.Y. (2024). Yolov9: Learning what you want to learn using programmable gradient information. In European Conference on Computer Vision, pp. 1-21. https://doi.org/10.1007/978-3-031-72751-1_1
[60] Kingma, D.P. Ba, J. (2015). Adam: A method for stochastic optimization. arXiv Preprint arXiv: 1412.6980. https://doi.org/10.48550/arXiv.1412.6980