Chenyuan Zhao![]()
© 2025 The author. This article is published by IIETA and is licensed under the CC BY 4.0 license (http://creativecommons.org/licenses/by/4.0/).
OPEN ACCESS
Cities are principal contributors to carbon emissions, making precise governance crucial in addressing climate change. Traditional inventory methods, reliant on statistical data, suffer from coarse spatial granularity and delayed updates, limiting their utility for fine-scale management. Synthetic aperture radar (SAR) remote sensing, with its all-weather capability, offers a novel approach for dynamic identification of urban carbon emission hotspots. However, challenges remain in extracting semantic information and linking technical outputs to policy implementation. To address these issues, advances at both technical and application levels were proposed in this study. Technically, an improved U-shaped Network (U-Net) semantic segmentation model tailored to remote sensing imagery was introduced. Enhanced feature bands were constructed from Vertical transmit-Vertical receive (VV) and Vertical transmit-Horizontal receive (VH) polarization data. The encoder employed the Pyramid Vision Transformer v2 (PVTv2) to reinforce global feature learning and noise robustness, while the decoder integrated depthwise separable convolution and the Convolutional Block Attention Module (CBAM) to improve efficiency and refinement. Coordinate attention was further embedded in skip connections to enable precise boundary localization of hotspots. At the application level, the model generated high-accuracy hotspot distribution maps that supported targeted low-carbon regulation strategies, including source diagnosis, urban spatial optimization, green industrial upgrading, and differentiated policy formulation. This established a complete chain from data acquisition to decision-making. The originality of this research lies in three aspects: (a) Data innovation: integrating multi-polarization information into enhanced feature bands to improve the representational capacity of emission hotspot imagery; (b) Model innovation: incorporating Transformer-based global modeling and attention mechanisms within an improved U-Net to enhance segmentation accuracy and robustness; and (c) Application innovation: establishing a framework that transforms remote sensing outputs into actionable low-carbon regulation strategies, bridging perception and decision-making.
urban carbon emission hotspots, semantic segmentation, U-Net, SAR remote sensing, low-carbon economic regulation, attention mechanism
With the intensification of global climate change [1-3], the advancement of a low-carbon economy [4, 5] has been widely acknowledged as a shared priority among nations. As the primary centers of energy consumption and carbon emissions [6, 7], cities play a pivotal role in the realization of the “dual carbon” strategic objectives. However, the prerequisite for precise emission reduction lies in the dynamic and detailed understanding of the spatiotemporal distribution of urban carbon emissions. Traditional carbon emission inventories derived from statistical data [8, 9] suffer from inherent limitations, including coarse spatial granularity and long update cycles, which hinder their applicability for fine-scale urban management and policy evaluation. In this context, remote sensing technology [10-13], with its macroscopic, real-time, and objective advantages, has emerged as a powerful tool for rapidly monitoring urban carbon emission-related activities over large areas. In particular, SAR satellites, which possess all-time and all-weather Earth observation capabilities, are able to effectively capture urban surface structural information closely associated with human activities. This provides a robust data foundation for the indirect yet efficient identification of emission “hotspots” such as high-density residential areas, industrial parks, and transportation hubs.
The present study is directed toward addressing the challenge of accurately identifying the spatial characteristics of urban carbon emissions through deep learning methods, with significant theoretical and practical implications. At the theoretical level, an advanced semantic segmentation model is introduced into the domain of remote sensing research on urban carbon cycles. This approach establishes a novel paradigm for directly extracting semantic information on emission hotspots from remote sensing imagery, thereby promoting the integration of intelligent remote sensing interpretation and urban environmental science. At the practical level, the outcomes of this research enable the generation of high spatiotemporal resolution “carbon emission distribution maps,” which translate abstract emission totals into specific, visualized spatial units. Such outputs not only allow the precise diagnosis of the current status of urban carbon emissions but also provide scientific data support for the formulation of low-carbon regulation strategies, including urban planning, industrial restructuring, and transportation optimization. Consequently, the findings contribute to the transition of urban governance from extensive management toward refined and intelligent regulation, offering substantial value for the realization of sustainable urban development.
Despite significant progress in environmental monitoring through remote sensing, research on the direct extraction of urban carbon emission hotspots remains at an early stage, and existing approaches exhibit clear limitations. First, in terms of data utilization [14, 15], most studies have relied solely on optical imagery or single-polarization features of remote sensing data. Such practices have failed to fully exploit the complementary information embedded in multi-source and multi-polarization datasets, thereby constraining the representational capacity of carbon emission hotspots in complex urban environments. Second, regarding model architectures, earlier studies often employed traditional machine learning classifiers [16, 17] or basic convolutional neural networks (CNNs) [18, 19]. These methods are highly sensitive to the speckle noise inherent in remote sensing imagery and are unable to effectively capture long-range dependencies among ground objects, resulting in blurred boundaries and the omission of small-scale hotspots. More critically, most existing research has remained confined to technical implementation. For instance, extraction of urban building areas has been successfully achieved [20], yet such results have rarely been deeply integrated with specific low-carbon economic regulation strategies. This disconnection from “technical output” to “policy input” greatly restricts the practical utility of such efforts.
To address these limitations, this study investigated the application of an improved U-Net-based semantic segmentation model for the extraction of urban carbon emission hotspots and its integration into low-carbon economic regulation. The research is organized into two closely interrelated components. The first component focuses on innovations in remote sensing image semantic segmentation tailored to hotspot extraction. Remote sensing imagery was reconstructed by constructing enhanced feature bands enriched with hotspot information. On this basis, an improved U-Net model was developed, in which the encoder adopts the PVTv2 backbone to strengthen feature representation, the decoder incorporates depthwise separable convolution and the CBAM attention mechanism to enhance efficiency and feature fusion, and coordinate attention was embedded within skip connections to achieve precise boundary localization of hotspots. The second component builds upon the high-accuracy hotspot distribution maps generated by the model to conduct spatiotemporal analysis and to systematically articulate their application pathways in low-carbon economic regulation. These pathways include the precise diagnosis of emission sources, the optimization of spatial planning, the guidance of green industrial upgrading, and the formulation of differentiated regulatory policies. The significance of this study lies in its contribution not only of a more robust and accurate technical solution for intelligent hotspot extraction, but also of a comprehensive framework that extends from remote sensing data acquisition to semantic segmentation and ultimately to actionable regulatory strategies. This integrated approach provides a practical and scientifically grounded pathway for advancing low-carbon urban governance.
2.1 Data reconstruction
Urban carbon emission hotspots are generally closely associated with areas of high-intensity human activity, which exhibit distinctive backscattering characteristics in SAR imagery. Traditional deep learning-based extraction approaches have primarily relied on single-polarization VV data. However, such a single-source strategy presents clear limitations. VV polarization is highly sensitive to surface roughness and dielectric constants, which allows vertical structures such as buildings to be captured effectively, yet it fails to exploit the full spectrum of discriminative features. In contrast, VH polarization is mainly generated by volume scattering and provides a stronger response to vegetation or rough surfaces, while also containing information related to human activities. Neglecting VH polarization therefore results in the loss of critical discriminative information that can help differentiate emission hotspots such as industrial facilities from natural vegetation, thereby constraining both the accuracy and robustness of hotspot identification. Consequently, the reconstruction of input data to fully exploit the intrinsic information embedded in dual-polarization SAR imagery has been identified as a critical step for overcoming the limitations of existing methods.
The fundamental principle of the proposed data reconstruction approach draws upon the concept of “index construction” widely applied in multispectral remote sensing. The core idea is that the same land cover type exhibits varying spectral responses across electromagnetic bands, and such differences can be utilized to enhance or highlight specific target information. Similarly, in SAR imagery, the backscattering mechanisms of the same surface object differ under VV and VH polarizations. By designing mathematical operations to construct new bands that emphasize the differences or ratios between VV and VH polarizations, it becomes theoretically possible to suppress common low-scattering backgrounds while amplifying unique scattering characteristics associated with urban hotspots. This enhancement increases the discriminative power of the input data for subsequent semantic segmentation.
Based on this principle, two new feature band construction methods, referred to as NewBand1 and NewBand2, were introduced. The first method is formulated in the style of a normalized differential polarization index. This index transforms the absolute differences in backscattering intensity into relative differences, thereby mitigating the influence of factors such as incidence angle while highlighting the contrasting scattering mechanisms of different land cover types. For instance, regions dominated by surface scattering and those dominated by double-bounce scattering, such as building areas, can be more effectively distinguished. The expression is given as:
$NewBand1=\frac{VH-VV}{VH+VV}$ (1)
The second method is defined as the square root of the mean of squared values, expressed as:
$NewBand2=\sqrt{\frac{V{{V}^{2}}+V{{H}^{2}}}{2}}$ (2)
NewBand1 and NewBand2 reveal the interaction between VV and VH polarizations from two distinct perspectives through different mathematical combinations. The essence of this reconstruction lies in transforming the original backscattering coefficients (VV and VH)—which are physically meaningful yet potentially overlapping—into derived features that more directly reflect the structural and scattering characteristics of urban carbon emission hotspots. This transformation creates a new and more discriminative feature space at the data level.
To rigorously assess the effectiveness of data reconstruction, an intuitive and classical image segmentation evaluation method—the bimodal method—was employed to preliminarily validate the newly constructed bands against the original ones. The principle of this method is that if hotspots and background areas in an image exhibit strong separability in grayscale values, the grayscale histogram should display a clear bimodal pattern, corresponding to the background and target pixel groups, respectively. The analysis revealed that the histograms of NewBand1 and NewBand2 exhibited the most pronounced bimodal patterns, outperforming the VV band and showing a significant advantage over the VH band. From the perspective of statistical distribution, this demonstrates that the reconstructed bands successfully amplified the feature differences between target and background, thereby improving the separability of the two classes in grayscale space. In particular, the smaller peak on the right side of NewBand1 was found to correspond to hotspots, indicating that this construction method assigns hotspots a distinct high-value range that contrasts sharply with the background. This validation step is of critical importance, as it provides preliminary quantitative evidence—derived directly from the data—that the reconstructed bands are more conducive to semantic segmentation. Such evidence ensures both the rationality and necessity of incorporating reconstructed data into subsequent deep learning models.
2.2 Segmentation model
2.2.1 Model framework
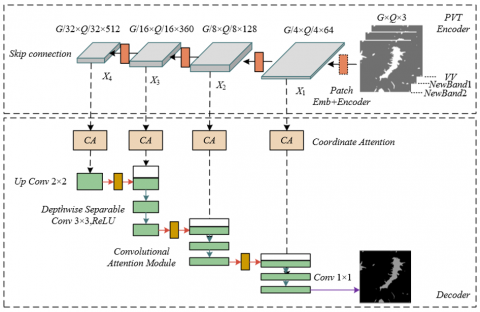
The proposed model is constructed on the foundation of the classical U-Net architecture, with its core innovation lying in the development of a representation system capable of more effectively learning multi-scale features for the precise extraction of urban carbon emission hotspots. In the upper path of the U-shaped architecture, namely the encoder, the original convolutional network is replaced by the PVTv2. This substitution is motivated by the fact that urban carbon emission hotspots in remote sensing imagery often exhibit complex spatial structures and textural patterns. Leveraging its powerful global self-attention mechanism, the Transformer architecture of PVTv2 is able to model long-range dependencies among spatially distributed scattering points more effectively than traditional CNNs. Within the encoder, four successive downsampling operations are performed, which not only enlarge the receptive field and compress spatial dimensions step by step but also enable the systematic learning of hierarchical features ranging from shallow low-level descriptors to deep abstract semantic representations. In the lower path of the architecture, namely the decoder, the task is to upsample and restore the high-level semantic features to the original image resolution. Transposed convolution operations are employed to progressively enlarge the feature maps. The key function of the decoder is to transform the abstract concepts of “what constitutes a carbon emission hotspot,” as captured by the encoder, back into pixel-level spatial locations. Together, the encoder-decoder structure forms the backbone of the model, ensuring a smooth flow of information from the input image to the output segmentation map. The ultimate objective of this framework is to achieve accurate recognition and localization of semantically meaningful regions within complex urban scenes. The overall architecture of the model is shown in Figure 1.
Figure 1. Overall architecture of the model
To achieve more refined segmentation performance, two layers of attention enhancement mechanisms were integrated into the U-Net backbone, specifically addressing challenges commonly encountered in remote sensing image segmentation. First, during the upsampling process in the decoder, information compression and interpolation inevitably lead to the loss of fine-grained details. To mitigate this issue, the CBAM was incorporated. CBAM automatically computes attention weights along both channel and spatial dimensions, functioning as an intelligent filter that emphasizes feature channels and spatial locations highly correlated with urban carbon emission hotspots while suppressing irrelevant or noisy background information. This mechanism substantially enhances the model’s capacity to restore image details, thereby preventing the dilution of critical features and ensuring sharp boundary delineation in the output. Second, the skip connections—one of the core designs of U-Net—were refined by replacing the simple concatenation operation with a coordinate attention mechanism. The central advantage of this mechanism lies in embedding positional information into channel attention, enabling the precise capture of spatial coordinates of the target. During the fusion of encoder and decoder features, the coordinate attention mechanism effectively guides the model to focus on boundary variations, such as distinguishing transition zones between industrial areas and surrounding bare land or vegetation. Through this enhanced feature fusion strategy, shallow localization information and deep semantic information are seamlessly combined. Finally, a 1 × 1 convolution layer is applied to achieve pixel-level classification, producing binary segmentation maps of urban carbon emission hotspots with rich detail and accurate boundaries, thereby directly supporting the ultimate objective of the study.
2.2.2 Encoder module
The inherent speckle noise of remote sensing imagery is a major obstacle to stable and accurate feature learning. Traditional CNNs, with their local receptive fields and inductive biases, exhibit limited robustness when dealing with this multiplicative noise. In contrast, Transformer architectures, through their global self-attention mechanism, are capable of directly modeling long-range dependencies among all pixels within an image. This design enables the classification of an individual pixel to be informed by distant pixels with similar scattering properties, thereby distinguishing true structural signals from random noise within a global context. As a result, more robust and noise-resistant feature representations are obtained. Furthermore, urban carbon emission hotspots often exhibit complex spatial layouts and variations in scale. The pyramidal structure of PVTv2 generates feature maps (X1-X4) at four stages across different scales. This multi-scale feature extraction capability is critical: shallow features (X1) preserve detailed spatial appearance information, which is indispensable for delineating hotspot boundaries with precision, while deeper features (X4) capture abstract semantic information, ensuring classification accuracy. The encoder module is therefore designed to leverage both the global modeling ability of the Transformer and the pyramidal multi-scale structure, fundamentally enhancing the capacity to learn complex hotspot features from noise-prone remote sensing imagery.
Rather than directly adopting the original Pyramid Vision Transformer (PVT) model, the upgraded version, PVTv2, was selected and further optimized, reflecting deliberate design considerations within the encoder module. First, the fixed-size positional encoding used in the original PVT cannot flexibly adapt to varying input image sizes, which represents a critical limitation in practical remote sensing applications where cropping or differing scene dimensions frequently lead to inconsistent input sizes. PVTv2 addresses this issue by employing a zero-padding strategy to implement a simple yet effective positional encoding scheme, thereby equipping the model with the ability to process images of arbitrary dimensions and significantly enhancing its practicality and flexibility. Second, the high spatial resolution of remote sensing imagery imposes considerable computational complexity. PVTv2 alleviates this by replacing the spatial-reduction attention of the original PVT with linear-complexity remote sensing imagery, thereby markedly reducing the computational burden of self-attention on high-resolution feature maps. This ensures efficiency when handling large-scale remote sensing data, making the deployment of a high-performance Transformer backbone feasible for real-world applications. Finally, the classification head originally designed in PVTv2 for image classification tasks was removed. Consequently, the encoder output is no longer a single categorical label but instead consists of multi-level feature maps (X1-X4) that preserve full spatial dimensions. These multi-scale feature maps, enriched with information at different hierarchical levels, are directly transmitted to the decoder through skip connections, thereby providing a comprehensive information foundation for subsequent pixel-level semantic segmentation.
2.2.3 Decoder module
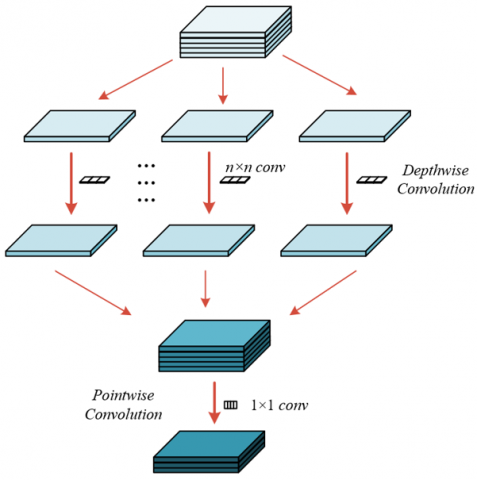
In the decoder module, depthwise separable convolution was adopted with the primary objective of significantly improving computational efficiency while maintaining segmentation accuracy. This design choice represents a critical engineering consideration for large-scale remote sensing applications. In semantic segmentation models—particularly those employing encoder-decoder architectures such as U-Net—high-level, low-resolution feature maps must be progressively upsampled to match the resolution of the original input. This process typically involves extensive convolutional operations. If conventional standard convolution were employed throughout the decoder, both parameter count and computational load would increase dramatically, as standard convolution simultaneously performs spatial filtering and channel fusion, requiring the number of convolutional kernels to match the number of input feature map channels. Such a configuration results in an excessively heavy model. Depthwise separable convolution addresses this limitation by decomposing the process into two independent steps. In the first stage, depthwise convolution, each kernel is responsible only for spatial feature extraction within a single input channel, thereby avoiding cross-channel computations and substantially reducing the number of parameters. In the second stage, pointwise convolution is performed using 1 × 1 kernels to achieve channel fusion at a relatively low computational cost. This decomposition enables the design of deeper or wider models within the same computational budget, allowing for more layers or channels to be incorporated in order to strengthen feature representation capacity. Consequently, the decoder is able to reconstruct hotspot segmentation maps with rich details and sharp boundaries without compromising efficiency. The detailed architecture of this module is presented in Figure 2.
Figure 2. Architecture of the decoder module
The adoption of depthwise separable convolution in the decoder module was not solely intended as a computational “lightweighting” strategy; its deeper rationale lies in the optimization of computational resource allocation to ensure the precision of feature reconstruction, thereby directly supporting the objective of high-accuracy extraction of urban carbon emission hotspots. The central role of the decoder is to effectively integrate the highly compressed and abstract semantic features (X4) output from the encoder with the spatially enriched shallow features (X1, X2, X3) transmitted through skip connections, and to reconstruct a segmentation map at the original image resolution with high fidelity. The computational resources conserved through depthwise separable convolution can be reallocated to more critical components of the model. In particular, the CBAM was incorporated into the decoder, and the additional computational overhead introduced by this attention mechanism was accommodated by the efficiency gains of depthwise separable convolution without rendering the model prohibitively complex to train or deploy. Furthermore, the reduced parameter count lowers the risk of overfitting, thereby improving the generalization capacity of the model across the highly diverse and complex scenarios presented by urban remote sensing imagery.
2.2.4 Attention module
In the decoder, the CBAM was incorporated to address the inherent challenges of semantic segmentation in remote sensing imagery and to enhance the precision of feature extraction for the specific task of identifying urban carbon emission hotspots. Remote sensing images are heavily affected by speckle noise, and emission hotspots are not uniformly distributed; their discriminative features are often entangled with background noise and other high-backscatter objects. Conventional convolutional operations treat all features equally, lacking selectivity, which results in susceptibility to irrelevant information and reduces the model’s ability to focus on critical targets. CBAM functions as a lightweight, adaptive feature optimizer capable of dynamically and selectively amplifying informative features while suppressing unimportant ones. Specifically, its channel attention mechanism assigns higher weights to channels that are more discriminative under the current semantic context, whereas the spatial attention mechanism highlights spatial regions within the feature map that are most likely to contain emission hotspots. By combining these two mechanisms, CBAM enables the model to act as an “intelligent spotlight,” penetrating noise interference in remote sensing imagery and precisely illuminating the feature channels and spatial regions most relevant to urban carbon emission hotspots, thereby laying a robust foundation for accurate pixel-level classification in subsequent segmentation tasks.
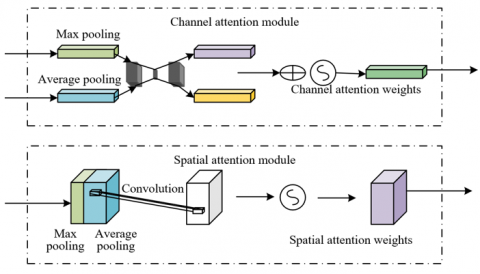
Figure 3. Schematic of channel and spatial attention computation in CBAM
The fundamental principle of the CBAM lies in the sequential computation of attention along channel and spatial dimensions, thereby achieving feature refinement from coarse- to fine-grained levels. The detailed computational process is illustrated in Figure 3. During upsampling in the decoder and recovering the feature map size, information loss and blurring are inevitable. CBAM is embedded within this process, operating on the upsampled feature maps to “purify” them. In the first stage, the channel attention submodule applies both global average pooling and max pooling to the input feature map. These pooling operations capture global contextual information and the most salient local feature point information. The results of these two operations are passed into a shared multilayer perceptron (MLP), which, through a compression-and-excitation mechanism, generates a one-dimensional channel attention weight vector. This weight vector is then multiplied with the original feature map, achieving amplification of key feature channels and suppression of less relevant ones. Assuming the channel and spatial attention weights of feature D are denoted as Mc(D) and Ms(D), average pooling as AvgPool, max pooling as MaxPool, the MLP as MLP, and the sigmoid activation as δ, the specific formulations are expressed as:
$\begin{align}& Mc\left( D \right)= \delta \left( MLP\left( AvgPool\left( D \right) \right)+MLP\left( MaxPool\left( D \right) \right) \right) \\\end{align}$ (3)
$Ms\left( D \right)=\delta \left( {{d}_{conv}}\left( \left[ AvgPool\left( D \right);\max Pool\left( D \right) \right] \right) \right)$ (4)
Subsequently, the channel-refined feature map enters the spatial attention submodule. Within this stage, average pooling and max pooling are applied along the channel dimension, and the two resulting feature maps are concatenated to form a two-channel representation. This representation is then passed through a convolutional layer to generate a two-dimensional spatial attention weight map, which explicitly indicates the relative importance of each spatial location. By multiplying this weight map with the input feature map, the network is guided to emphasize target regions while suppressing background noise. Denoting the feature map after channel attention as D' and after spatial attention as D'', with pointwise multiplication represented by $\otimes$, the formulations are as follows:
$D'=Mc\left( D \right)\otimes D$ (5)
$D''=Ms\left( D' \right)\otimes D'$ (6)
In the proposed model, CBAM operates synergistically with the depthwise separable convolution-based decoder: the latter restores spatial resolution efficiently, while the former ensures that the reconstructed features are of higher quality and more target-focused. This collaboration guarantees that the final segmentation output maintains boundary precision and regional completeness.
To maximize the preservation and utilization of precise positional information during the fusion of encoder and decoder features, a coordinate attention mechanism was introduced into the skip connections. Urban carbon emission hotspots, such as industrial complexes and building clusters, often exhibit boundaries that are regular and constitute critical discriminative features. However, as the encoder progressively extracts high-level semantic representations through successive downsampling, the spatial resolution of feature maps is inevitably reduced, resulting in the attenuation or even loss of fine-grained positional details of the target regions. Conventional channel or spatial attention mechanisms, when applying global pooling operations, compress two-dimensional spatial information into one-dimensional vectors or single scalar values. This process inevitably discards explicit coordinate information of objects within the spatial domain. For semantic segmentation tasks that demand pixel-level precision, such loss of positional fidelity is one of the major factors leading to inaccurate boundaries and the omission of small targets. Therefore, the explicit encoding of positional information into the attention mechanism is essential to improve the delineation accuracy of carbon emission hotspot boundaries.
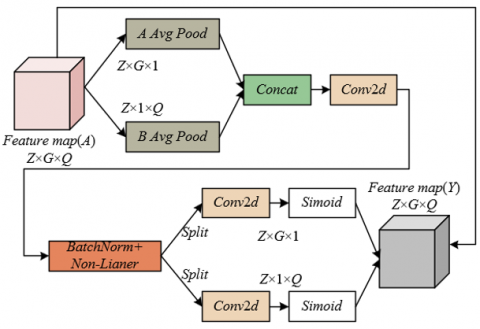
Figure 4. Architecture of the coordinate attention module
The fundamental innovation of the coordinate attention mechanism, compared with conventional attention approaches, lies in its decomposition of two-dimensional global pooling into two one-dimensional direction-aware operations. This design effectively avoids the loss of positional information. The architecture of the coordinate attention module is illustrated in Figure 4. Specifically, instead of compressing a G × Q feature map into a single point through standard global pooling, pooling is performed separately along the horizontal A-axis and the vertical B-axis. For an input feature map of size G × Q with Z channels, two specific pooling kernels are employed: (G, 1) and (1, Q). The (G, 1) kernel slides across the width dimension Q, pooling over the G pixels in each column to generate a feature map of size 1 × Q × Z. This representation captures long-range dependencies in the vertical direction, i.e., the contextual information within each column. Conversely, the (1,Q) kernel slides along the height dimension G, pooling over the Q pixels in each row to produce a feature map of size G × 1 × Z, thereby capturing long-range dependencies in the horizontal direction. This decomposition is the core of the coordinate attention mechanism, enabling the model to capture dependencies along both spatial directions while embedding explicit positional information into the resulting feature vectors. Assuming pixel positions in the feature map are denoted by u and k, the outputs along G and Q can be expressed as:
$C_{z}^{g}\left( g \right)=\frac{1}{Q}\sum\limits_{0\le u<q}{{{a}_{z}}\left( g,u \right)}$ (7)
$C_{z}^{q}\left( q \right)=\frac{1}{G}\sum\limits_{0\le u<G}{{{a}_{z}}\left( k,q \right)}$ (8)
After direction-aware feature encoding, the coordinate attention mechanism generates the final attention maps through a series of transformations. The two one-dimensional feature maps, 1 × Q × Z and G × 1 × Z, are concatenated and passed through a 1 × 1 convolution layer D1, followed by a non-linear activation function to achieve information fusion and transformation, producing an intermediate feature map d. Denoting the ReLU activation function by σ and the output feature map of the ReLU layer by d, the expression can be formulated as:
$d=\sigma \left( {{D}_{1}}\left( \left[ {{c}^{g}},{{c}^{q}} \right] \right) \right)$ (9)
Subsequently, the intermediate feature map d is split along the spatial dimension into two independent components: dg, representing horizontal weights, and dq, representing vertical weights. These two components are then processed by separate 1 × 1 convolution layers to adjust the number of channels back to that of output feature map channels Z. Finally, the Sigmoid activation function is applied to generate two independent direction-specific attention maps, hg and hq. The Sigmoid function ensures that the attention weights lie within the range of 0 to 1, reflecting the relative importance of each position in every channel. Because hg and hq are derived from one-dimensional features encoding explicit row and column information, they inherently carry precise coordinate information. Consequently, the resulting attention maps are “coordinate-aware,” allowing explicit identification of the specific row or column features that require enhancement or suppression. Assuming that convolution operations are denoted by Dg and Dq, and the Sigmoid activation function is denoted by δ, the expressions for hg and hq are given as follows:
${{h}^{g}}=\delta \left( {{D}_{g}}\left( {{d}^{g}} \right) \right)$ (10)
${{h}^{q}}=\delta \left( {{D}_{q}}\left( {{d}^{q}} \right) \right)$ (11)
The coordinate attention mechanism was applied to the skip connections of the U-Net architecture as a highly targeted design choice. The role of skip connections is to directly transfer shallow features from the encoder, which contain abundant spatial details and positional information, to the decoder at corresponding resolutions. This process supports the recovery of precise spatial details during upsampling. However, simple concatenation or summation represents an indiscriminate form of fusion, in which all information from the encoder feature maps is transmitted equally. By embedding coordinate attention prior to feature fusion, shallow feature maps transmitted from the encoder are first refined with coordinate attention weights. Specifically, the generated weight maps hg and hq are multiplied with the input feature map. The weight map hg emphasizes or suppresses features along specific columns, while hq performs the same operation along specific rows. Their combined effect produces a coordinate grid-like distribution of weights across the feature map. This allows the model to concentrate on rows and columns located along the boundaries of carbon emission hotspots, thereby substantially enhancing the representation of boundary regions during the feature fusion stage. Such capability is critical for delineating the contours of industrial zones, building clusters, and other urban hotspots, directly improving the quality of the final segmentation maps. Assuming the output value of the feature map is denoted as bz(u,k), the equation can be expressed as:
${{b}_{z}}\left( u,k \right)={{a}_{z}}\left( u,k \right)\times h_{z}^{g}\left( u \right)\times h_{z}^{q}\left( k \right)$ (12)
In summary, the incorporation of the coordinate attention mechanism provided holistic benefits to the semantic segmentation model designed for the extraction of urban carbon emission hotspots. Through a lightweight and efficient strategy, crucial positional information was embedded within the channel attention, resulting in coordinate-aware attention maps. This mechanism strengthened the ability to capture transitional features. In the context of carbon emission hotspot extraction, it enabled clearer differentiation between hotspot and non-hotspot transition zones. Ultimately, by precisely regulating skip connections, coordinate attention ensured that the decoder could more effectively leverage detailed information from the encoder, producing segmentation outputs with sharper boundaries and more accurate spatial localization. This not only enhanced the model’s segmentation accuracy but also improved its robustness in complex urban remote sensing scenarios, thereby strongly supporting the overarching research objective of high-precision extraction of urban carbon emission hotspots.
On the basis of the precise spatial distribution of urban carbon emission hotspots obtained from the proposed model, low-carbon economic regulation strategies can be developed with enhanced spatial specificity. The core principle of these strategies lies in decomposing the national “dual carbon” objectives into micro-level, visualized spatial units, thereby enabling a shift from broad, area-based control to targeted, site-specific interventions.
First, precise diagnosis and source-oriented regulation of carbon emissions must be achieved. Conventional accounting methods, which rely on administrative units or sectoral reporting, often suffer from coarse spatiotemporal granularity and significant delays. In contrast, the distribution maps of carbon emission hotspots generated by the model function as high-resolution “urban carbon diagnostic imagery,” providing a clear identification of precise spatial sources and intensity levels of emissions. Decision-making processes can therefore transcend traditional sector-based management and directly pinpoint industrial parks, transportation hubs, or high-density building clusters as focal points. For instance, when an industrial park is identified as exhibiting exceptionally high emission intensity, environmental authorities may prioritize its supervision and auditing, mandate process upgrades, promote energy substitution, or require participation in carbon trading markets. This approach enables point-to-point regulation of emission sources, ensuring that limited regulatory resources are concentrated in areas with the highest mitigation potential.
Second, optimization of urban spatial planning and land-use structures should be pursued. The spatial distribution of carbon emission hotspots is intrinsically linked to urban functional layouts. By superimposing hotspot maps onto master urban planning maps, the carbon efficiency of existing spatial structures can be systematically assessed. For example, if contiguous high-emission hotspots are detected in a newly developed urban district, planning authorities must critically evaluate the rationality of its industrial configuration, transportation system, and building energy standards. In response, future urban planning should avoid high-carbon lock-in pathways by promoting mixed-use development that supports a balance between employment and residence, thereby reducing commuting-related emissions. Large-scale integration of green spaces, carbon sink parks, and ecological zones should be established around hotspot areas to locally neutralize emissions. Furthermore, strict restrictions should be imposed on the placement of energy-intensive industries within ecologically sensitive zones or in upwind locations of dominant wind directions, ensuring that spatial structures provide a foundation for low-carbon urban development.
Third, industrial structure should be guided toward optimization and green upgrading. The spatial distribution of carbon emission hotspots directly reflects the carbon intensity of regional industrial structures. Economic development authorities can employ hotspot maps to assess the carbon productivity of industrial clusters within their jurisdictions. For clusters dominated by energy-intensive industries with low carbon productivity, clear roadmaps for transformation, upgrading, or relocation should be formulated. Economic instruments such as carbon taxation, green credit, and preferential financing mechanisms can be utilized to accelerate the transition toward cleaner production. Simultaneously, investment attraction strategies can prioritize “non-hotspot” or low-carbon zones as host sites for strategic emerging industries and high-end services. Stringent entry thresholds should be established to ensure that new projects are characterized by low environmental impacts, thereby optimizing the industrial structure from an incremental perspective and promoting a transition toward greener and more advanced economic development.
Fourth, differentiated transportation and building energy policies should be implemented. The model results enable finer-grained functional attribution of identified hotspots, which may correspond to large logistics hubs or central business districts. For transportation-dominated hotspots, transportation authorities should focus on developing public transit systems centred on these areas, optimizing logistics routes, promoting the use of new-energy freight vehicles, and even considering the establishment of low-emission zones. For building-dominated hotspots, housing and construction authorities should enforce stricter green building standards, mandate energy-efficiency retrofits for existing buildings, and accelerate the deployment of renewable energy technologies such as distributed photovoltaics and geothermal heat pumps. Compared with uniform emission reduction mandates, such spatially differentiated policies, grounded in functional attributes, are more targeted, feasible, and effective in reducing emissions.
Fifth, a closed-loop mechanism for dynamic monitoring and policy evaluation should be established. The semantic segmentation model is capable of periodic and rapid updates, thereby enabling continuous monitoring of urban carbon emission hotspots. Decision-makers can generate updated hotspot distribution maps on a quarterly or annual basis, allowing time-series comparisons to directly assess the effectiveness of low-carbon policies. If a hotspot decreases in size or intensity, policy effectiveness is indicated; conversely, expansion or intensification signals the need for policy reassessment and timely adjustment. This process forms a precise governance cycle of “monitoring-decision-implementation-re-monitoring,” transforming low-carbon economic regulation into a measurable, reportable, and verifiable scientific process, thereby significantly enhancing the modernization of urban governance. Ultimately, through such spatially explicit, data-driven, and fine-grained governance, the progressive decoupling of urban economic and social systems from carbon emissions can be achieved, advancing a high-quality and sustainable development trajectory.
To determine the most suitable encoder backbone for the improved U-Net framework, experiments were conducted to balance segmentation accuracy and computational efficiency, thereby ensuring both high-precision extraction and practical feasibility. Analysis of Table 1 indicates that as the PVTv2 model scale increases from B1 to B5, segmentation performance—including Acc, mIoU, and F1-score—improves consistently. The highest accuracy was achieved by PVTv2-B5, with Acc = 98.34% and mIoU = 95.02%. However, this performance gain was accompanied by a substantial increase in computational cost: compared with B1, B5 required 2.25 times more FLOPs and 3.75 times more parameters. Notably, the incremental improvement from B4 to B5 was marginal relative to the significant increase in computational overhead. Considering both precision and efficiency, PVTv2-B3 and PVTv2-B4 represent more balanced choices. Both configurations maintained high segmentation accuracy (mIoU > 94.2%) while offering moderate computational complexity. This balance provides an optimal cost-performance trade-off for large-scale urban remote sensing applications, enabling rapid and accurate extraction of carbon emission hotspots. Furthermore, these backbones establish a solid foundation for efficient integration with the decoder module in subsequent model design.
Table 1. Performance comparison of different PVTv2 backbone scales in urban carbon emission hotspot extraction
|
Model Version |
Carbon Emission Hotspot Segmentation Performance (%) |
Computational Complexity |
Parameter Count |
||
|
Accuracy (Acc) |
Mean Intersection over Union (mIoU) |
F1-Score |
Floating Point Operations (FLOPs) (GMac) |
Params (M) |
|
|
PVTv2-B1 |
97.76 |
93.41 |
93.44 |
4.15 |
18.10 |
|
PVTv2-B2 |
97.93 |
94.18 |
95.03 |
6.01 |
29.46 |
|
PVTv2-B3 |
98.08 |
94.27 |
95.13 |
8.82 |
49.33 |
|
PVTv2-B4 |
98.16 |
94.49 |
95.42 |
11.94 |
66.65 |
|
PVTv2-B5 |
98.34 |
95.02 |
95.51 |
13.49 |
86.05 |
Table 2. Performance comparison of different semantic segmentation models in urban carbon emission hotspot extraction
|
Model |
Multiband Reconstructed Remote Sensing Imagery (VV+VH+NewBand1+NewBand2) |
||||
|
Acc |
mIoU |
F1-Score |
|||
|
U-Net |
0.9677 |
0.9119 |
0.9274 |
||
|
DeepLabV3+ |
0.9729 |
0.9233 |
0.9364 |
||
|
PSPNet |
0.9774 |
0.9330 |
0.9440 |
||
|
HRNet |
0.9796 |
0.9408 |
0.9506 |
||
|
Swin-UNet |
0.9689 |
0.9074 |
0.9194 |
||
|
Proposed method |
0.9845 |
0.9541 |
0.9625 |
||
|
Model |
Single VV Band Remote Sensing Imagery (Baseline) |
Computational Complexity |
Parameter Count |
||
|
Acc |
mIoU |
F1-score |
FLOPs (GMac) |
Params (M) |
|
|
U-Net |
0.9596 |
0.8912 |
0.9089 |
30.69 |
17.26 |
|
DeepLabV3+ |
0.9635 |
0.9005 |
0.9169 |
26.53 |
9.16 |
|
PSPNet |
0.9738 |
0.9238 |
0.9362 |
30.73 |
29.44 |
|
HRNet |
0.9763 |
0.9308 |
0.9423 |
24.60 |
105.28 |
|
Swin-UNet |
0.9665 |
0.9006 |
0.9172 |
5.88 |
27.17 |
|
Proposed method |
0.9796 |
0.9396 |
0.9497 |
4.29 |
25.58 |
A systematic evaluation was conducted to benchmark the improved U-Net framework against representative semantic segmentation models in the extraction of urban carbon emission hotspots, while also assessing the effectiveness of the multiband data reconstruction strategy. Analysis of Table 2 reveals three key findings. First, when multiband reconstructed remote sensing imagery was adopted as input, the proposed method achieved the highest segmentation performance among all compared models, with Acc = 98.45%, mIoU = 95.41%, and F1-score = 96.25%. These results demonstrate the effectiveness of the architectural enhancements incorporated in the proposed framework. Second, comparison across datasets indicates that all models performed consistently better with multiband reconstructed imagery than with single VV band imagery. The proposed method exhibited the most significant improvement, with an mIoU increase of approximately 1.45 percentage points, providing strong evidence that the reconstruction strategy effectively enhances the representation of carbon emission hotspot information in remote sensing imagery. Finally, in terms of computational efficiency, the proposed method achieved the highest accuracy while maintaining relatively low complexity. Its FLOPs were markedly lower than those of classical models such as U-Net and Pyramid Scene Parsing Network (PSPNet), and comparable to those of Swin-UNet, thereby demonstrating superior computational efficiency. Taken together, these results confirm that the proposed approach achieves an optimal balance between accuracy and efficiency. Its superiority stems from the targeted combination of data reconstruction and architectural refinement, providing a reliable solution for the precise and efficient extraction of urban carbon emission hotspots.
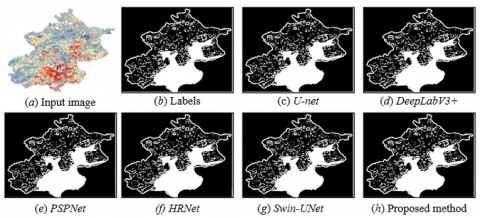
Figure 5 presents a visual comparison that directly validates the superiority of the improved U-Net framework in urban carbon emission hotspot extraction, particularly in terms of boundary precision and detail preservation. As shown, when compared with conventional architectures such as U-Net and DeepLab Version 3 Plus (DeepLabV3+), the proposed method generates hotspot boundaries that are clearer and more complete, substantially reducing instances of mis-segmentation and boundary blurring. In comparison with PSPNet and High-Resolution Network (HRNet), the proposed approach demonstrates enhanced accuracy in delineating smaller hotspots within complex backgrounds, resulting in a marked reduction in omission errors. Relative to the purely Transformer-based Swin-UNet, the proposed method, which is built on a PVTv2 hybrid backbone, preserves local spatial details more effectively while maintaining global consistency. This advantage mitigates the over-smoothing effect that can arise when Transformer architectures are applied to high-resolution remote sensing imagery. Taken together, these results indicate that by integrating the global modeling capacity of Transformers with an attention-guided feature fusion strategy, the proposed method achieves the most precise and detailed extraction of urban carbon emission hotspots. Its segmentation outputs are closest to the ground-truth labels, thereby providing a high-quality spatial data foundation for subsequent quantitative analysis and the formulation of low-carbon regulatory strategies.
Figure 5. Comparative performance of different semantic segmentation models in urban carbon emission hotspot extraction
Table 3. Comparative performance of different attention mechanisms applied to the decoder and skip connections
|
Attention Mechanism |
Decoder (Post-Upsampling) |
Skip Connection (During Feature Fusion) |
||||
|
Acc |
mIoU |
F1-Score |
Acc |
mIoU |
F1-Score |
|
|
Baseline (PVT-UNet+DS) |
0.9829 |
0.9485 |
0.9556 |
0.9829 |
0.9485 |
0.9556 |
|
+SRA (PVT-native) |
0.9830 |
0.9489 |
0.9559 |
0.9832 |
0.9495 |
0.9563 |
|
+Efficient Multi-scale Attention (EMA) |
0.9835 |
0.9501 |
0.9565 |
0.9830 |
0.9490 |
0.9559 |
|
+Deformable Attention |
0.9832 |
0.9493 |
0.9562 |
0.9838 |
0.9507 |
0.9569 |
|
+Frequency Channel Attention (FCA) |
0.9831 |
0.9492 |
0.9561 |
0.9828 |
0.9487 |
0.9557 |
|
+CBAM |
0.9838 |
0.9505 |
0.9567 |
0.9831 |
0.9492 |
0.9562 |
|
+Coordinate Attention |
0.9830 |
0.9491 |
0.9560 |
0.9842 |
0.9514 |
0.9573 |
An ablation study was conducted to systematically evaluate the influence of different attention mechanisms when applied at two critical stages—the decoder and the skip connections—in order to determine their optimal deployment for urban carbon emission hotspot extraction. Analysis of Table 3 reveals that when attention modules were incorporated into the decoder to optimize features after upsampling, the CBAM achieved the strongest performance, with an accuracy of 0.9838 and an mIoU of 0.9505. This result indicates that the combined channel-spatial attention design of CBAM effectively selects and enhances hotspot-relevant features, thereby improving feature reconstruction quality. Deformable Attention also performed well in this position, suggesting that its adaptive perception of irregularly shaped hotspots is beneficial for feature refinement. In contrast, when attention mechanisms were integrated into skip connections to enhance feature fusion, Coordinate Attention achieved the global best performance, with an accuracy of 0.9842 and an mIoU of 0.9514, surpassing all other mechanisms. This outcome strongly validates the advantage of Coordinate Attention in decomposing spatial dimensions and embedding precise positional information, which enables superior integration of the encoder’s detailed spatial features with the decoder’s high-level semantic representations. Such capability is particularly critical for tasks requiring precise delineation of hotspot boundaries. These findings demonstrate that within the improved U-Net framework, CBAM is best suited for feature reconstruction and enhancement in the decoder, whereas Coordinate Attention is the optimal choice for skip connections, where precise, position-aware feature fusion is required. This targeted deployment of specialized attention mechanisms for distinct subtasks constitutes one of the key factors underlying the superior performance of the proposed model.
Table 4. Performance comparison of ablation experiments with different model configurations
|
Model Configuration |
Acc |
mIoU |
F1-Score |
|
U-Net (baseline) |
0.9677 |
0.9119 |
0.9274 |
|
+PVTv2 encoder (replacing original encoder) |
0.9793 |
0.9418 |
0.9503 |
|
+Depthwise separable convolution decoder |
0.9829 |
0.9485 |
0.9556 |
|
+Coordinate Attention skip connections |
0.9831 |
0.9490 |
0.9569 |
|
+ CBAM attention decoder (final model) |
0.9845 |
0.9541 |
0.9625 |
To evaluate the individual contributions of each proposed module to the extraction of urban carbon emission hotspots, ablation experiments were conducted. As shown in Table 4, replacing the U-Net baseline encoder with the PVTv2 backbone yielded a substantial improvement, with the mIoU increasing from 0.9119 to 0.9418. This demonstrates the strong capability of Transformer-based backbone in capturing global semantic features from remote sensing imagery. Building on this improvement, the introduction of a depthwise separable convolution decoder further enhanced all performance metrics, with mIoU rising to 0.9485. This indicates that the design not only improved segmentation accuracy but also optimized computational efficiency. Subsequently, the incorporation of Coordinate Attention into the skip connections slightly increased mIoU to 0.9490, confirming its role in facilitating effective fusion of shallow and deep features while improving boundary localization. Finally, the integration of the CBAM into the decoder resulted in the best overall performance, achieving an mIoU of 0.9541 and an F1-score of 0.9625. These findings provide strong evidence that the complete architecture—comprising the PVTv2 encoder, depthwise separable convolution decoder, and dual attention mechanisms—is synergistically effective. Each module contributed indispensably to the final segmentation performance, collectively enabling precise and reliable extraction of urban carbon emission hotspots.
Based on the constructed model, a representative industrial city was selected to conduct a case study of low-carbon regulation practices and effectiveness verification, guided by the high-precision extraction of carbon emission hotspots. The optimized semantic segmentation model was first applied to continuous remote sensing imagery of the city, generating a spatiotemporally refined distribution map of carbon emission hotspots. Analysis revealed that the northern industrial park exhibited the most intense and expansive contiguous hotspot features. When overlaid with urban planning maps, these hotspots corresponded precisely to clusters of large-scale chemical and metallurgical enterprises. This spatially explicit diagnosis overcame the limitations of conventional statistical data, which can only provide aggregate emissions at coarse administrative scales, thereby enabling the direct identification of key emission sources.
On this basis, rather than adopting generalized measures such as power rationing or production curtailment, the city implemented a targeted “Industrial Park Green Upgrade Plan.” First, enterprises were subjected to tiered regulation according to hotspot intensity, with those located in the core area mandated to install online monitoring devices and undergo comprehensive carbon audits. Second, priority financial support was provided through a municipal green fund to facilitate projects such as coal-to-gas conversion of kilns, waste heat recovery for power generation, and full-scale deployment of rooftop photovoltaic systems. Third, the hotspot boundaries were incorporated into urban planning constraints, prohibiting the establishment of new high-energy-consuming projects within the affected area. To scientifically assess policy effectiveness, the same model was reapplied to updated imagery one year later. The results indicated that the overall hotspot intensity of the industrial park decreased by approximately 15%, while the spatial extent of the core hotspot contracted by 20%. The originally contiguous hotspot morphology displayed clear signs of “cooling” and fragmentation. In sharp contrast, the southern logistics hub—where equally stringent regulatory interventions had not been implemented—showed no significant changes in hotspot intensity or extent. This case provides compelling evidence that spatial information derived from remote sensing-based intelligent extraction of carbon emission hotspots can effectively support the transition from macro-level regulation to fine-grained, source-specific interventions. Furthermore, through continuous monitoring, a closed-loop governance framework of “precise problem detection, scientifically informed strategy design, and objective outcome evaluation” can be established, substantially enhancing the precision, scientific rigor, and intelligence of urban climate governance.
This study was conducted with the central objective of semantic segmentation of remote sensing imagery for the extraction of urban carbon emission hotspots, advancing from methodological innovation to applied exploration. At the technical level, a comprehensive solution was systematically proposed to address the inherent challenges of remote sensing imagery and semantic segmentation tasks. First, input data were reconstructed by generating enhanced feature bands through the combination of VV and VH polarizations, thereby effectively accentuating the spectral and spatial signatures of carbon emission hotspots. Second, an improved semantic segmentation model was designed based on the U-Net architecture. The model’s innovations lie in the integration of PVTv2 as the encoder to strengthen global feature learning and noise resistance, the incorporation of depthwise separable convolutions and the CBAM mechanism within the decoder to optimize computational efficiency and feature reconstruction, and the embedding of coordinate attention within skip connections to achieve precise fusion of shallow details with high-level semantic features. Experimental results demonstrated that both the data reconstruction strategy and the proposed model architecture delivered consistently superior performance in hotspot extraction compared to multiple state-of-the-art benchmarks, as evidenced by both quantitative metrics and visual segmentation outcomes. These findings verified the advancement and robustness of the approach. At the application level, the study extended beyond technical implementation by employing an urban case study to illustrate how high-precision hotspot distribution maps can be translated into actionable low-carbon economic regulation strategies. Through time-series remote sensing monitoring, the effectiveness of these policies was quantitatively assessed, thereby establishing an integrated technological chain from “data-driven sensing” to “intelligent decision-making.” This chain highlights the substantial applied value of the research in advancing refined, intelligent urban governance.
Despite the demonstrated effectiveness of the proposed framework, several limitations remain. First, the training and validation of the model were primarily based on data from a specific region and time period, and its generalization capacity across diverse climatic zones and heterogeneous urban morphologies has yet to be systematically validated. Second, the delineation of “carbon emission hotspots” relied mainly on the correlation between backscatter intensity from remote sensing imagery and the intensity of human activities. This represents an indirect inference rather than a direct measurement, as rigorous synchronization and calibration with ground-based emission observations were not performed. Third, the current model primarily addresses static spatial distributions and lacks the capability to capture the dynamic evolution of emission hotspots and their driving mechanisms in real time. Future research can therefore proceed along several directions. One promising avenue is the integration of multi-source remote sensing data to enable a more comprehensive characterization of urban carbon metabolism. Another is the advancement of lightweight models and their deployment within edge computing frameworks to achieve large-scale, near-real-time monitoring of carbon emissions. In addition, coupling deep learning models with urban energy systems and socio-economic datasets could extend the scope of analysis beyond the question of “where emissions occur” to address “why emissions occur” and “how they can be more effectively regulated.” Such developments would provide deeper decision support for urban low-carbon planning.
This paper was supported by The National Social Science Fund of China (Grant No.: 24XJY016), Chongqing Social Science Planning Project (Grant No.: 2019QNJJ18), Project of Postdoctoral Research Station of Luzhou Laojiao (Grant No.: 2024Q286).
[1] Hussein, A.M., Osman, B.M. (2024). The impact of rapid urbanization on poverty levels in the context of climate change: Empirical evidence from Somalia. Challenges in Sustainability, 12(4): 281-291. https://doi.org/10.56578/cis120404
[2] Nassanga, G. (2020). Translating the global climate change challenge into action as reflected in Uganda’s media. Journal of African Media Studies, 12(3): 267-281. https://doi.org/10.1111/j.1528-3585.2012.00480.x
[3] Wedari, L.K., Darmawan, M.F., Istiqomah, K.A.P. (2025). Bibliometric analysis of peer-reviewed literature on sustainability reports in the context of climate change from 2017 to 2024. International Journal of Environmental Impacts, 8(1): 21-31. https://doi.org/10.18280/ijei.080103
[4] Wang, Z., Chen, W. (2022). Evaluation of coordinated development of logistics development and low-carbon economy in Wuhan based on big data. Wireless Communications and Mobile Computing, 2022(1): 1314699. https://doi.org/10.1155/2022/1314699
[5] Kim, Y.J., Soh, M., Cho, S.H. (2022). Identifying optimal financial budget distributions for the low-carbon energy transition between emerging and developed countries. Applied Energy, 326: 119967. https://doi.org/10.1016/j.apenergy.2022.119967
[6] Yi, Y., Wang, Y., Li, Y., Qi, J. (2021). Impact of urban density on carbon emissions in China. Applied Economics, 53(53): 6153-6165. https://doi.org/10.1080/00036846.2021.1937491
[7] Mutani, G., Tundo, A., Capezzuto, P. (2025). Renewable energy communities in Italy: A national framework for sustainable cities. Challenges in Sustainability, 13(3): 398-411. https://doi.org/10.56578/cis130306
[8] Phouratsamay, S.L., Cheng, T.C.E. (2019). The single-item lot-sizing problem with two production modes, inventory bounds, and periodic carbon emissions capacity. Operations Research Letters, 47(5): 339-343. https://doi.org/10.1016/j.orl.2019.06.003
[9] Hutchins, M.G., Colby, J.D., Marland, G., Marland, E. (2017). A comparison of five high-resolution spatially-explicit, fossil-fuel, carbon dioxide emission inventories for the United States. Mitigation and Adaptation Strategies for Global Change, 22(6): 947-972. https://doi.org/10.1007/s11027-016-9709-9
[10] Ding, X.Y., Hu, W.J., Hu, G.B., Liu, F. (2023). Mineral element identification in remote sensing imagery: A fusion approach using CH-Tucker decomposition and RFDNet. Traitement du Signal, 40(4): 1501-1509. https://doi.org/10.18280/ts.400418
[11] Tratt, D.M., Neff, J.M., Valinia, A. (2008). Analysis of laser remote sensing technology needs in the Earth sciences: a decadal-scale outlook. Journal of Applied Remote Sensing, 2(1): 023546. https://doi.org/10.1117/1.3036940
[12] Liu, C.Z., Song, Y.P., Zhang, R.H., Qian, L.P., Yi, J.X. (2020). Application research of big data technology in cotton remote sensing monitoring. Fresenius Environmental Bulletin, 29(7A): 5885-5891.
[13] Zhang, Q., Zhang, J., Lu, S., Liu, Y., Liu, L., Wang, Y.Y., Cao, M.Y. (2023). Multi-resolution feature extraction and fusion for traditional village landscape analysis in remote sensing imagery. Traitement du Signal, 40(3): 1259-1266. https://doi.org/10.18280/ts.400344
[14] Gashnikov, M.V., Kuznetsov, A.V. (2022). Detection of fake remote-sensing data. Optical Memory and Neural Networks, 31(1): 16-21. https://doi.org/10.3103/S1060992X22010052
[15] Duan, M., Duan, L. (2021). High spatial resolution remote sensing data classification method based on spectrum sharing. Scientific Programming, 2021(1): 4356957. https://doi.org/10.1155/2021/4356957
[16] Petrovska, B., Atanasova-Pacemska, T., Stojkovic, N., Stojanova, A., Kocaleva, M. (2021). Machine learning with remote sensing image data sets. Informatica, 45(3): 347-358. https://doi.org/10.31449/inf.v45i3.3296
[17] Pradhan, M.K., Minz, S., Shrivastava, V.K. (2020). Entropy query by bagging-based active learning approach in the extreme learning machine framework for hyperspectral image classification. Current Science, 119(6): 934-943.
[18] Marushko, E.E., Doudkin, A.A. (2020). Methods of using ensembles of heterogeneous models to identify remote sensing objects. Pattern Recognition and Image Analysis, 30(2): 211-216. https://doi.org/10.1134/S1054661820020108
[19] Shi, W., Du, C., Gao, B., Yan, J. (2021). Remote sensing image fusion using multi-scale convolutional neural network. Journal of the Indian Society of Remote Sensing, 49(7): 1677-1687. https://doi.org/10.1007/s12524-021-01353-2
[20] Khalifa, A.F., Badr, E. (2023). Deep learning for image segmentation: A focus on medical imaging. Computers, Materials and Continua, 75(1): 1995-2024. https://doi.org/10.32604/cmc.2023.035888