Ashok Kumar Kavuru*![]() | Rajesh Kumar Patjoshi
| Rajesh Kumar Patjoshi![]() | Rakhee Panigrahi
| Rakhee Panigrahi![]()
© 2025 The authors. This article is published by IIETA and is licensed under the CC BY 4.0 license (http://creativecommons.org/licenses/by/4.0/).
OPEN ACCESS
Diabetic retinopathy (DR) is a major complication of diabetes and remains a leading cause of irreversible vision loss if not diagnosed in its early stages. Timely and accurate detection is critical for effective clinical intervention. Traditional diagnostic techniques, are often constrained by variability in accuracy, dependency on expert ophthalmologists, and limited accessibility in low-resource environments. To address these challenges, this study presents a hybrid deep learning framework that integrates a Convolutional Neural Network (CNN) with a Radial Basis Function (RBF) classifier, enhanced by Multi-Scale Discriminative Robust Local Binary Pattern (MS-DRLBP) feature extraction. The model further incorporates a Particle Swarm Optimization (PSO) strategy for hyperparameter tuning, enabling faster convergence and improved classification performance. The preprocessing pipeline applies noise suppression, morphological filtering, and Otsu’s thresholding to achieve precise vessel segmentation. For evaluation, the proposed system is trained and validated using a combination of three benchmark datasets APTOS 2019, EyePACS, and Messidor ensuring robustness and strong generalization across diverse image sources. Compared to standard diagnostic procedures, our method proves much better to classify the DR stages. We achieved an accuracy 98.13%, precision of 97%, sensitivity 96.2% and specificity 98.5%. Through this research, experts can achieve more accurate DR diagnoses with the help of data collected from different public sites. It helps expand the discussion about the effectiveness of hybrid networks in the field of medical imaging. By combining these modern methods, we can create more accessible and accurate ways to diagnose and treat diabetic vision damage, lessening its global reach.
diabetic retinopathy, MS-DRLBP, CNN-RBF, Otsu’s thresholding, preprocessing
According to WHO health statistics, maintaining high blood glucose levels causes damage to blood vessels in many parts of the body and can bring on various complications. Some complications of diabetes include loss of sight and blindness from problems with the eye’s blood vessels, sores and loss of feet from nerve problems and kidney problems [1]. According to the 2025 edition of the International Diabetes Federation (IDF) Diabetes Atlas, diabetes affects 11.1% of adults aged 20-79 years worldwide—equivalent to roughly one in every nine individuals. Alarmingly, more than 40% of these adults remain undiagnosed. Projections suggest that by 2050 the prevalence will rise to about one in eight adults, representing nearly 853 million people, which marks a 46% increase compared to current figures. Approximately one-third of diabetic patients are at risk of developing vision loss during their lifetime [2]. Retinal fundus imaging is a convenient way to study these disorders and their progression. Particularly for diabetics, color fundus images highlight blood vessels to identify any early signs of diabetes-related retinal disease. When the disease is found and treated early, it can be more successfully managed and prevented from getting worse [3]. AI makes it possible to accurately assess the severity of DR using image pre-processing and deep learning algorithms [4]. The ongoing advancements in this area have made it possible to combine AI into automated retinal vessel detection [5]. Those with uncontrolled diabetes are more likely to develop DR since excess diabetes can injure the retinal vessels. It is necessary to find and separate the blood vessels in the retina for DR diagnosis and to prevent premature vision loss [6]. Doctors now rely on retinal vascular segmentation technology which makes the job easier for both experienced and beginner ophthalmologists [7].
Therefore, dividing retinal vessels by programs is very important for both diagnosing and treating DR at various stages. In clinical imaging, there is a need for new ways to automate and improve how retinal problems like DR are recognized. We present a strategy that combines Multi-Scale Discriminative Robust Local Binary Patterns (MS-DRLBP) with a Convolutional Neural Network Radial Basis Function (CNN-RBF) based classifier. The method aims to simplify the segmentation of retinal blood vessels and avoid drawbacks of manual segmentation; hence it greatly increases the accuracy and effectiveness of diagnosing DR. By combining deep learning and pattern recognition, our method improves the reliability and accurately diagnoses DR. We demonstrate in the study that by using this approach instead of previous ones, it improves the way different retinal illnesses can be identified. Correspondingly, numerous research works include AI in the identification of age-related macular degeneration, glaucoma and DR. In previous work, researchers used machine learning and deep learning approaches to organize retinal diseases. Local binary patterns offer a practical approach for feature extraction; however, since the features are local, they may not be reliable for identifying disease classes. Additionally, to work well, CNNs often need access to a big set of data that has been annotated and a computer that can handle the workload. Better tools for correctly spotting and grouping retinal disorders are necessary so that scientific research can advance in this field. Our suggested research explains an automatic threshold technique for diagnosing DR using blood vessel segmentation. In addition, to fix earlier issues, we use a classifier that pairs CNN-RBF and we modify DRLBP. The new search algorithm looking for boundaries in objects helps the classifier focus on their texture and shape for better identification. Segmented fundus image features allow us to change the usual RBF training, so the model can use data that is not fully labeled for improved classification.
Contributions of this paper include:
• We use three well-known public datasets APTOS 2019, EyePACS, and Messidor to cover a wide range of retinal images.
• To better highlight disease patterns, we apply a multi-scale feature extraction method called MS-DRLBP, which captures detailed retinal textures.
• For classification, we propose a hybrid model that combines the feature learning power of CNN with the decision-making ability of RBF classifiers.
Although RBF have many benefits, incorporating them into contemporary CNN designs can be difficult because of their nonlinear activation, which can obstruct effective gradient flow, and the presumption of fixed MS-DRLBP features with preset cluster centers at the beginning.
The structure of the remaining sections is as follows: We examine earlier studies in Section 2, and Section 3 gives the dataset and methodology, including our suggested strategy. Section 4 contains the experimental findings that indicate the efficacy of our model versions on the dataset. Section 5 contains the paper's conclusion.
CNNs are applied to the image classification and segmentation tasks in various domains including DR, plant disease identification [8, 9]. The retinal blood vessel morphology assists in classifying severity and identifying the subsequent phases of a few disorders [10]. Burewar et al. [11] proposed a retinal segmentation and region merging with CNN to detect the stages of DR with U-Net segmentation and CNN model is employed to automatically detect and categorize retinal fundus images into five distinct disease stages according to their severity and achieved the accuracy up to 93.33%.
Sambyal et al. [12] proposes an enhanced U-Net integrated with residual connections was developed, incorporating periodic shuffling and sub-pixel convolution for neighbour-based resizing. The model was trained and validated on two open-source datasets, Indian Diabetic retinopathy Image Dataset (IDRiD) and e-ophtha, achieving 99.88% accuracy on IDRiD and 99.98% on e-ophtha.
Kumar et al. [13] approach applies pre-processed colour fundus images, where vessel structures are identified through morphological techniques to enhance segmentation. The workflow is organized into five phases: image enhancement, vessel extraction, disc segmentation, fovea detection, feature derivation, and final classification. For optic disc segmentation, a watershed transform is employed, while disease categorization is carried out using a RBF of the neural network. The method reports sensitivity of 87% and specificity of 93%.
Porwal et al. [14] article describes the setup and outcomes of a challenge on the IDRiD was introduced with three primary tasks: lesion segmentation, grading of disease severity, localization of retinal landmarks and optic disk segmentation. Qureshi et al. [15] describe all of the CAD systems built using various computational intelligence and image processing approaches. The limitations and potential tendencies of current CAD systems are also thoroughly addressed to assist researchers. Moreover, potential CAD systems are also compared in terms of statistical parameters to quantitatively evaluate them.
According to Das' paper [16], the method employs a CNN with a combination of squeeze and excitation, bottleneck and convolution and pooling layers for both class-wise and two-class classification. We use DIARETDB1 (standard DR Dataset) and a collection of fundus scans, supplied by a medical institution, both with normal and affected retinas for evaluation of the proposed algorithm. The resulting accuracy was 98.7% and precision 97.2% respectively on this dataset.
Qiao et al. [17] designed a method based on CNN algorithms to image detection and segmentation in microaneurysm fundus images both quick and efficient using GPUs. The algorithm for semantic segmentation tells the system whether the analysed fundus picture indicates a healthy or infected state. The process separates image pixels that share a similar semantic to discover the feature of microaneurysms. Because an automatic tool can give ophthalmologists information about which stage of NPDR is present in a patient’s images.
Ozbay [18] discuss ADL with a new form of multi-layer architecture that helps automatically detect DR stages. The preprocessing stage of the ADL system, the retina image is divided into sections with the help of the ABC algorithm and a threshold setting that reflects the image histogram values. In addition, ADL-CNN is a tag-efficient CNN that can automatically detect important parts of the retina for analysis. The process consists of two major steps. At this stage, images are chosen to see if the AI can identify simple or difficult patterns in the retina by using accurate labels in the training samples. Second, the masks highlight the key lesion areas and segment the region of interest in the retinal images. To evaluate its performance, the ADL-CNN model is tested against the most recent approaches on the identical dataset. Using statistical measures such as classification accuracy, detection sensitivity, diagnostic specificity, and F-score can help determine how well the system operates. The accuracy of the model when applied to the EyePACS dataset with 35,122 images reached 99.66%.
Maaliw et al. [19] used a feature extraction strategy employed within a comprehensive pipeline that integrated multiple preprocessing steps, a DR-UNet segmentation framework with spatial pyramid pooling, and an attention-driven CNN enhanced by residual modules. Experimental evaluation showed segmentation accuracies of 87.10% and 84.50%, while classification performance reached 99.20%.
Chen et al. [20] investigated Deep Learning (DL) techniques to categorize fundus images depending on DR seriousness. To highlight lesions in DR images this paper suggests a two-phase classification model named DR-Net. The first stage in this study is SE-Block-ResNet (SR-Net), with Multiple lesions-TransUnet-Segmentation-Net (MT-SNet) making up the second and SE-Block-RepVGG (SRVGG) forming the third phase. At the start, ST-Net classifies both NPDR and PDR images. In the second step, many lesions are first segmented and then the NPDR images are separated and classified separately. Using DDR, the accuracy is higher by 2.21% than the approach presented in the new paper.
Deshmukh et al. [21] proposed a study that introduced three deep learning–based models for retinal vessel recognition, employing region-oriented segmentation. The workflow includes four phases: preprocessing, data augmentation, training and evaluation of the model. Augmented retinal images are processed by the three models for training prior to segmentation. Experiments were carried out on publicly available datasets DRIVE, STARE, and HRF. Model-3 demonstrated superior detection of fine vessels in HRF images. The results of these models were benchmarked against other advanced vessel segmentation techniques on the STARE, DRIVE, and HRF datasets.
To enhance the diagnosis of retinal disease, mainly DR, we use innovative picture preprocessing and development special classifier in our work. The MS-DRLBP approach is employed to integrate randomization-inspired strategies within a combined CNN-RBF framework. Figure 1 presents a complete workflow for DR detection using a hybrid deep learning model. Retinal images from APTOS 2019, Messidor, and EyePACS datasets undergo preprocessing steps such as channel extraction, noise suppression, and enhancement. Morphological filtering and Otsu’s thresholding are then applied to highlight vessels and lesion regions. Feature representation is obtained through MS-DRLBP for texture analysis and CNN for deep feature learning. Finally, classifiers including RBF, SVM, and the proposed CNN-RBF hybrid are used to classify the images into five DR stages: No DR, Mild, Moderate, Severe, and PDR. By using a combination of deep learning and pattern recognition, this classifier offers a dependable system for discovering retinal problems.
Figure 1. Developed architecture
3.1 Data acquisition
The retinal fundus images and their related annotations or diagnoses are normally gathered for research on DR. These are the Diabetic Retinopathy Datasets from EyePACS, APTOS, APTOS (Gaussian Filtered) and Messidor. This combining dataset increases diversity in imaging conditions, acquisition devices, and patient demographics, thereby reducing overfitting to a single domain. In total, the data set contains 92,501 jpg files which were divided randomly into train (60%) and test (40%) [22]. About 55% more data was added to the dataset by manually altering it. All pictures have been adjusted to 600x600 pixels. Therefore, the size of the data set was cut by more than half (18.5GB to 3.8GB), helping lower resource use for tasks such as data augmentation and resizing in the training process.
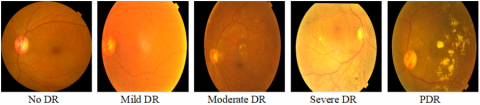
Figure 2. Types of DR based on fundus features
For clearer understanding, refer to the retinal fundus images that represent various phases of DR. Figure 2 displays example images corresponding to the five graded severity levels of DR. Below Table 1. gives the image distribution between 3 benchmark datasets. The decision to use data augmentation led to 60:40 as the training and test split and total number of images was raised to 143,669 and data augmentation was performed exclusively on the training set, with care taken to avoid any overlap with the test samples.
Table 1. Image distribution in dataset
|
Data Set |
No DR |
Mild DR |
Moderate DR |
Severe DR |
PDR |
Dataset Wise Total |
|
APTOS 2019 |
1800 |
400 |
1000 |
200 |
300 |
3700 |
|
EyePACS |
68000 |
5000 |
11000 |
2000 |
1601 |
87601 |
|
Messidor |
540 |
150 |
250 |
130 |
130 |
1200 |
|
DR Type wise total |
70340 |
5550 |
12250 |
2330 |
2031 |
92501 |
Here's Table 2 describing the types of DR with descriptions for each type. It outlines the different progression levels of DR along with their key clinical characteristics. The disease advances from early signs like microaneurysms to the proliferative stage, where abnormal vessel growth and severe vision loss can occur.
Table 2. Type of DR with their effects
|
Type of DR |
Description |
|
PDR |
Risk of severe vision loss due to bleeding and retinal detachment from new grown blood vessels. |
|
Severe DR |
Many blood vessels are blocked; retina signals new vessels to form. |
|
Moderate |
Some blood vessels become blocked, causing reduced blood flow to parts of the retina. More microaneurysms and hemorrhages. |
|
Mild DR |
Presence of small microaneurysms. No symptoms in this stage. |
3.2 Dataset preprocessing
The presence of noise in the red and blue channels is diminished by removing the green channel from the fundus images. This green channel provides optimal balance between brightness and contrast, allowing clearer visualization of blood vessels and retinal lesions. In retinal imaging, the green channel enhances visibility by highlighting blood vessels and lesions, including microaneurysms and hemorrhages, against the background. The information from the green channel is improved by using CLAHE, which concentrates the area to a small, tiny region for better contrast. CLAHE increases the visibility of arteries and veins, most prominently in areas where things are darker in the retina [23]. The CLAHE algorithm is represented by Eq. (1):
$\mathrm{I}_{\text {enhanced }}=$ CLAHE(I, clipLimit, tileGridSize) (1)
where, I correspond to the input image, clipLimit controls the contrast enhancement, tileGridSize defines the size of the contextual regions.
A Gaussian filter is an image-blurring filter that uses a Gaussian function for weighting pixel values [24]. It's widely used in image processing to reduce noise and detail, acting as a smoothing filter and it can operate according to Eq. (2):
$G(x, y)=\frac{1}{2 \pi \sigma^2} \exp \left(-\frac{x^2+y^2}{2 \sigma^2}\right)$ (2)
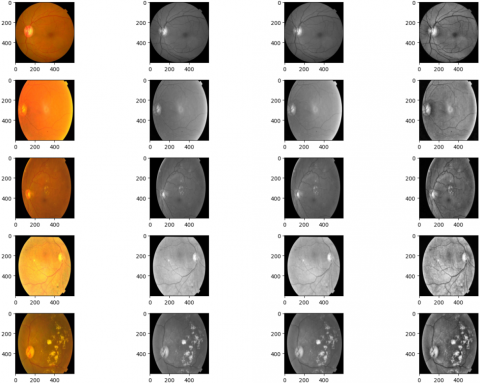
The pixel coordinates (x, y) are relative to the kernel's center, and σ is the standard deviation. Images after all the preprocessing steps. The sequence of preprocessing steps applied to retinal fundus images is illustrated in Figure 3.
Original Image Green Channel Denoising CLAHE Filter
Figure 3. Retinal fundus image preprocessing framework
3.3 Morphological operations
Morphological image processing involves a set of non-linear techniques used to analyze and modify the shape or structure of objects within an image. Morphological processing methods are commonly used on DR images to enhance and isolate significant structural features such as blood vessels and lesions [25]. These techniques, which include dilatation, erosion, opening, and closing, are employed in the preprocessing step to reduce noise, fill gaps, and increase the clarity of retinal structures. For example, morphological opening reduces small light artifacts and background noise, whereas closing can reconnect fractured vessel segments. Such changes increase the contrast of diseased regions, allowing for better segmentation and feature extraction. These improved images form a more accurate foundation for subsequent categorization tasks in automated DR diagnosis systems.
3.3.1 Erosion
Erosion of a set A by a structuring element B is the collection of all positions z for which B, when shifted so that its origin aligns with z, remains entirely within A. Shrinks bright regions and removes small noise.
$A \ominus B=\left\{z \mid(B)_z \subseteq A\right\}$ (3)
3.3.2 Dilation
Dilation of a set A by a structuring element B is defined as the set of all positions z where, when the origin of B is placed at z, the shifted B intersects with A. Expands bright regions and fills small gaps.
$A \oplus B=\left\{z \mid(\widehat{B})_z \cap A \neq \Phi\right\}$ (4)
3.3.3 Opening
Applying erosion first and then dilation, known as morphological opening, helps remove small protrusions, separate narrow connections, and smooth the boundaries of objects.
$A \circ B=(A \ominus B) \oplus B$ (5)
3.3.4 Closing
When dilation is applied before erosion, a process known as morphological closing, it smooths object boundaries, bridges narrow gaps or elongated depressions, removes small voids, and fills discontinuities along the contour.
$A \cdot B=(A \oplus B) \ominus B$ (6)
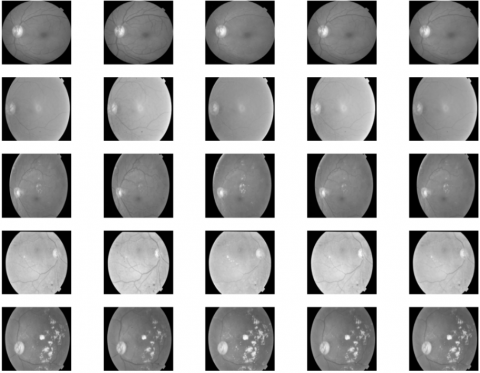
The application of morphological operations such as erosion, dilation, opening, and closing on retinal fundus images is demonstrated in Figure 4.
Original Erosion Dilation Opening Closing
Figure 4. Images after morphological operation
3.4 Otsu’s thresholding
Otsu's Thresholding is an image binarization method used in image processing to automatically perform clustering-based thresholding [26]. It was introduced by Nobuyuki Otsu in 1979 and is particularly effective for grayscale images with bimodal histograms. The Otsu algorithm determines the best threshold by enhancing the separation between background and foreground intensity levels in the histogram, making it an effective tool for medical image analysis such as detecting DR lesions.
Compute histogram of the grayscale image.
Iterate through all possible thresholds (from 0 to 255 for 8-bit images).
Divide the pixels into two groups: Class 0 background (below threshold) and class 1 foreground (above threshold).
Compute the mean and weight (probability) of each group.
Compute Intra-class variation for each criterion.
Choose the threshold that produces the lowest intra-class variance or the maximum inter-class variance.
Let t be the threshold ω0(t), ω1(t) be the weights (probabilities) of the background and foreground classes.
$\omega_0(t)=\sum_{i=0}^t p_i$ (7)
$\omega_1(t)=\sum_{i=t+1}^{L-1} p_i$ (8)
Let μ0(t), μ1(t) be the means of the two classes
$\mu_0(t)=\frac{1}{\omega_0(t)} \sum_{i=0}^t i p_i$ (9)
$\mu_1(t)=\frac{1}{\omega_1(t)} \sum_{i=t+1}^{L-1} i p_i$ (10)
μT be the total mean of the image
$\mu_T(t)=\sum_{i=0}^{L-1} i p_i$ (11)
Then the between-class variance is:
$\sigma_b^2(t)=\omega_0(t) \cdot \omega_1(t)\left(\mu_0(t)-\mu_1(t)\right)^2$ (12)
3.5 Feature extraction
Feature extraction in this work is carried out using a hybrid strategy that combines MS-DRLBP and CNN.
3.5.1 MS-DRLBP
MS-DRLBP (Multiscale-Discriminative Robust Local Binary Pattern) is a texture feature extraction technique designed for robust image analysis, particularly in tasks like face recognition, texture classification, and medical image analysis [27]. It builds upon and improves the classical Local Binary Pattern (LBP) by addressing some of its limitations, such as sensitivity to rotation and inability to capture directional and multi-scale texture information effectively. It can Improve microaneurysm, hemorrhage, and exudate detection.
The standard Local Binary Pattern (LBP) operator compares a pixel with its neighbours and encodes the differences as a binary pattern:
$L B P_{P, R}\left(x_c, y_c\right)=\sum_{p=0}^{p-1} s\left(g_p-g_c\right) 2^p$ (13)
where, gp and gc are the intensity of the neighbors and central pixel P is the number of neighbors, R is the radius.
$s(z)= \begin{cases}1, & z \geq 0 \\ 0, & z \leq 0\end{cases}$ (14)
3.5.2 Robust and Discriminative Extension (DRLBP)
Instead of directly using binary differences, DRLBP applies a discriminative weighting to reduce sensitivity to noise and illumination changes. Positive and negative differences are separated, creating two complementary histograms that capture both bright and dark lesion patterns more effectively.
3.5.3 Multi-Scale Extension (MS-DRLBP)
Features are extracted across multiple neighbourhood radii R1, R2..., Rm.
This allows detection of small lesions (microaneurysms) at fine scales and larger structures (exudates, hemorrhages) at coarser scales. Descriptor is:
$M S-D R L B P\left(x_c, y_c\right)=\bigcup_{i=1}^m D R L B P_{P, R_i}\left(x_c, y_c\right)$ (15)
where, $\cup$ denotes the histogram concatenation across multiple scales.
|
Algorithm: Feature Extraction Procedure (Pseudocode) |
|
Input: Retinal fundus image I Output: MS-DRLBP feature vector F Step1. Multi-scale neighbourhood extraction: a. Select a set of radii R={R1,R2,R3,}
b. For each pixel (x,y) in I: Capture surrounding regions at different radii.
Step2. Local Binary Pattern (LBP) encoding: For every radius Rk: For each pixel (x,y) • Compare the center pixel with its neighbors.
• Form a binary code from these comparisons.
• Convert the binary sequence into a decimal LBP index.
Step3. Robust LBP (RLBP) enhancement: a. Minimize noise effects by grouping similar patterns.
b. Discard uniform patterns that add little discriminative power.
c. Preserve texture patterns highlighting retinal structures such as vessels or lesions.
Step4. Feature selection and fusion: a. Build a histogram of RLBP codes for each scale Rk
b. Normalize each histogram.
c. Concatenate histograms across all scales to generate the
MS-DRLBP descriptor. |
3.5.4 VGG16
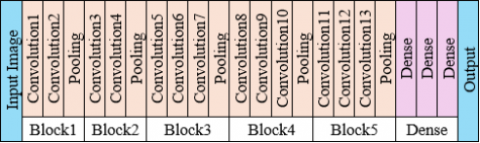
VGG16 is a CNN model introduced in 2014 by the Visual Geometry Group at the University of Oxford. It became famous for its simplicity, depth, and strong performance in classification tasks. VGG16 is structured into 5 convolutional blocks followed by dense layers. Each block increases the feature richness while reducing spatial resolution. The VGG16 model is composed of 16 learnable layers, including 13 convolutional layers followed by 3 fully connected layers. Uses only 3×3 convolution filters and 2×2 max-pooling layers for feature extraction. Its architecture employs successive convolutional layers arranged in blocks, each followed by max-pooling, with the feature depth gradually increasing at deeper stages of the network [28]. The detailed layer architecture of the VGG framework is shown in Figure 5. This design allows the network to capture both low-level and high-level features, making it highly effective for extracting detailed image representations. Unlike ResNet, it follows a simple sequential structure. Widely used in pre-trained models for medical imaging, object detection, etc. A widely used model with simple yet effective convolutional layers. The block1 provides the foundation for detecting blood vessel edges and optic disc boundaries in retinal images. The block2 enhances detection of small lesions like microaneurysms in DR images. The block 3 useful for identifying hemorrhages and intermediate lesion structures. The block4 is crucial for differentiating between moderate and severe DR, where lesion groupings matter and block5 can help distinguish between proliferative DR and advanced stages where neovascularization patterns appear. Dense layers used for classification into ImageNet classes.
Figure 5. VGG16 layers
3.6 Classification methodology
The features extracted through MS-DRLBP and CNN are applied to the classifier for DR classification. The pretrained VGG16 network is employed to extract deep hierarchical features, while MS-DRLBP provides robust texture descriptors.
These complementary features capture both high-level semantic representations and fine-grained local patterns from retinal fundus images.
The extracted features are normalized and concatenated into a joint feature vector.
$F=\left\{f_{-} C N N \| f_{M S-D R L B P}\right\}$ (16)
where, "$\|$" denotes concatenation operator.
This vector retains spatial, textural, and structural information critical for DR detection. Instead of using a conventional softmax, we employ an RBF network where each hidden neuron applies a Gaussian kernel:
$h_j(x)=\exp \left(-\frac{\left|x-c_j\right|^2}{2 \sigma_j^2}\right)$ (17)
where,
x is input feature vector
cj is the centre of the jth RBF neuron
σj is parameter controlling the width of the Gaussian
The final output is:
$y_k(x)=\sum_{j=1}^M w_{k j} h_j(x)+b_k$ (18)
where, M is number of hidden RBF neurons.
Wkj is the weight connecting to jth hidden neuron to the kth output classes bk is the bias
To thoroughly evaluate classification performance and enhance the DR detection rate, we employed various classifiers, including RBF, SVM (Support Vector Machine) and CNN-RBF. The CNN-RBF classifier benefits from random initialization of network weights and RBF centers. This process incorporates a controlled level of randomness, optimizing the diversity of the neural network’s internal representations and enhancing its capacity to learn complex patterns. Such initialization mimics the essence of non-iterative randomization-based methods, facilitating a more efficient solution for space exploration. Integrating MS-DRLBP features further enriches this model, enabling the discrimination of subtle variances between normal and DR-affected retinal images. This method marks a significant breakthrough in medical analysis, emphasizing the capability of hybrid models to attain high precision in disease classification tasks. Instead of using a conventional softmax, we employ an RBF network where each hidden neuron applies a Gaussian kernel.
3.7 Network model and training
In this study, the training hyperparameters such as learning rate and batch size were optimized to maximize classification accuracy, highlighting the effectiveness of hybrid architectures for medical image analysis. Within the CNN, neurons are spatially arranged in tiled patterns, each corresponding to a localized region of the input field. The proposed framework integrates the CNN with a RBF classifier, where stochastic learning strategies are utilized to simplify the training process and minimize computational overhead.
Unlike traditional iterative optimization methods like back propagation, randomization-based approaches focus on non-iterative processes or stochastic initialization to efficiently learn decision boundaries. In our model, the RBF layers integrate stochastic modeling to enhance feature extraction and classification without the need for extensive iterative tuning. This results in faster training and improved efficiency, which is especially important for applications requiring scalable and accessible solutions. The MS-DRLBP features are integrated with the features extracted by CNN-RBF in this study. The present work utilizes a CNN model (VGG16) with hyperparameter settings as per Table 3 including maximum of 100 epochs, a learning rate of 0.0001, and a momentum factor of 0.9, with batch sizes tested at 8, 16 and 32. At batch size 32, model achieve higher accuracy in retinal image classification. Based on the training, the tested optimizer includes Stochastic Gradient Descent (SGDM) with yielding superior results.
Table 3. Hyper parameters of CNN
|
CNN Model |
Batch Size |
Learning Rate |
Training Optimizer |
|
VGG16 |
32 |
0.0001 |
SGDM |
3.8 PSO optimization
In the CNN-RBF hybrid model, PSO helps fine-tune hyperparameters, optimize RBF kernel values, and automatically find the best settings, reducing manual trial-and-error. In this work, PSO is applied to optimize model hyperparameters. The configuration of PSO hyperparameters used for tuning the proposed model is summarized in Table 4. A swarm of 20 particles explores the search space for 30 iterations. The inertia weight (w = 0.7) maintains a balance between exploration and convergence. The cognitive parameter (c1 = 1.5) guides particles using their own best experience, while the social parameter (c2 = 1.5) directs them toward the global best solution. Together, these settings ensure efficient convergence and improved classification performance.
Table 4. Configuration of PSO hyperparameters
|
Parameter |
Value |
|
Swarm Size |
20 |
|
Number of Iterations |
30 |
|
Inertia Weight (w) |
0.7 |
|
Cognitive Coefficient (c₁) |
1.5 |
|
Social Coefficient (c₂) |
1.5 |
$\begin{aligned} v_i(t+1)=\omega v_i(t) & +c_1 r_1\left(p_i^*-x_i(t)\right)+c_2 r_2\left(g^*\right.\left.-x_i(t)\right)\end{aligned}$ (19)
$x_i(t+1)=x_i(t)+v_i(t+1)$ (20)
Here, ω denotes the inertia weight, c1 and c2 represent the acceleration coefficients, while r1 and r2 are uniformly distributed random values in the range [0,1].
PSO is applied to minimize the loss function (categorical cross-entropy) on the validation set, defined as:
$\mathcal{L}=-\sum_{i=1}^N \sum_{j=1}^K y_{i j} \log \left(\hat{y}_{i j}\right)$ (21)
The simulation was carried out on a Windows 11 laptop equipped with an Intel i7 processor (3.20 GHz) and 16 GB RAM. The retinal image classification algorithm was implemented and evaluated using Python. The DR categorization results illustrate the suggested model's ability to reliably identify various phases of the illness. The method performed well with respect to accuracy, sensitivity, specificity, and F1-score demonstrating that retinal lesions can be detected reliably [29]. Employing combined feature extraction techniques, such as MS-DRLBP and pretrained CNN models, dramatically improved classification performance by capturing both textural and deep semantic information. The confusion matrix demonstrated significant differences between DR phases, especially in separating mild and moderate instances from severe symptoms. Overall, the model's strong performance on the test dataset demonstrates its potential for clinical use in early disease detection and automated diagnosis.
Table 5. Performance metrics
|
Formula |
Description |
|
Accuracy $=\frac{T p+T n}{T p+T n+F p+F n}$ |
It reflects the proportion of correct outcomes among the total predictions |
|
Precision $=\frac{T p}{T p+F p}$ |
It gives from all the positive predictions; how many were correct |
|
Sensitivity $=\frac{T p}{T p+F n}$ |
It allows a model to correctly detect all true positives. |
|
$F 1=2 \times \frac{(\text { Precision } \times \text { Recall })}{(\text { Precision }+ \text { Recall })}$ |
The model accurately identifies the positive class while minimizing false predictions |
In fundus pictures, the True Negative (TN) represents correctly identified non-lesion pixels, whereas the True Positive (TP) represents correctly discovered lesion pixels. False Negative (FN) pixels are lesion pixels that the algorithm does not detect, whereas False Positive (FP) pixels are non-lesion pixels that are mistakenly identified as lesions. Table 5 describes the performance evaluation indicators utilized in the reported studies.
4.1 Performance on test set
The developed model was tested separately on the APTOS 2019, Messidor, and EyePACS datasets, as well as on a unified dataset that combined all three. For each evaluation, training was performed on a different dataset to examine its ability to generalize. The findings show that although strong results were obtained on the individual datasets, even higher performance was achieved on the merged set, indicating resilience to variations in resolution, image quality, and lesion distribution. With additional validation through cross-validation, the approach demonstrates adaptability across multiple sources and potential for effective clinical application. Table 6 provides the distribution of test samples among different stages of diabetic retinopathy (DR).
Table 6. Distribution of test set based on DR type
|
Dataset |
No DR |
Mild |
Moderate |
Severe |
PDR |
|
APTOS 2019 |
720 |
160 |
400 |
80 |
120 |
|
EyePACS |
27200 |
2000 |
4400 |
800 |
640 |
|
Messidor |
216 |
60 |
100 |
52 |
52 |
|
Combined |
28136 |
2220 |
4900 |
932 |
812 |
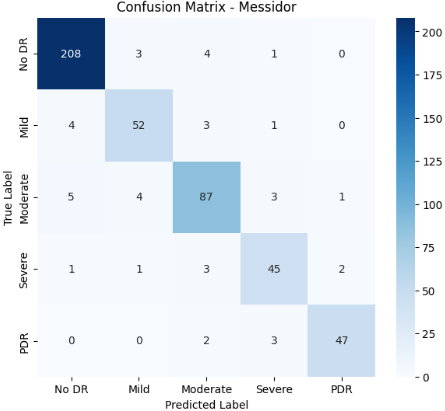
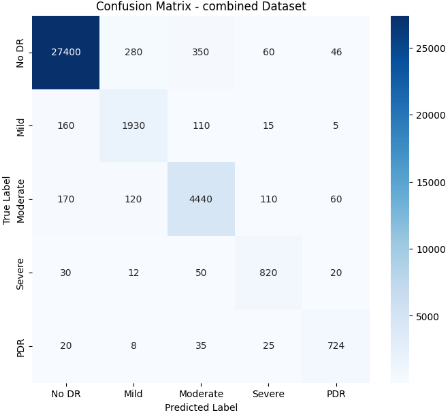
A confusion matrix can be applied to multi-class issues, with each row and column representing a class and the diagonal values representing accurate predictions. Confusion matrix for test data as shown in Figure 6. This evaluation is carried out using multiple performance metrics computed from the confusion matrix and the predictions on the test dataset.
Figure 6. Confusion matrix for different test sets
The study assessed the effectiveness of three classifiers RBF classifier and Support Vector Machine (SVM) and a CNN-RBF hybrid using three standard datasets (APTOS 2019, Messidor, EyePACS) along with a merged dataset combining them. Performance was measured through Precision, Sensitivity (Recall), Specificity, F-score, and Accuracy.
Table 7. Performance of model on different classifiers
|
Dataset |
Classifier |
Precision |
Sensitivity |
Specificity |
F-Score |
Accuracy |
|
APTOS2019 |
SVM |
85.40% |
83.10% |
88.70% |
84.20% |
86.00% |
|
RBF |
89.80% |
87.60% |
91.20% |
88.60% |
90.10% |
|
|
CNN-RBF |
94.50% |
92.80% |
95.70% |
93.60% |
95.20% |
|
|
Messidor |
SVM |
82.10% |
80.20% |
85.00% |
81.00% |
83.40% |
|
RBF |
87.30% |
85.50% |
89.00% |
86.40% |
88.20% |
|
|
CNN-RBF |
92.80% |
91.20% |
94.10% |
91.90% |
93.00% |
|
|
EyePACS |
SVM |
84.00% |
82.50% |
86.20% |
83.20% |
85.10% |
|
RBF |
88.60% |
86.70% |
90.50% |
87.50% |
89.30% |
|
|
CNN-RBF |
95.00% |
93.40% |
96.10% |
94.20% |
95.60% |
|
|
Combined (APTOS2019+Messidor+EyePACS) |
SVM |
87.20% |
85.50% |
89.30% |
86.30% |
88.00% |
|
RBF |
91.00% |
89.20% |
92.60% |
90.10% |
91.70% |
|
|
CNN-RBF |
97.00% |
96.20% |
98.50% |
97.50% |
98.13% |
Across all datasets, the CNN-RBF approach achieved superior outcomes compared to SVM and RBF as shown in Table 7. The advantage was most evident on the combined dataset, demonstrating the hybrid model’s robustness against variations in image quality, resolution, and lesion characteristics. High sensitivity and specificity further confirm its ability to minimize false negatives, which is crucial in clinical screening, while ensuring dependable diagnostic accuracy.
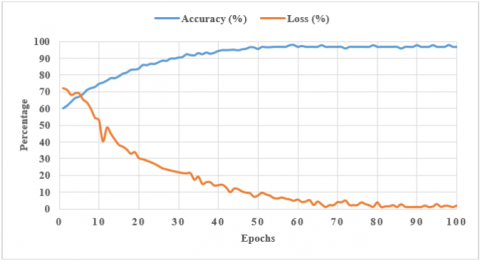
The graph in Figure 7 depicts the relationship between training epochs and the corresponding accuracy and loss values. As training advances, accuracy improves while loss reduces, suggesting successful model learning. The model performance on a test dataset, you typically assess how effectively a trained machine learning model predicts unseen data. Table 8 highlights the performance of various DR detection techniques on different benchmark datasets, evaluated through sensitivity, specificity, accuracy, and the F1-score. Classical methods such as KNN and U-Net show reasonable accuracy but are limited to smaller datasets. In contrast, deep learning models like DenseNet-121 and the Multi-Scale Attention Network report higher sensitivity and more balanced outcomes on APTOS 2019 and EyePACS. The proposed Hybrid RBF-CNN, trained on a combined dataset of APTOS 2019, Messidor, and EyePACS, delivers 98.13% accuracy, 96.2% sensitivity, and 97.5% F1-score, indicating stronger generalization across diverse retinal images.
Figure 7. Accuracy and loss of model with epochs
Table 8. Performance comparison of the proposed model
|
Method |
Dataset |
Sensitivity |
Specificity |
F1-Score |
Accuracy |
|
Modified U Shaped Network with STARE dataset [30] |
DRIVE, STARE, and CHASE_DB1 |
84.48 |
98.84 |
- |
98.13 |
|
DenseNet 121 network [31] |
APTOS 2019 |
96 |
98.8 |
- |
97.3 |
|
KNN algorithm [32] |
DIARETDB1 |
90.24 |
99 |
- |
98 |
|
U Net algorithm [33] |
DRIVE, STARE, and CHASED_B1 |
83.56 |
98.64 |
83.23 |
97.54 |
|
Multi-Scale Attention Network [34] |
APTOS2019 |
98.3 |
98.2 |
98.2 |
98.1 |
|
EyePACS |
90.6 |
78.7 |
76.7 |
87.5 |
|
|
Hybrid RBF-CNN (Proposed) |
Integrated APTOS2019, Messidor and EyePACS |
96.2 |
98.5 |
97.5 |
98.13 |
4.2 Statistical significance analysis
To validate the robustness of our results, we performed paired t-tests between the proposed Hybrid CNN-RBF model optimized with PSO and the baseline classifiers (SVM, RBF, and standard CNN) across all datasets (APTOS2019, Messidor, and EyePACS). The null hypothesis (H₀) states that there is no significant difference in the mean performance (accuracy and F1-score) between the proposed method and the baselines. For every dataset, the obtained p-values were below 0.01, leading to the rejection of H₀ at a 99% confidence level. These results confirm that the performance gains achieved by our approach are statistically significant.
In this research, a new methodology is proposed by joining CNN and RBF classifiers, both supported by MS-DRLBP features, to achieve better classification of DR in retinal images. The main feature of our system is the deliberate use of techniques based on randomization. Make the model operate more effectively, stably and flexibly. Our approach shows that using a mix of deep learning and random factors can result in improved performance in retinal disease detection in medical imaging. Our efforts support the growing field of randomization-based learning algorithms by increased efficiency and broader applicability, randomization-based strategies become very important for dealing with complicated biomedical images. Additionally, comparing our approach to traditional and randomized models has shown that our approach is effective and has significantly improved diagnostics work. Going forward, we anticipate many promising research paths. We could confirm the methodology’s ability to work elsewhere by testing it on other types of medical imaging and different disease identification tasks. By exploring deeper uses of randomization in CNNs and RBF networks’ designs, more efficient and improved results could appear. Forming theoretical models to examine how randomization operates with deep learning may lead to new and better design ideas for future algorithms that depend on randomization. Overall, our work introduces a useful approach for spotting DR and explores uncharted areas in the field of randomization-based deep and shallow learning. Our work helps link the strengths of traditional deep learning with randomization approaches, preparing the way for better, stable and flexible models in medical image analysis and other areas.
[1] World Health Organization. Blindness and vision impairment. https://www.who.int/news-room/fact-sheets/detail/blindness-and-visual-impairment, accessed on Aug. 10, 2023.
[2] Diabetes and the eyes. International Diabetes Federation. International Diabetes Federation. https://idf.org/about-diabetes/diabetes-complications/eyes/, accessed on Aug. 31, 2025.
[3] Murugappan, M., Prakash, N.B., Jeya, R., Mohanarathinam, A., Hemalakshmi, G.R., Mahmud, M. (2022). A novel few-shot classification framework for diabetic retinopathy detection and grading. Measurement, 200: 111485. https://doi.org/10.1016/j.measurement.2022.111485
[4] Mutawa, A.M., Alnajdi, S., Sruthi, S. (2023). Transfer learning for diabetic retinopathy detection: A study of dataset combination and model performance. Applied Sciences, 13(9): 5685. https://doi.org/10.3390/app13095685
[5] Qin, Q., Chen, Y. (2024). A review of retinal vessel segmentation for fundus image analysis. Engineering Applications of Artificial Intelligence, 128: 107454. https://doi.org/10.1016/j.engappai.2023.107454
[6] Wan, S., Liang, Y., Zhang, Y. (2018). Deep convolutional neural networks for diabetic retinopathy detection by image classification. Computers & Electrical Engineering, 72: 274-282. https://doi.org/10.1016/j.compeleceng.2018.07.042
[7] Marín, D., Aquino, A., Gegúndez-Arias, M.E., Bravo, J.M. (2010). A new supervised method for blood vessel segmentation in retinal images by using gray-level and moment invariants-based features. IEEE Transactions on Medical Imaging, 30(1): 146-158. https://doi.org/10.1109/TMI.2010.2064333
[8] Zhou, Z., Yang, X., Ji, H., Zhu, Z. (2023). Improving the classification accuracy of fishes and invertebrates using residual convolutional neural networks. ICES Journal of Marine Science, 80(5): 1256-1266. https://doi.org/10.1093/icesjms/fsad041.
[9] Reddy, S.R., Varma, G.S., Davuluri, R.L. (2023). Resnet-based modified red deer optimization with DLCNN classifier for plant disease identification and classification. Computers and Electrical Engineering, 105: 108492. https://doi.org/10.1016/j.compeleceng.2022.108492
[10] Franklin, S.W., Rajan, S.E. (2014). Computerized screening of diabetic retinopathy employing blood vessel segmentation in retinal images. Biocybernetics and Biomedical Engineering, 34(2): 117-124. https://doi.org/10.1016/j.bbe.2014.01.004
[11] Burewar, S., Gonde, A.B., Vipparthi, S.K. (2018). Diabetic retinopathy detection by retinal segmentation with region merging using CNN. In 2018 IEEE 13th International Conference on Industrial and Information Systems (ICIIS), Rupnagar, India, pp. 136-142. https://doi.org/10.1109/ICIINFS.2018.8721315
[12] Sambyal, N., Saini, P., Syal, R., Gupta, V. (2020). Modified U-Net architecture for semantic segmentation of diabetic retinopathy images. Biocybernetics and Biomedical Engineering, 40(3): 1094-1109. https://doi.org/10.1016/j.bbe.2020.05.006
[13] Kumar, S., Adarsh, A., Kumar, B., Singh, A.K. (2020). An automated early diabetic retinopathy detection through improved blood vessel and optic disc segmentation. Optics & Laser Technology, 121: 105815. https://doi.org/10.1016/j.optlastec.2019.105815
[14] Porwal, P., Pachade, S., Kokare, M., Deshmukh, G., et al. (2020). Idrid: Diabetic retinopathy-segmentation and grading challenge. Medical Image Analysis, 59: 101561. https://doi.org/10.1016/j.media.2019.101561
[15] Qureshi, I., Ma, J., Abbas, Q. (2019). Recent development on detection methods for the diagnosis of diabetic retinopathy. Symmetry, 11(6): 749. https://doi.org/10.3390/sym11060749
[16] Das, S., Kharbanda, K., Raman, R., Dhas, E. (2021). Deep learning architecture based on segmented fundus image features for classification of diabetic retinopathy. Biomedical Signal Processing and Control, 68: 102600. https://doi.org/10.1016/j.bspc.2021.102600
[17] Qiao, L., Zhu, Y., Zhou, H. (2020). Diabetic retinopathy detection using prognosis of microaneurysm and early diagnosis system for non-proliferative diabetic retinopathy based on deep learning algorithms. IEEE Access, 8: 104292-104302. https://doi.org/10.1109/ACCESS.2020.2993937
[18] Özbay, E. (2023). An active deep learning method for diabetic retinopathy detection in segmented fundus images using artificial bee colony algorithm. Artificial Intelligence Review, 56(4): 3291-3318. https://doi.org/10.1007/s10462-022-10231-3
[19] Maaliw, R.R., Mabunga, Z.P., De Veluz, M.R.D., Alon, A.S., et al. (2023). An enhanced segmentation and deep learning architecture for early diabetic retinopathy detection. In 2023 IEEE 13th Annual Computing and Communication Workshop and Conference (CCWC), Vegas, USA, pp. 0168-0175. https://doi.org/10.1109/CCWC57344.2023.10099069
[20] Chen, Y., Xu, S., Long, J., Xie, Y. (2023). DR-Net: Diabetic retinopathy detection with fusion multi-lesion segmentation and classification. Multimedia Tools and Applications, 82(17): 26919-26935. https://doi.org/10.1007/s11042-023-14785-4
[21] Deshmukh, S.V., Roy, A., Agrawal, P. (2023). Retinal image segmentation for diabetic retinopathy detection using U-net architecture. International Journal of Image, Graphics and Signal Processing, 15(1): 79-92. https://doi.org/10.5815/ijigsp.2023.01.07
[22] Eyepacs, Aptos, Messidor Diabetic Retinopathy. https://www.kaggle.com/datasets/ascanipek/eyepacs-aptos-messidor-diabetic-retinopathy, accessed on Aug. 31, 2025.
[23] Zulfahmi, R., Noviyanti, D.S., Utami, G.R., Harison, A.N., Agung, P.S. (2019). Improved image quality retinal fundus with contrast limited adaptive histogram equalization and filter variation. In 2019 International Conference on Informatics, Multimedia, Cyber and Information System (ICIMCIS), Jakarta, Indonesia, pp. 49-54. https://doi.org/10.1109/ICIMCIS48181.2019.8985198
[24] Mafi, M., Martin, H., Cabrerizo, M., Andrian, J., Barreto, A., Adjouadi, M. (2019). A comprehensive survey on impulse and Gaussian denoising filters for digital images. Signal Processing, 157: 236-260. https://doi.org/10.1016/j.sigpro.2018.12.006.
[25] Viraktamath, S.V., Koti, V., Ragi, S., Pai, N. (2018). Blood vessels extraction of retinal image using morphological operations. In 2018 International Conference on Inventive Research in Computing Applications (ICIRCA), Coimbatore, India, pp. 1185-1189. https://doi.org/10.1109/ICIRCA.2018.8597352
[26] Nyo, M.T., Mebarek-Oudina, F., Hlaing, S.S., Khan, N.A. (2022). Otsu’s thresholding technique for MRI image brain tumor segmentation. Multimedia Tools and Applications, 81(30): 43837-43849. https://doi.org/10.1007/s11042-022-13215-1
[27] Hemalakshmi, G.R., Santhi, D., Mani, V.R.S., Geetha, A., Prakash, N.B. (2021). Classification of retinal fundus image using MS-DRLBP features and CNN-RBF classifier. Journal of Ambient Intelligence and Humanized Computing, 12(9): 8747-8762. https://doi.org/10.1007/s12652-020-02647-y
[28] Yang, H., Ni, J., Gao, J., Han, Z., Luan, T. (2021). A novel method for peanut variety identification and classification by Improved VGG16. Scientific Reports, 11(1): 15756. https://doi.org/10.1038/s41598-021-95240-y
[29] Saiharsha, B., Diwakar, B., Karthika, R., Ganesan, M. (2020). Evaluating performance of deep learning architectures for image classification. In 2020 5th international Conference on Communication and Electronics Systems (ICCES), Coimbatore, India, pp. 917-922. https://doi.org/10.1109/ICCES48766.2020.9137884
[30] He, X., Wang, T., Yang, W. (2024). Research on retinal vessel segmentation algorithm based on a modified U-shaped network. Applied Sciences, 14(1): 465. https://doi.org/10.3390/app14010465
[31] Mohanty, C., Mahapatra, S., Acharya, B., Kokkoras, F., et al. (2023). Using deep learning architectures for detection and classification of diabetic retinopathy. Sensors, 23(12): 5726. https://doi.org/10.1016/j.knosys.2023.111185
[32] Kaur, J., Kaur, P. (2023). Automated computer-aided diagnosis of diabetic retinopathy based on segmentation and classification using K-nearest neighbor algorithm in retinal images. The Computer Journal, 66(8): 2011-2032. https://doi.org/10.1093/comjnl/bxac059
[33] Ma, Z., Li, X. (2024). An improved supervised and attention mechanism-based U-Net algorithm for retinal vessel segmentation. Computers in Biology and Medicine, 168: 107770. https://doi.org/10.1016/j.compbiomed.2023.107770
[34] Al-Antary, M.T., Arafa, Y. (2021). Multi-scale attention network for diabetic retinopathy classification. IEEE Access, 9: 54190-54200. https://doi.org/10.1109/ACCESS.2021.3070685