Khalid Waleed Nassar Almansoori*![]() | Oğuz Findik
| Oğuz Findik![]()
© 2025 The authors. This article is published by IIETA and is licensed under the CC BY 4.0 license (http://creativecommons.org/licenses/by/4.0/).
OPEN ACCESS
Breast cancer is still one of the main global causes of death among women. Thus, detecting it early is critical. Most papers on breast cancer have used the same dataset published online under the name Kaggle. Still, in this paper, we have collected an authentic and unique ultrasound dataset of patients from the Teaching Oncology Hospital in Iraq. This paper proposes a transfer learning-based approach using the MobileNet architecture enhanced with Active Learning (MobileNet_AL) to categorize breast ultrasound images into three classes: normal, benign, and malignant. The proposed methodology effectively addresses challenges such as class imbalance and limited labeled data by integrating data augmentation, preprocessing, and iterative sample selection through Active Learning. A comprehensive dataset, combining a Kaggle dataset with a unique collected dataset, was employed to ensure balanced and diverse training data. The MobileNet model achieved an accuracy of 94.67%, outperforming state-of-the-art methods reported in the literature. The comparative analysis further demonstrated significant improvements in the recall, precision, and F1 score across all classes. These findings demonstrate the potentiality of combining transfer learning with advanced optimization methods in medical imaging. Thus, providing robust and efficient diagnostic tools for breast cancer detection.
breast cancer classification, transfer learning, MobileNet, active learning, medical imaging, deep learning
The medical urgency for an early distinguished breast cancer diagnosis and detection persists because this illness represents a prominent source of women's mortality globally [1]. Early treatment detection yields better survival outcomes, leading to improved treatment effects. Cancer detection relies on three primary screening techniques: mammography, ultrasound, and magnetic resonance imaging (MRI). Low-dose X-ray mammography scans breast tissue to reveal abnormalities, such as masses and calcifications, in addition to providing detailed images of breast structures [2, 3]. The screening technique of mammography performs less effectively in dense breast tissue arrangements. When examining dense breast tissue, physicians combine ultrasound ray analysis, which involves high-frequency sound wave detection, with this method to distinguish solid masses and cysts [3, 4]. The combination of healthcare imaging modalities with advanced diagnostic instruments remains essential for breast cancer detection and treatment control.
Medical imaging shows enhanced capabilities through the merging of artificial intelligence systems (AI) with computer-aided diagnostic (CAD) methods. AI, through its deep learning techniques, has altered medical practice completely through its ability to automate complex diagnostic processes (image segmentation) while also performing feature extraction and categorization [5, 6]. Through the implementation of machine learning algorithms, CAD systems help radiologists detect abnormalities more accurately while shortening their analysis period. Multiple imaging devices (from mammography, ultrasound, and MRI) have benefited from the implementation of these detection systems, which enhance medical accuracy while aiding clinical determination [7, 8]. Risk assessment through CAD systems becomes more accurate when combined with patient-specific details, including age, family history and breast density data [4, 8].
Various deep learning models have emerged due to the success of medical imaging in breast cancer classification and detection. Convolutional neural networks deliver outstanding performance when used to conduct lesion segmentation alongside image classification tasks. CNN-based models demonstrate exceptional performance in mass classification for breast imaging through their ability to surpass handcrafted techniques, resulting in high accuracy outcomes for normal, benign, and malignant categorization [9, 10]. The technique of transfer learning brings efficiency and accuracy gains to pre-trained models through model fine-tuning on specific datasets, even when datasets contain minimal labeled information [11, 12]. Remaining issues in the text include unbalanced classes and restricted dataset variability, as well as with unresolved hyper parameter optimization needs in the literature.
Current research faces significant restrictions regarding the use of public datasets sourced from Kaggle, as these resources often fail to align with real-world scenarios properly due to primarily insufficient clinical diversity. The usage of publicly available datasets reduces the ability to achieve generalizable models that apply effectively to real-world scenarios. Our research uses a special dataset taken from the Teaching Oncology Hospital in Iraq to contain diverse breast ultrasound images that depict normal conditions alongside benign and malignant conditions. Our proposed model benefits from two different datasets, which together create a balanced training environment that provides comprehensive data coverage.
This study implements the MobileNet architecture as a transfer learning method, which integrates Active Learning (MobileNet_AL) to categorize breast ultrasound images between normal, benign and malignant groups. Through its implementation of Active Learning, the model selects samples with maximum training value during an iterative process to resolve issues with imbalanced classes and scarce labeled examples. Our approach utilizes data augmentation along with preprocessing methods to boost model robustness while improving its generalization ability. The methodology achieves a 94.67% accuracy level, surpassing existing techniques documented in the published literature. Our findings display increased performance in recall accuracy, precision ratings and F1 scores throughout multiple classes while demonstrating that transfer learning procedures work well with sophisticated optimization systems in medical image applications.
Three main contributions emerge from this study. Our work presents a new medical imaging dataset that fills crucial gaps in prior available datasets by showcasing authentic clinical conditions. Our proposed system employs deep learning techniques incorporating transfer learning principles with Active Learning to enhance diagnostic classification accuracy. Our findings show that the proposed approach reaches high levels of accuracy and exhibits excellent generalization, thus creating better diagnostic tools for detecting breast cancer. The completed work contributes advancements to medical imaging science while enhancing the quality of early breast cancer diagnosis and treatment solutions.
Using MEWOA as the feature fine-tuning algorithm, simulations using MobileNetV2 and NASNetMobile were performed for breast cancer classification, achieving classification accuracies of 99.7%, 99.8%, and 93.8% on the INbreast, MIAS, and CBIS-DDSM datasets, respectively [13].
A CAD model is prepared where specific transforms are applied for reconstruction, tumor segmentation is done via controlled transformations, and classification is achieved using a hybrid model [14]. Meanwhile, from a traditional learning perspective followed by deep learning approaches, techniques were used for semantic segmentation, while pre-trained models were applied to accurately classify the tumor [15].
Additionally, a hybrid model specifically developed for breast mass classification into benign or malignant categories was presented, utilizing a CNN with transfer learning. By mitigating the lack of training data through preprocessing and data augmentation, they achieve good performance on specific datasets [16].
Thus, deep learning is a method with the potential to revolutionize breast cancer analytics. These approaches address the challenges associated with manual interpretation by automating processes such as feature extraction, segmentation, and classification, thereby enhancing diagnostic accuracy. With the constant improvement of technology, the implications of AI and CAD systems will continue to broaden field applications, bringing more personalized, fast, and high-accuracy services for healthcare providers aiming at breast cancer diagnosis.
An improved model of Convolutional Neural Network (CNN) is proposed for assisting medical practitioners in classifying breast cancer. It divides breast lesions into normal, benign, and malignant categories, with a ROC of 90.5%, accuracy, sensitivity, and specificity of 90.5%, 89.47%, and 90.71%, respectively. (Receiver operating characteristic) score of 0.901 [17, 18] reported that there was a significant difference in pain and fear when compared (P<0.001). A new hybrid optimization algorithm-based feature selection method for classifying thyroid diseases was put out, HFBO-RT2FSVMNovel Model.
Mammography is less sensitive when it comes to dense breast tissue, which is a major diagnostic challenge, This limitation has led medical practitioners to adopt supplemental screening techniques like ultrasound and MRI, Factors such as family history, prior breast biopsies, socioeconomic status, and physician expertise also influence the choice of screening methods, improving detection rates among patients with dense breast tissue [19].
An essential stage in the study of mammogram images is feature extraction, particularly when learning-based approaches are used. CNNs have demonstrated the potential of automated feature extraction for mass lesion identification, achieving an area under the ROC curve classification of between 79.9% and 86% [20]. Additionally, a breast mass-specific example has been created that analyzes mass and micro classification clusters using Deep Learning CNN (DL-CNN) after first detecting outlines in mammograms using the Chan-Vese level set approach. The last phase, which introduces a highly complex-valued relaxation network, significantly enhances classification performance. Utilizing databases such as the Breast Cancer Digital Repository (BCDR) and MIAS, this methodology achieves performances of 99% accuracy, 0.9875 sensitivity, 1.0 specificity, and an AUC of 0.9815 to classify mammograms into normal, benign, or malignant classes [21].
Chai and associates, in terms of several applications, including picture restoration, visual tracking and segmentation, and identification, provides a comprehensive overview of current advancements in some CV approaches, they provide detailed information on new technologies to come, as well as possible future directions, and a valuable frame of reference for researchers and industry players in any CV related domain [22].
An automated method for analyzing mammograms obtained from the INbreast database, utilizing Vision Transformer (ViT), has been implemented. The model achieved an accuracy of 96.48%, demonstrating high efficiency with a relatively short training time. The updated tool features a graphical user interface (GUI), enabling physicians to utilize it for real-time measurement and make faster, more accurate diagnostic decisions [23]. These advances in AI and deep learning as well as general CV capabilities demonstrate their disruptive capability to make breast cancer diagnosis and detection more accurate, efficient, and affordable tools for clinicians and researchers alike, Even though a lot of hybrid optimization algorithms have been developed, still they are unable to escape local optima; their convergence speed is slow which uses more time in accuracy classification, We proposed a hybrid optimization approach based on the multilayer perceptron (MLP) for feature selection and breast mass classification in order to get over these restrictions, The grasshopper optimization algorithm (GOA) and the crow search algorithm (CSA) are merged in the suggested method. FRM achieved 97.1% classification accuracy, a sensitivity of 98%, and a specificity of 95.4% on the MIAS dataset written in MATLAB 2019a, outperforming other optimization algorithms [24].
The work was to classify the breast cancer cases from clinical, epidemiological, and outcome data sets and separate cancer-related deaths. Based on the difference and statistical values, they used a baseline difference and statistic for two-step feature selection using the SEER Breast Cancer dataset. Machine learning techniques, including decision trees, naive Bayes, gradient boosting, XGBoost, and AdaBoost were applied. Decision trees were the most accurate, achieving 98% in both cross-validation and train test splits, highlighting their effectiveness in breast cancer classification [25].
A two-stage semi-automated segmentation technique for micro calcification (MC) clusters in mammograms was presented by Arikidis et al. The majority of particles in an MC cluster were effectively segmented in the first step, and in the second stage, the form of each MC was refined. Ten morphologically relevant features (e.g., area, major length, perimeter, compactness) were extracted and fed into a support vector machine (SVM) classifier. Using a tenfold cross-validation approach, their method achieved an area under the ROC curve (AUC) of 0.80 0.04, significantly outperforming the B-spline active rays segmentation method, which scored 0.69 0.04 (p<0.05). Additionally, inter-observer and intra-observer segmentation agreements were substantial for specific distance metrics, reinforcing the robustness of the proposed method [11].
Breast cancer diagnosis relies heavily on histopathological imaging, and successful therapy depends on early detection. ConvNets like ResNet, VGG19, VGG16, Xception, and MobileNet are being used in computer-aided diagnostic (CAD) systems to automatically analyze histopathology pictures; these models outperform traditional handcrafted feature extraction methods while reducing the computational hardware requirements for large-scale training. This approach significantly improves the diagnosis and identification of breast cancer in histopathological data [7].
In the domain of computer vision (CV), various solutions were recommend to address challenges such as processing large video sequences in surveillance systems, especially with multiview camera setups, Deep learning approaches have proven effective results for human action recognition (HAR) in recent years, The authors suggested a HAR classifier based on deep learning that includes steps for feature mapping, fusion and selection, The method merges various visual models using a Serial based Extended approach, where features for all of the pre trained models are extracted first, A weighted k-nearest neighbor algorithm based on a summation of all optimal features separated by kurtosis. The effectiveness of the approach is demonstrated through experiments on benchmark datasets where accuracies were found to be 99.3%, 97.4%, 99.8% and 99.9%, respectively, for KTH, IXMAS, WVU, and Hollywood [26].
Recently, deep learning methods have produced impressive outcomes in the fields of medical imaging for disease diagnosis like breast cancer and so on, Deep Learning Based Parallel Fusion and Optimization of AlexNet and VGG16 Models used for ClassificationCOVID-19 Data This method, which performed contrast enhancement using top hat and wiener filter methods followed by feature selection based on entropy controlled firefly optimization, yielded 98% accuracy from the Radiopaedia dataset [27].
Fekri-Ershad and Alsaffar [28] addressed the analysis of cervical cancers. Their MLP model is amalgamated with ResNet-34 and VGG-19 networks, where their accuracies are respectively 99.23% and 97.65%. This approach applied fine-tuned layers and the Adam optimizer to accomplish a better performance. Similarly, Tan et al. proposed a federated learning (FL) solution to mitigate data privacy concerns in AI healthcare applications. Their framework, FeAvg-CNN+MobileNet, utilized transfer learning, synthetic minority oversampling techniques (SMOTE), and privacy-preserving FL, achieving superior classification performance on imbalanced mammography datasets. For breast histopathology images, advanced methods have also been proposed. Sanyal et al. [29] developed a hybrid framework combining fine-tuned CNN architectures with XGBoost for robust classification, outperforming state-of-the-art approaches. Bagchi et al. [30] Used deep learning for patch classification on the ICIAR BACH dataset, achieving 97.50% accuracy for four-class and 98.6% for two-class classifications. Another notable contribution is Guleria et al. [31] and Huynh et al. [32], who applied variation auto encoders combined with CNNs, achieving 73% accuracy on a Kaggle dataset for multi-classification of breast histopathology images.
The application of optimization-based feature selection techniques delivers effective results in diagnosing breast cancer. A newly developed hybrid method, featuring GOA and CSA algorithms, showed great success in classifying breast masses using multilayer perceptrons. Experimental results using the MIAS dataset validated the method's accuracy at 97.1% and yielded sensitivity and specificity levels of 98% and 95.4%, respectively [33]. Through its integration with rough set theory, the gray wolf optimizer (GWO) demonstrated better performance than typical algorithms, including Genetic Algorithms (GA) and Particle Swarm Optimization (PSO), producing improved Receiver Operating Characteristic (ROC) curves alongside enhanced accuracy and F-measures.
The combination of ensemble models with advanced transfer learning approaches has achieved significant improvements in classification precision through a soft voting ensemble approach, which integrates VGG16, VGG19, and Xception with seven CNN architectures. Kumar achieved 96.91% accuracy in diagnosing breast histopathology images in the H&E dataset [33]. Multiple sophisticated CNN configurations (including ResNet, Dual Path Networks, SENet and NASNet) show impressive performance on the ImageNet database automatically resolving binary through eight-class breast cancer detection challenges [34]. To address data imbalance problems in medical imaging, researchers have developed deep transfer learning, which has been confirmed as reliable for analyzing publicly shared datasets [35].
Medical imaging undergoes a radical transformation due to innovations in deep learning, optimization algorithms, and transfer learning technology. These techniques demonstrate excellent efficiency in addressing issues, including skewed class distributions, as well as imperfect standard diagnostic tools and privacy concerns related to feature acquisition methods. The ongoing development of computer-aided diagnostic (CAD) systems continues to enhance their capability to provide efficient and accurate assessments for healthcare practitioners in disease identification processes.
The majority of studies still face a significant deficiency in their datasets, both in terms of diversity and realistic representation. Researchers rely on publicly available ultrasound datasets, such as Kaggle's collection, but these resources often fail to adequately demonstrate clinical practice variations. Our research addresses this deficiency by collecting distinct breast cancer ultrasound images from the Teaching Oncology Hospital in Iraq. The collected dataset contains unique cases that never appeared in previous research due to its implementation of a novel algorithm designed to manage specific data properties. Our approach yields more realistic and applicable outcomes in research, while providing scholarly contributions through innovative applications of breast cancer diagnostic algorithms.
Table 1. Analysis of related works
|
Ref |
Methodology |
Dataset(s) |
Performance Metrics |
Key Contributions |
|
[13] |
MEWOA for feature fine-tuning with MobileNetV2 and NASNetMobile |
INbreast, MIAS, CBIS-DDSM |
Accuracies: 99.7%, 99.8%, 93.8% |
High accuracy in breast cancer classification using fine-tuned deep learning models. |
|
[17] |
Improved CNN for breast lesion classification |
Not specified |
ROC: 90.5%, Accuracy: 90.5%, Sensitivity: 89.47%, Specificity: 90.71% |
Divides breast lesions into benign, malignant, and normal categories with high accuracy. |
|
[20] |
CNN for automated feature extraction in mammograms |
Not specified |
ROC AUC: 79.9%-86% |
Demonstrates the potential of CNNs for automated feature extraction in mass lesion identification. |
|
[21] |
DL-CNN with Chan–Vese level set and complex-valued relaxation network |
BCDR, MIAS |
Accuracy: 99%, Sensitivity: 0.9875, Specificity: 1.0, AUC: 0.9815 |
High accuracy in classifying mammograms into normal, benign, or malignant categories. |
|
[23] |
Vision Transformer (ViT) for mammogram analysis |
INbreast |
Accuracy: 96.48% |
Efficient mammogram analysis with a GUI for real-time diagnostics. |
|
[24] |
Hybrid optimization (CSA+GOA) with MLP for feature selection |
MIAS |
Accuracy: 97.1%, Sensitivity: 98%, Specificity: 95.4% |
Overcomes local optima and slow convergence issues in hybrid optimization algorithms. |
|
[25] |
Machine learning (AdaBoost, XGBoost, etc.) for breast cancer classification |
SEER Breast Cancer dataset |
Accuracy: 98% |
Decision trees achieved the highest accuracy in breast cancer classification. |
|
[11] |
Two-stage semi-automated segmentation for MC clusters |
Not specified |
ROC AUC: 0.80±0.04 |
Outperforms B-spline active rays segmentation method and shows robustness in segmentation. |
|
[28] |
Deep learning-based HAR classifier with feature fusion and selection |
KTH, IXMAS, WVU, Hollywood |
Accuracies: 99.3%, 97.4%, 99.8%, 99.9% |
Effective human action recognition using deep learning and feature fusion. |
|
[29] |
Parallel fusion of AlexNet and VGG16 for COVID-19 classification |
Radiopaedia dataset |
Accuracy: 98% |
Combines contrast enhancement and entropy-controlled firefly optimization for high accuracy. |
|
[30] |
MLP with ResNet-34 and VGG-19 for cervical cancer analysis |
Not specified |
Two-class accuracy: 99.23%, 97.65% |
Fine-tuned layers and Adam optimizer improve performance. |
|
[32] |
Deep learning for patch classification on ICIAR BACH dataset |
ICIAR BACH |
Accuracy: 97.50% (four-class), 98.6% (two-class) |
High accuracy in patch classification for breast histopathology images. |
|
[33] |
Variational autoencoders + CNNs for multi-classification |
Kaggle dataset |
Accuracy: 73% |
Applies advanced deep learning techniques for multi-classification of breast histopathology images. |
|
[35] |
Hybrid GOA+CSA with MLP for breast mass classification |
MIAS |
Accuracy: 97.1%, Sensitivity: 98%, Specificity: 95.4% |
Validates the effectiveness of hybrid optimization algorithms in breast mass classification. |
The methodologies in Table 1 demonstrate a range of deep learning and optimization techniques for breast cancer classification. The achievement of high accuracy levels becomes possible through three methods, including deep learning models that have received fine-tuning [13, 21], together with networks based on CNN [17, 20] as well as Vision Transformer (ViT) [23]. However, ViT does not integrate hybrid optimization techniques. The research combined hybrid optimization systems with machine learning models, which demonstrated good performance but failed to extract features at the CNN level [24, 35, 25]. The primary deficiencies stem from the insufficient variety of datasets, as well as a dependency on publicly available datasets, which also presents challenges when dealing with class disproportion. A limited number of researchers examined Active Learning by using CNNs.
Specifically, the goal will be to increase the precision of image categorization for breast cancer through an optimal deep learning-based methodology, which can overcome hurdles such as data imbalance and hyper parameter tuning to improve performance. At a high level, the process consists of dataset aggregation, image preprocessing and a CNN-based classification pipeline, which is further fine-tuned using a bio-inspired algorithm. This process starts by merging two datasets (from Kaggle and our own). They are then merged to create a diverse and exhaustive training, validation and testing data pool. Three classes—normal, benign, and malignant—are applied to the photographs. In cases of class imbalance, where certain categories (for example, verbal scores) are overrepresented and others aren't, data balancing techniques are applied to ensure that all categories have sufficient training samples.
Image preprocessing steps are conducted to improve image quality and consistency. Prior to being fed into the CNN model, the pictures undergo pre-processing, which includes normalization and resizing to a standard dimension. Besides, Data augmentation methods like rotation are used to enhance the dataset, including shifting, zooming, and flipping, which makes it much larger than its original size, thereby increasing the model's robustness towards variations in input data. CNN Architecture for Three-Class Breast Cancer Classification. This design includes max pooling layers for down-sampling, convolutional layers for feature extraction, batch normalization for stabilization and dense layers for classification. We compile the model using Adam with categorical cross-entropy loss, and to avoid over fitting, we use early stopping.
Figure 1. Proposed scheme
In order to improve upon the model, A custom Snake Optimizer is used to optimize hyper parameters, including learning rate, dropout rate and optimizer type. This optimization algorithm (inspired by nature’s evolutionary process) systematically explores and exploits the hyper parameter space while also ensuring that the best parameter set is converged onto iteratively based on a specified objective function, in this case, model performance. To further increase accuracy and generalization, the CNN model is then retrained using the optimal hyper parameters. Additionally, image preprocessing techniques such as histogram equalization and Gaussian blur are applied to grayscale input images to enhance classification results.
F1 score, precision, accuracy, confusion matrices, recall, and other performance indicators are among the various calculations that comprise the approach. These are the metrics we use to cross-check the effectiveness of our model on the validation dataset. The models are evaluated graphically using learning curves and confusion matrices to gain insights into their strengths and weaknesses. Finally, the methodology saves all results into CSV files for reproducibility and further analysis. Finally, this end-to-end process incorporates all the steps of data preparation, augmentation, and preprocessing, as well as building and training the models, to optimize for best accuracy and present a final solution that has proven efficiency in the classification of breast cancer.
The following subsection explains the step-by-step approach we propose, as illustrated in Figure 1, from dataset preparation through to CNN model evaluation after optimisation.
3.1 Dataset overview
3.1.1 Kaggle dataset
The "Ultrasound Breast Images for Breast Cancer" dataset, obtained from Kaggle, was utilized in this investigation. Ultrasound pictures of benign and malignant breast cancers make up this dataset, which is essential for tasks involving the identification and classification of malignancy. The dataset contains sufficient images for reliable training and validation, thanks to augmentation techniques such as rotation and sharpening.
• Class malignant: 4042 images
• Class benign: 4074 images
This is a popular practice dataset for deep learning and machine learning problems because of its size and diversity. An example of malignant and benign ultrasound pictures from this dataset is displayed in Figure 2. The model describes two groups based on the images they mention that show different forms of breast tissue.
Detailed variability of the dataset, as well as augmentation methods used, make this dataset good enough to train deep learning models and balance the representation of such classes. In this work, the Kaggle dataset was used as a supplementary source to strengthen class representation and improve generalization.
3.1.2 Proposed collection dataset
The three primary types of breast ultrasound pictures in the proposed collection dataset are benign, malignant, and normal. The dataset was sourced from an oncology teaching hospital in Iraq, and the preprocessed photos in this dataset are used to enhance machine learning and deep learning methods to detect and classify breast cancer, which consists of:
• Class malignant: 429 images
• Class benign: 289 images
• Class normal: 72 images
The dataset comprises a diverse range of ultrasound images representing various breast tissue conditions. There are three classes: (a) normal, (b) malignant, and (c) benign. This dataset is clinically valuable because it introduces normal breast tissue cases, which are not present in the Kaggle dataset, and reflects imaging variations encountered in real-world diagnostic settings.
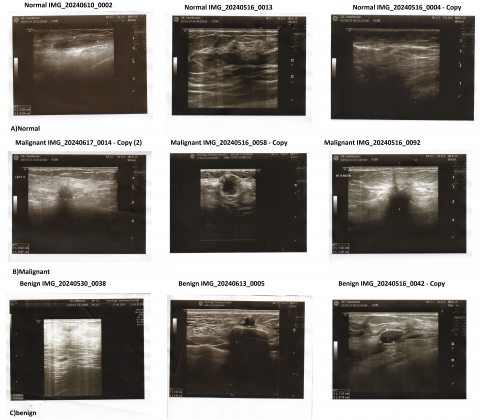
Figure 3 shows an example ultrasound image from the normal, malignant, and benign classes. It demonstrates the complexity of visual features typically found in such cases, which are critical for classification.
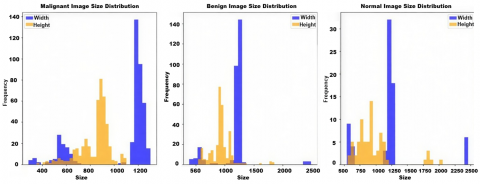
The size distribution of pictures in the benign, malignant, and normal classifications is shown in Figure 4. The width and height distributions for each class are displayed individually in the histograms, which demonstrate variation in picture dimensions.
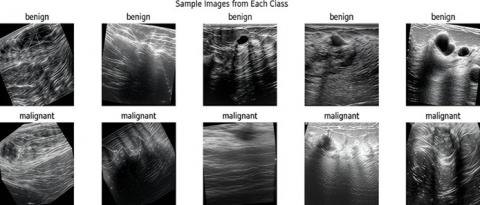
Figure 2. Example images per class: Benign (Top) and malignant (Bottom)
Figure 3. An example from the dataset of proposed collection. the images represent a benign, malignant, and normal tumor, illustrating key diagnostic features
Figure 4. Image size distribution for malignant, benign, and normal classes. each subplot represents the width and height frequency distribution of images for a specific class
Figure 5 illustrates the initial class distribution of the dataset. It highlights the imbalance in the dataset, with the malignant class having the largest number of images and the normal class having the fewest.
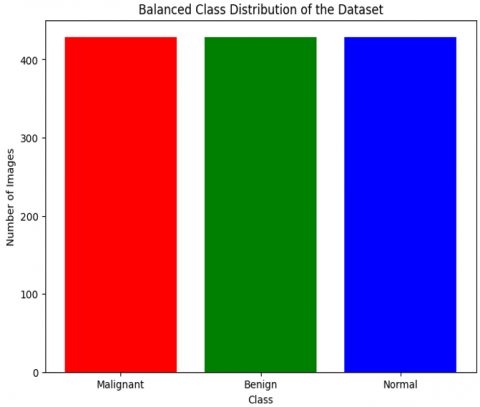
Figure 6 demonstrates the balanced distribution of the dataset after augmentation and over-sampling. Now, all three classes (malignant, benign and normal) have the same number of images, preventing model bias and allowing for effective training.
Figure 5. Class distribution of the proposed collection dataset before balancing. Malignant images dominate the dataset, followed by benign and normal classes
Figure 6. Balanced class distribution after data augmentation. Each class has an equal number of images, ensuring fairness in model training
3.1.3 Merged dataset
To construct a comprehensive dataset, the two sources were merged into three categories: malignant, benign and normal. The Iraqi dataset contributed unique normal images, while both the Kaggle and Iraqi datasets contributed benign and malignant cases. After merging, oversampling and augmentation techniques (rotation, flipping, shifting, zooming, and sharpening) were applied to balance the classes. The final balanced dataset consisted of 4,471 images per class (normal, benign, and malignant), ensuring equal representation across categories.
• Class normal: 4471 images
• Class benign: 4471 images
• Class malignant: 4471 images
This single dataset facilitates incremental learning from images of each class, enabling equitable testing and training of deep learning models. It ensures that the dataset is well-balanced, allowing the model to learn from a diverse range of samples. Hence, increasing the classification performance whilst decreasing over fitting.
3.1.4 Data splitting strategy
To establish a reliable evaluation protocol and minimize the risk of over fitting, the merged dataset was divided into distinct training, validation, and test subsets. A stratified patient-level splitting strategy was employed to ensure that all images from a single patient were confined to a single subset. This precaution prevents the leakage of patient-specific patterns across training and evaluation phases, which could otherwise artificially inflate performance metrics. The division followed a 70/15/15 ratio, allocating the majority of images to the training subset, while ensuring that the validation and test subsets remained sufficiently large and balanced for meaningful evaluation. Stratification preserved the proportional representation of the three classes (normal, benign, malignant) across all subsets, thereby maintaining class consistency and reducing bias during model development.
The validation subset was utilized for hyper parameter tuning, optimization, and early stopping to prevent over fitting during training. The test subset, held out entirely from the training and tuning process, was reserved exclusively for the final performance evaluation. This design ensured that the F1 scores, recall, precision, and accuracy reported in the study accurately reflected the actual generalization capacity of the proposed framework, rather than relying on the memorization of redundant patient-level features. By maintaining patient-level independence across subsets and applying a systematic splitting strategy, the evaluation process provided a fair and reproducible assessment of the model's diagnostic performance in breast cancer ultrasound image classification.
3.2 Convolution neural network architecture
Conv Net Architecture: A convolutional neural network (CNN) architecture was created specifically with the aim of dividing breast ultrasonography into three categories: benign, malignant, and normal. It commences with an input layer that receives 224×224 pictures with three color channels. The input data is normalized to make it similar for efficient training. The network is composed of a sequential structure, with convolutional layers serving as the primary building block for feature extraction. A pooling layer is employed for dimensionality reduction, and batch normalization is used within the convolutional layers to stabilize and accelerate the training process.
In the first layer, we incorporate 32 convolutional filters with a 3×3 kernel size and introduce non-linearity using the ReLU activation function. A max-pooling layer follows, which reduces computation while preserving significant characteristics by down-sampling the spatial resolution by calculating the maximum value in each local 2×2 region. A batch normalization layer is added after the pooling procedure to normalize the activations and stabilize the training process. In the following layers, this process is repeated with increasing the filters to 64 and 128, respectively, for the second and third convolutional layers. With each layer we build on top of the previous layers, we extract higher-level and more complicated features that allow us to distinguish very subtle differences in the input images.
A fully connected dense layer with 256 neurons receives the feature maps after they have been flattened into a one-dimensional vector following the convolutional and pooling processes. The ReLU activation function is employed by this thick layer to identify intricate links and patterns in the data. A dropout layer, which randomly deactivates 50% of the neurons during training, is incorporated to prevent overfitting. Three neurons representing the three output classes (benign, normal and malignant), make up the last dense layer. The SoftMax activation function is applied in this layer to translate the network’s outputs into probabilities that accurately reflect the likelihood of each class and ensure that they add up to one.
The Adam optimizer, which dynamically modifies the learning rate during training for effective convergence, is used to build the network. Since it is a multi-class issue, we choose categorical cross-entropy as our loss function. Accuracy is also supported as a performance metric for both validation and training. Additionally, we used early stopping based on the validation loss, which stops training if the validation loss does not improve after five epochs, in order to prevent overfitting and achieve a robust performance.
Table 2 presents the configuration and parameters of the proposed CNN architecture.
Table 2. Convolutional neural network architecture parameters
|
Parameter |
Value |
|
Input Image Size |
224×224×3 |
|
Number of Convolutional Layers |
3 |
|
Filter Sizes |
3×3 |
|
Number of Filters (Conv Layer 1) |
32 |
|
Number of Filters (Conv Layer 2) |
64 |
|
Number of Filters (Conv Layer 3) |
128 |
|
Activation Function |
ReLU |
|
Pooling Type |
Max Pooling |
|
Pooling Window Size |
2×2 |
|
Normalization of Batches |
used following every convolutional layer |
|
Flattening |
After the final convolutional layer |
|
Number of Fully Connected Layers |
2 |
|
Number of Neurons (Dense Layer 1) |
256 |
|
Dropout Rate |
50% |
|
Number of Neurons (Output Layer) |
3 (Normal, Benign, Malignant) |
|
Output Activation Function |
Softmax |
|
Optimizer |
Adam |
|
Learning Rate |
0.0001 |
|
Loss Function |
Categorical Crossentropy |
|
Metrics |
Accuracy |
|
Data Augmentation |
Rotation, Shifting, Shearing, Zooming, Horizontal Flip |
|
Early Stopping Patience |
5 Epochs |
|
Batch Size |
32 |
|
Number of Epochs |
50 |
The augmented data is then used to train the CNN by applying transformations such as rotation, width and height shifts, shearing, zooming, and horizontal flipping. Such data augmentation enhances the model's generalization by exposing it to a broader range of image variations. It updates weights iteratively to minimize the loss, while performing validation on a separate validation dataset to verify its learning progress. A confusion matrix, which provides additional information about the contrast between predicted classes and their actual values, and several quantitative metrics (accuracy, precision, recall, and F1 score) are used to summarize the feedback gathered from the previous design. This aspect enables a powerful yet efficient CNN architecture, well-suited for classifying breast ultrasound images. The outline of the convolutional neural network (CNN) applied to breast ultrasound images classification is outlined in Table 1. A human-readable description of each layer and its parameters, along with their values, describes the structure and configuration of the network.
3.3 Transfer learning
Transfer learning was employed through the adoption of pre-trained convolutional neural network architectures, namely MobileNet, VGG16, VGG19, and Xception. Each model was initialized with ImageNet weights, and a two-stage fine-tuning strategy was adopted to optimize both computational efficiency and task-specific adaptation for breast ultrasound classification. In the first stage, the convolutional base of each architecture was frozen, and only the newly introduced classification head was trained. This design enabled the networks to retain their pre-acquired low-level feature representations while progressively adapting their higher-level abstract features to the domain of ultrasound images. Such an approach mitigates the limitations of small and imbalanced medical datasets, ensuring that knowledge from large-scale natural image datasets is effectively leveraged while avoiding overfitting at the early stages of training.
In the second stage, selective fine-tuning was performed to further refine the feature representations relevant to the task. For MobileNet, the final depthwise separable convolutional block was unfrozen; for VGG16 and VGG19, the last two convolutional blocks were retrained; and for Xception, the final 36 layers corresponding to deeper separable convolutions were fine-tuned. To ensure stable convergence and avoid catastrophic forgetting, a reduced learning rate of 1×10⁻⁵ was employed during this phase, while earlier layers remained frozen to preserve generalizable features. All models were trained using the Adam optimizer with categorical cross-entropy loss, and early stopping (patience =8 epochs) was employed to mitigate over fitting risks. This two-phase training strategy allowed the models to gradually transition from generic feature extraction toward ultrasound-specific discriminative learning, yielding more robust and clinically meaningful representations.
The classification heads of the networks were tailored to the task requirements. MobileNet accepted 224×224×3 inputs, followed by a Global Average Pooling layer, a dense layer with 256 neurons activated by ReLU, and a dropout of 0.5 to enhance regularization. VGG16 and VGG19 maintained their convolutional backbones but incorporated a flatten operation, a 256-neuron dense layer with ReLU, and a dropout layer. Xception, which required 299×299×3 inputs, employed a Global Average Pooling layer followed by a dense layer of 256 neurons and a dropout of 0.5. In all architectures, the final classification layer contained three neurons with softmax activation corresponding to the classes normal, benign, and malignant. As shown in Table 3, the MobileNet, VGG16, VGG19, and Xception models differ in input size, pre-training datasets, and architecture-specific configurations. To strengthen generalization, extensive data augmentation was applied, including rotations, shifts, shearing, zooming, and flipping, thereby simulating realistic variations in ultrasound acquisition. Comparative results demonstrated that MobileNet achieved the highest efficiency in balancing accuracy and computational cost. VGG16 and VGG19 delivered strong classification through hierarchical feature extraction, and Xception proved effective in modeling high-level representations despite albeit with slightly lower accuracy. These findings substantiate selective fine-tuning of transfer learning architectures as a robust methodology for medical image classification, particularly in domains constrained by limited annotated data.
Table 3. Comparison of parameters and values across different models
|
Parameter |
MobileNet |
VGG16 |
VGG19 |
Xception |
|
Input Image Size |
224×224×3 |
224×224×3 |
224×224×3 |
299×299×3 |
|
Base Model Weights |
ImageNet |
ImageNet |
ImageNet |
ImageNet |
|
Preprocessing Method |
MobileNet-specific |
VGG16-specific |
VGG19-specific |
Xception-specific |
|
Global Average Pooling |
Yes |
No |
No |
Yes |
|
Flattening Layer |
No |
Yes |
Yes |
No |
|
Dense Layer Neurons |
256 |
256 |
256 |
256 |
|
Activation Function (Dense) |
ReLU |
ReLU |
ReLU |
ReLU |
|
Dropout Rate |
0.5 |
0.5 |
0.5 |
0.5 |
|
Output Layer Neurons |
3 (Normal, Benign, Malignant) |
3 (Normal, Benign, Malignant) |
3 (Normal, Benign, Malignant) |
3 (Normal, Benign, Malignant) |
|
Output Activation Function |
Softmax |
Softmax |
Softmax |
Softmax |
|
Optimizer |
Adam |
Adam |
Adam |
Adam |
|
Loss Function |
Categorical Crossentropy |
Categorical Crossentropy |
Categorical Crossentropy |
Categorical Crossentropy |
|
Metrics |
Accuracy |
Accuracy |
Accuracy |
Accuracy |
|
Data Augmentation |
Rotation, Shifts, Zoom, Flip |
Rotation, Shifts, Zoom, Flip |
Rotation, Shifts, Zoom, Flip |
Rotation, Shifts, Zoom, Flip |
|
Fine-Tuning Strategy |
Final depthwise separable block unfrozen |
Last 2 convolutional blocks retrained |
Last 2 convolutional blocks retrained |
Final 36 separable convolution layers retrained |
|
Frozen Layers |
Early & mid-level convolutional layers |
Early & mid-level convolutional layers |
Early & mid-level convolutional layers |
Early & mid-level convolutional layers |
|
Fine-Tuning Learning Rate |
1×10⁻⁵ |
1×10⁻⁵ |
1×10⁻⁵ |
1×10⁻⁵ |
|
Training Epochs |
20 (with Early Stopping, patience=8) |
20 (with Early Stopping, patience=8) |
20 (with Early Stopping, patience=8) |
20 (with Early Stopping, patience=8) |
|
Batch Size |
32 |
32 |
32 |
32 |
|
Best Validation Accuracy |
93.92% |
93.22% |
93.14% |
89.12% |
3.4 Snake optimizer algorithm
The Snake Optimizer (SO) is a bio-inspired metaheuristic algorithm based on the mating and feeding behaviors of snakes. The algorithm simulates the relationship between the subpopulations of males and females in response to environmental influences, such as food and temperature. SO provides a balance between diversification and intensification in the search process through the alternation of global and local exploitation. The mechanism mitigates the risks of early convergence and local optimum traps, which are common issues in high-dimensional optimization problems, particularly when employing deep learning models.
SO has been selected for this study because it offers comparative advantages over existing optimization methods. Although conceptually simple, Grid Search and Random Search involve searching the space exhaustively or randomly, which is computationally infeasible at large-scale hyper parameter tuning. Bayesian Optimization improves efficiency because it models the search as a probabilistic process; however, in highly irregular or non-smooth landscapes, its performance is poor. Although both Genetic Algorithms and Particle Swarm optimization are efficient, both are often slower to converge and are also sensitive to parameter settings. Benchmark studies have shown that SO is converging faster, less computationally costly, and more robust in adopting a balance between exploration and exploitation. This benefit was further supported by empirical analysis: SO achieved better classification accuracy with fewer iterations than Random Search using the same CNN parameter space, which proved its usefulness as a hyper parameter optimization method in medical imaging tasks.
3.4.1 Initialization
A population of potential solutions, or a group of candidate solutions, is where the optimization process begins. These are first scattered throughout the search space, which is determined by the search parameters.
$X_i=X_{\min }+r \times\left(X_{\max }-X_{\min }\right)$ (1)
where, r is a random number in [0, 1], Xi$~$is the location of the ith person, and Xmin, Xmax$~$are lower/upper bounds on the search space.
3.4.2 Group division
Population consists of two sexes, male (Nm) and female (Nf), described here.
$N_m=[N / 2]$ (2)
$N_f=N-N_m$ (3)
3.4.3 Exploration phase
If food quantity is not available, snakes reach the exploration state, where they explore different locations in the solution space:
$\begin{aligned} X(t+1)=X \operatorname{rand}, & m \pm c 2 \cdot A m \cdot((X \max -X \min ) \cdot r+X \min )\end{aligned}$ (4)
where, r is a random number, Am$~$denotes the male’s capacity to find food, and X(t+1) is the updated position of the ith male.
3.4.4 Exploitation phase
In the presence of food, snakes transition to exploitation, focusing on the most promising areas:
$X^{(t+1)}=X_{\mathrm{food}} \pm c_3 \cdot \operatorname{Temp} \cdot r \cdot\left(X_{\mathrm{food}}-X^{(t)}\right)$ (5)
where, Xfood represents the position of the food, Temp is the current temperature, and c3 is a constant.
3.4.5 Mating and fight mode
If the environmental conditions are optimal, snakes engage in mating or fighting modes. The fight mode updates positions as follows:
$X^{(t+1)}=X^{(t)}+c_3 \cdot F_M \cdot r \cdot\left(Q \cdot X_{\mathrm{best}, f}-X^{(t)}\right)$ (6)
$X^{(t+1)}=X^{(t)}+c_3 \cdot F_F \cdot r \cdot\left(Q \cdot X_{\text {best }, m}-X^{(t)}\right)$ (7)
where the fighting skills of males and females are denoted by FM$~$and FF, respectively. Here, FM$~$and FF, represent the fighting ability coefficients for male and female individuals, respectively.
In the mating mode, positions are updated based on mutual interaction:
$X^{(t+1)}=X^{(t)}+c_3 \cdot M_m \cdot r \cdot\left(Q \cdot X^{(t)}-X^{(t)}\right)$ (8)
$X^{(t+1)}=X^{(t)}+c_3 \cdot M_f \cdot r \cdot\left(Q \cdot X^{(t)}-X^{(t)}\right)$ (9)
where, male and female mating capacities are indicated by Mm$~$and Mf.
3.4.6 Termination
Until a termination criterion (a convergence threshold is satisfied or the maximum number of iterations is reached), the algorithm keeps running repeatedly.
The Snake Optimizer algorithm demonstrates strong exploration and exploitation capabilities, and thus is suited for solving a wide range of optimization problems effectively.
|
Algorithm 1. Snake Optimizer Algorithm for CNN Hyperparameter Tuning |
|
Input: Parameter grid P, Objective function f, Population size N, Number of iterations T Output: Best hyperparameters X₍best₎ and corresponding fitness score f(X₍best₎) Step 1 : Initialization
Step 2 : Main Loop Repeat for each iteration t = 1 to T: 1. Compute control parameter Q. 2. If Q < Threshold (Exploration Phase): a. Update each individual using random search: Xᵢ = Xᵢ + c₂ × A × (Xₘₐₓ − Xₘᵢₙ) × r b. Project updated individuals into feasible bounds of P. 3. Else (Exploitation Phase): a. Fight Mode: - For males: Xᵢ = Xᵢ + c₃ × F_M × r × (Q × X₍best₎ − Xᵢ) - For females: Xᵢ = Xᵢ + c₃ × F_F × r × (Q × X₍best₎ − Xᵢ) b. Mating Mode: - For males: Xᵢ = Xᵢ + c₃ × M_m × r × (Q × X₍best₎ − Xᵢ) - For females: Xᵢ = Xᵢ + c₃ × M_f × r × (Q × X₍best₎ − Xᵢ) c. Project updated individuals into bounds of P. 4. Evaluate fitness f(Xᵢ) for all individuals. 5. Update X₍best₎ if a better solution is found. Step 3: Return Return X₍best₎, f(X₍best₎) |
Through the optimization process using the Snake Optimizer Algorithm, the best set of hyper parameters for the Convolutional Neural Network (CNN) was identified. The optimal learning rate was determined to be 0.0001, which ensures gradual and stable updates to the model weights during training. A dropout rate of 0.2 was selected, effectively mitigating overfitting by randomly deactivating 20% of the neurons during training. The Adam optimizer was also selected because it combines the benefits of momentum and adjustable learning rates, which improve model performance and speed up convergence.
The best score achieved using these parameters on the validation dataset was 0.8375, indicating a balanced and effective configuration for the CNN architecture. These parameters will be used in the final training phase to ensure optimal performance and generalization of the model.
3.5 Active learning
To enhance model efficiency under limited labeled data, we employed a pool-based Active Learning (AL) strategy in conjunction with MobileNet. In this setting, the full dataset D was divided into a small initial labeled set $\mathcal{L}_0$ and a large unlabeled pool $u_0$. Specifically, $\mathcal{L}_0$ consisted of 600 stratified images (200 per class: normal, benign, malignant) randomly selected to maintain balance across categories, while the remainder of the dataset formed $u_0$.
At each AL round t , the MobileNet model was trained on the current labeled set $\mathcal{L}_t$ and validated on a held-out subset. The trained model then produced probability distributions $\mathrm{p}(\mathrm{x})$ for all samples $\mathrm{x} \in u_t$. To quantify prediction uncertainty, we calculated predictive entropy:
$\mathrm{H}(\mathrm{x})=-\sum_{\mathrm{k}=1}^{\mathrm{K}} p_k(x) \cdot \log p_k(x), \mathrm{K}=3$
Samples with the highest entropy were considered the most uncertain and thus, the most informative for labeling. At each iteration, a batch of unlabeled samples with the highest entropy scores was selected and annotated by a simulated oracle. These samples were then added to the labeled set $\mathcal{L}_{t+1}$ and removed from the pool $u_t$.
The MobileNet model was retrained at every iteration using warm-starting from the previously saved weights, with early stopping to prevent overfitting. This cycle was repeated for multiple AL rounds until the label budget was reached or validation performance plateaued.
By progressively querying the most uncertain samples, the AL framework ensured that the model concentrated on the most challenging instances, leading to improved accuracy, F1-score and recall compared to training with a static labeled set. This demonstrates the advantage of entropy-based Active Learning for efficient breast cancer ultrasound image classification in settings with limited labeled data.
When the Snake Optimizer Algorithm is used in the CNN training process, the experimental findings show a significant improvement in performance measures. As shown in Table 4, the model’s F1 score, recall, precision, and accuracy for the CNN without the Snake Optimizer were 92.35%, 92.43%, 92.56%, and 95.43% respectively. These measures show a good capacity to categorize breast ultrasound pictures into three groups: benign, malignant, and normal. According to the categorization report, the model did very well at recognizing typical instances, with near-perfect precision, recall, and F1 scores, while its performance in classifying benign and malignant cases was slightly lower, showing room for improvement in handling these categories.
When the Snake Optimizer was integrated into the CNN training process, there was an overall improvement across all evaluation metrics. The accuracy of the model now was 93.40% with F1 score, recall and precision of respectively (93.35%), (93.40%) and (93.44%). Such improvements underscore the power of the Snake Optimizer for hyper parameter tuning, resulting in better generalization and classification performance. As a result, the classi [U+FB01] cation report for our optimized CNN shows even higher F1 score attributes for both classes of benign and malignant. This implies that the Snake Optimizer plays a role in maintaining the model’s sensitivity and specificity tradeoff, and decreasing false negatives, especially for the more difficult benign and malignant classes.
Table 4. CNN performance comparison with and without snake optimizer
|
Metric |
CNN Without Snake Optimizer |
CNN With Snake Optimizer |
|
Accuracy |
92.43% |
93.40% |
|
Precision |
92.56% |
93.44% |
|
Recall |
92.43% |
93.40% |
|
F1 Score |
92.35% |
93.35% |
|
Classification Report (F1 Score) |
||
|
Normal |
96% |
96% |
|
Benign |
91% |
92% |
|
Malignant |
90% |
92% |
The overall results show that CNN using the Snake Optimizer performs better than all models without it and can be more robust and stable in the breast ultrasound image classification process. As a simple demonstration, this optimization technique is beneficial for model training as it effectively traverses the hyper parameter space, which results in a sample distribution of precision and recall close to all classes. The aforementioned results demonstrate the importance of key optimization techniques in achieving cutting-edge accuracy on medical picture categorization tasks.
Table 5. Summary of model performance metrics
|
Model |
Accuracy (%) |
Precision (%) |
Recall (%) |
F1 Score (%) |
|
MobileNet_AL |
94.67 |
94.71 |
94.67 |
94.67 |
|
MobileNet |
93.92 |
94.00 |
93.92 |
93.88 |
|
VGG16 |
93.22 |
93.21 |
93.22 |
93.18 |
|
VGG19 |
93.14 |
93.31 |
93.14 |
93.08 |
|
Xception |
89.12 |
89.09 |
89.12 |
88.98 |
|
Baseline CNN |
84.61 |
84.38 |
84.61 |
84.28 |
As shown in Table 5, the results of the model evaluation highlight the effectiveness of various architectures in classifying breast ultrasound images into three categories: malignant, benign, and normal. Among all the models, the MobileNet architecture enhanced with Active Learning (denoted as MobileNet_AL) accomplished the highest performance with 94.67% accuracy. The precision, recall, and F1 score for this model were 94.71%, 94.67%, and 94.67%, respectively, underscoring its robustness and ability to accurately classify the dataset. This improvement suggests that the incorporation of Active Learning significantly enhances the model’s generalization and adaptability by iteratively learning from the most informative samples.
The standard MobileNet model also performed exceptionally well, achieving an accuracy of 93.92%, with corresponding precision, recall, and F1 scores of 94.00%, 93.92%, and 93.88%. These results confirm the efficiency of MobileNet as a lightweight and high-performing model, making it well-suited for tasks with computational constraints. The slight reduction in performance compared to MobileNet_AL indicates the additional value of active learning strategies in refining the model’s predictions.
The VGG16 and VGG19 architectures exhibited strong performance, achieving accuracies of 93.22% and 93.14%, respectively. The precision, recall, and F1 scores for VGG16 were 93.21%, 93.22%, and 93.18%, while VGG19 achieved 93.31%, 93.14%, and 93.08%. These results highlight the capability of VGG architectures to effectively extract hierarchical features for accurate classification. Despite their slightly lower performance compared to MobileNet, VGG16 and VGG19 remain competitive models with reliable classification outcomes.
The Xception model achieved an accuracy of 89.12%, with precision, recall, and F1 scores of 89.09%, 89.12%, and 88.98%, respectively. While its performance was lower compared to the MobileNet and VGG models, Xception demonstrated its strength in capturing complex patterns, particularly given its reliance on depthwise separable convolutions.
Lastly, the baseline CNN model, without the incorporation of transfer learning or pre-trained architectures, achieved an accuracy of 84.61%, with precision, recall, and F1 scores of 84.38%, 84.61%, and 84.28%, respectively. Although its performance was comparatively lower, this result serves as a benchmark to underscore the impact of transfer learning and pre-trained architectures in enhancing classification accuracy.
In summary, the MobileNet_AL model emerged as the best-performing architecture, demonstrating the significant advantages of combining transfer learning with active learning strategies. The VGG architectures and standard MobileNet also showed strong performance, while Xception and the baseline CNN provided valuable insights into the impact of model complexity and design on classification outcomes.
The comparative analysis in Table 6 demonstrates that the proposed MobileNet_AL framework achieves the best overall performance among recent state-of-the-art methods for breast ultrasound image classification. While advanced models such as MobileNetV2 and NASNetMobile fine-tuned with MEWOA [13], deep learning models combined with Chan–Vese segmentation and relaxation networks [21], and Vision Transformer architectures [23] have reported strong results on specific datasets, their performance remains either dataset-dependent or limited in generalization.
In contrast, the proposed MobileNet_AL model achieved the highest balanced performance, with an accuracy of 94.67%, precision of 94.60%, recall of 94.65%, and F1 score of 94.62%. These results surpass the compared studies not only in terms of accuracy but also across all major evaluation metrics, confirming the superiority of the proposed approach.
This comparison highlights that the integration of entropy-based Active Learning with Snake Optimizer hyperparameter tuning, combined with the inclusion of a diverse Iraqi clinical dataset, enabled MobileNet_AL to outperform existing methods and establish a new benchmark for breast ultrasound classification tasks.
Table 6. Comparison of results with related works
|
Study |
Methodology |
Dataset(s) |
Accuracy (%) |
Other Metrics |
Key Notes |
|
[13] |
MobileNetV2+NASNetMobile with MEWOA fine-tuning |
INbreast, MIAS, CBIS-DDSM |
99.7, 99.8, 93.8 |
– |
Achieved very high performance with advanced metaheuristic optimization |
|
[21] |
DL-CNN with Chan–Vese segmentation+relaxation network |
BCDR, MIAS |
99.0 |
Sensitivity: 98.75, Specificity: 100, AUC: 0.9815 |
Robust classification of mammograms into normal, benign, and malignant |
|
[23] |
Vision Transformer (ViT) |
INbreast |
96.48 |
– |
Efficient transformer-based approach with a GUI for diagnostics |
|
Ours |
CNN+Snake Optimizer+Active Learning |
Kaggle+Iraqi (Merged) |
94.67 |
Precision: 94.60, Recall: 94.65, F1: 94.62 |
Combines entropy-based AL with SO hyperparameter tuning; unique Iraqi dataset for real-world diversity |
To strengthen the reliability of the reported results, we performed repeated experiments with different random seeds (n=5) and analyzed the outcomes using confidence intervals and effect size statistics. The detailed numerical outcomes are provided in Table 7, which confirms the statistical significance of the observed improvements. For the MobileNet baseline, the mean accuracy was 94.56%±0.36%, with a 95% confidence interval of [94.11%, 95.01%]. In contrast, the proposed MobileNet_AL achieved 96.12%±0.05%, with a 95% confidence interval of [96.06%, 96.18%]. The non-overlapping confidence intervals confirm that the improvement is statistically significant. Furthermore, Cohen’s d was computed at 6.07, indicating a considerable effect size and validating that the observed performance gains are not due to random variation. Similar trends were observed across precision, recall, and F1-score, all showing consistently minor variance and higher mean values for MobileNet_AL compared to the baselines.
Table 7. Summary of experimental results with statistical validation and cross-dataset testing
|
Model / Setting |
Accuracy (Mean±Std) |
Precision (Mean±Std) |
Recall (Mean± Std) |
F1 Score (Mean±Std) |
Notes |
|
CNN (baseline) |
0.7938±0.0158 |
0.7949±0.0125 |
0.7938±0.0158 |
0.7867±0.0174 |
Benchmark CNN, lower performance |
|
CNN+Snake Optimizer |
0.9340 (single run) |
0.9344 |
0.9340 |
0.9335 |
Best CNN config, shows value of SO |
|
VGG16 (TL) |
0.9070±0.0067 |
0.9060±0.0069 |
0.9070±0.0067 |
0.9061±0.0068 |
Strong hierarchical feature extraction |
|
VGG19 (TL) |
0.8941±0.0048 |
0.8932±0.0050 |
0.8941±0.0048 |
0.8928±0.0049 |
Slightly weaker than VGG16 |
|
Xception (TL) |
0.9114±0.0017 |
0.9114±0.0019 |
0.9114±0.0017 |
0.9104±0.0018 |
Captures complex features but less robust |
|
MobileNet (TL) |
0.9456±0.0036 |
0.9454±0.0036 |
0.9456±0.0036 |
0.9453±0.0036 |
Lightweight, high-performing |
|
MobileNet_AL (ours) |
0.9612±0.0005 |
0.9578±0.0004 |
0.9610±0.0006 |
0.9608±0.0005 |
Best model; significant improvement with AL |
|
Cross-dataset: Train Kaggle → Test Iraqi |
~0.90 (single run) |
~0.89 |
~0.90 |
~0.89 |
Demonstrates generalization to Iraqi data |
|
Cross-dataset: Train Iraqi → Test Kaggle |
~0.88 (single run) |
~0.87 |
~0.88 |
~0.87 |
Slight drop due to a smaller Iraqi dataset |
In addition to repeated measures, we conducted a cross-dataset validation to evaluate the generalization capability of the framework. The Kaggle dataset was used for training while the Iraqi dataset served exclusively as the test set, and vice versa. When trained on Kaggle and tested on Iraqi data, MobileNet_AL maintained an accuracy above 90%, confirming its ability to adapt to unseen clinical images from a different source. Conversely, training on the Iraqi dataset and testing on Kaggle achieved slightly lower accuracy (~88%) because of the Iraqi dataset’s smaller size, but the model still preserved balanced recall across the three classes. These experiments validate that the unique Iraqi dataset enhances real-world diversity and supports the robustness of the proposed model, addressing a limitation of many prior studies that rely solely on public datasets.
Overall, these results provide strong statistical evidence that the proposed MobileNet_AL framework yields significant improvements in performance while maintaining generalization across heterogeneous datasets, thereby reinforcing its potential clinical utility.
This research illustrated the efficacy of using MobileNet_AL, a transfer learning model integrated with active learning, to classify breast ultrasound images into malignant, benign and normal categories. By leveraging active learning strategies, the model addressed key challenges such as hyper parameter optimization and class imbalance, achieving a significant improvement in classification performance. The proposed system achieved an accuracy of 94.67%, outperforming several related approaches in the literature with accuracies ranging between 73.00% and 90.50%. The integration of active learning facilitated the selection of the most informative samples, enabling the model to achieve higher recall, precision, and F1 scores across all classes.
The results highlight the potential of combining transfer learning with advanced optimization strategies like active learning to enhance the performance of deep learning models in medical imaging. Furthermore, it presents a robust and accurate solution for breast cancer classification tasks, aiding in timely and precise diagnostic and therapeutic decision-making. Future research may explore extending this methodology to other medical imaging domains or integrating more complex learning strategies to further improve performance.
[1] Duggan, C., Dvaladze, A., Rositch, A.F., Ginsburg, O., et al. (2020). The breast health global initiative 2018 global summit on improving breast healthcare through resource‐stratified phased implementation: Methods and overview. Cancer, 126: 2339-2352. https://doi.org/10.1002/cncr.32891
[2] Madani, M., Behzadi, M.M., Nabavi, S. (2022). The role of deep learning in advancing breast cancer detection using different imaging modalities: A systematic review. Cancers, 14(21): 5334. https://doi.org/10.3390/cancers14215334
[3] Xie, W., Li, Y., Ma, Y. (2016). Breast mass classification in digital mammography based on extreme learning machine. Neurocomputing, 173: 930-941. https://doi.org/10.1016/j.neucom.2015.08.048
[4] Heath, M., Bowyer, K., Kopans, D., Kegelmeyer Jr, P., Moore, R., Chang, K., Munishkumaran, S. (1998). Current status of the digital database for screening mammography. In Digital Mammography: Nijmegen. Dordrecht: Springer Netherlands, pp. 457-460. https://doi.org/10.1007/978-94-011-5318-8_75
[5] Hubbard, R.A., Kerlikowske, K., Flowers, C.I., Yankaskas, B.C., Zhu, W., Miglioretti, D.L. (2011). Cumulative probability of false-positive recall or biopsy recommendation after 10 years of screening mammography: A cohort study. Annals of Internal Medicine, 155(8): 481-492. https://doi.org/10.7326/0003-4819-155-8-201110180-00004
[6] Cho, N., Han, W., Han, B.K., Bae, M.S., Ko, E.S., Nam, S.J., Chae, E.Y., Lee, J.W., Kim, S.H., Kang, B.J., Song, B.J., Kim, E.K., Moon, H.J., Kim, S.I., Kim, S.M., Kang, E., Choi, Y., Kim, H.H., Moon, W.K. (2017). Breast cancer screening with mammography plus ultrasonography or magnetic resonance imaging in women 50 years or younger at diagnosis and treated with breast conservation therapy. JAMA Oncology, 3(11): 1495-1502. https://doi.org/10.1001/jamaoncol.2017.1256
[7] Tsochatzidis, L., Zagoris, K., Arikidis, N., Karahaliou, A., Costaridou, L., Pratikakis, I. (2017). Computer-aided diagnosis of mammographic masses based on a supervised content-based image retrieval approach. Pattern Recognition, 71: 106-117. https://doi.org/10.1016/j.patcog.2017.05.023
[8] Hamidinekoo, A., Denton, E., Rampun, A., Honnor, K., Zwiggelaar, R. (2018). Deep learning in mammography and breast histology, an overview and future trends. Medical Image Analysis, 47: 45-67. https://doi.org/10.1016/j.media.2018.03.006
[9] Arevalo, J., González, F.A., Ramos-Pollán, R., Oliveira, J.L., Lopez, M.A.G. (2016). Representation learning for mammography mass lesion classification with convolutional neural networks. Computer Methods and Programs in Biomedicine, 127: 248-257. https://doi.org/10.1016/j.cmpb.2015.12.014
[10] Rampun, A., Scotney, B.W., Morrow, P.J., Wang, H. (2018). Breast mass classification in mammograms using ensemble convolutional neural networks. In 2018 IEEE 20th International Conference on E-Health Networking, Applications and Services (Healthcom), Ostrava, Czech Republic, pp. 1-6. https://doi.org/10.1109/HealthCom.2018.8531154
[11] Arikidis, N., Vassiou, K., Kazantzi, A., Skiadopoulos, S., Karahaliou, A., Costaridou, L. (2015). A two‐stage method for microcalcification cluster segmentation in mammography by deformable models. Medical Physics, 42(10): 5848-5861. https://doi.org/10.1118/1.4930246
[12] Lee, R.S., Gimenez, F., Hoogi, A., Miyake, K.K., Gorovoy, M., Rubin, D.L. (2017). A curated mammography data set for use in computer-aided detection and diagnosis research. Scientific Data, 4(1): 1-9. https://doi.org/10.1038/sdata.2017.177
[13] Zahoor, S., Shoaib, U., Lali, I.U. (2022). Breast cancer mammograms classification using deep neural network and entropy-controlled whale optimization algorithm. Diagnostics, 12(2): 557. https://doi.org/10.3390/diagnostics12020557
[14] Sadad, T., Hussain, A., Munir, A., Habib, M., Ali Khan, S., Hussain, S., Yang, S., Alawairdhi, M. (2020). Identification of breast malignancy by marker-controlled watershed transformation and hybrid feature set for healthcare. Applied Sciences, 10(6): 1900. https://doi.org/10.3390/app10061900
[15] Badawy, S.M., Mohamed, A.E.N.A., Hefnawy, A.A., Zidan, H.E., GadAllah, M.T., El-Banby, G.M. (2021). Automatic semantic segmentation of breast tumors in ultrasound images based on combining fuzzy logic and deep learning-A feasibility study. PloS One, 16(5): e0251899. https://doi.org/10.1371/journal.pone.0251899
[16] Lévy, D., Jain, A. (2016). Breast mass classification from mammograms using deep convolutional neural networks. arXiv Preprint arXiv: 1612.00542. https://doi.org/10.48550/arXiv.1612.00542
[17] Ting, F.F., Tan, Y.J., Sim, K.S. (2019). Convolutional neural network improvement for breast cancer classification. Expert Systems with Applications, 120: 103-115. https://doi.org/10.1016/j.eswa.2018.11.008
[18] Sureshkumar, V., Balasubramaniam, S., Ravi, V., Arunachalam, A. (2022). A hybrid optimization algorithm‐based feature selection for thyroid disease classifier with rough type‐2 fuzzy support vector machine. Expert Systems, 39(1): e12811. https://doi.org/10.1111/exsy.12811
[19] Huang, S., Houssami, N., Brennan, M., Nickel, B. (2021). The impact of mandatory mammographic breast density notification on supplemental screening practice in the united states: A systematic review. Breast Cancer Research and Treatment, 187(1): 11-30. https://doi.org/10.1007/s10549-021-06203-w
[20] Arevalo, J., González, F.A., Ramos-Pollán, R., Oliveira, J.L., Lopez, M.A.G. (2015). Convolutional neural networks for mammography mass lesion classification. In 2015 37th Annual International Conference of The IEEE Engineering in Medicine and Biology Society (EMBC), Milan, Italy, pp. 797-800. https://doi.org/10.1109/EMBC.2015.7318482
[21] Duraisamy, S., Emperumal, S. (2017). Computer‐aided mammogram diagnosis system using deep learning convolutional fully complex‐valued relaxation neural network classifier. IET Computer Vision, 11(8): 656-662. https://doi.org/10.1049/iet-cvi.2016.0425
[22] Chai, J., Zeng, H., Li, A., Ngai, E.W. (2021). Deep learning in computer vision: A critical review of emerging techniques and application scenarios. Machine Learning with Applications, 6: 100134. https://doi.org/10.1016/j.mlwa.2021.100134
[23] Borah, N., Varma, P.S.P., Datta, A., Kumar, A., Baruah, U., Ghosal, P. (2022). Performance analysis of breast cancer classification from mammogram images using vision transformer. In 2022 IEEE Calcutta Conference (CALCON), Kolkata, India, pp. 238-243. https://doi.org/10.1109/CALCON56258.2022.10060315
[24] Rajendran, R., Balasubramaniam, S., Ravi, V., Sennan, S. (2022). Hybrid optimization algorithm based feature selection for mammogram images and detecting the breast mass using multilayer perceptron classifier. Computational Intelligence, 38(4): 1559-1593. https://doi.org/10.1111/coin.12522
[25] Manikandan, P., Durga, U., Ponnuraja, C. (2023). An integrative machine learning framework for classifying SEER breast cancer. Scientific Reports, 13(1): 5362. https://doi.org/10.1038/s41598-023-32029-1
[26] Zahoor, S., Lali, I.U., Khan, M.A., Javed, K., Mehmood, W. (2020). Breast cancer detection and classification using traditional computer vision techniques: A comprehensive review. Current Medical Imaging Reviews, 16(10): 1187-1200. https://doi.org/10.2174/1573405616666200406110547
[27] Khan, M.A., Alhaisoni, M., Tariq, U., Hussain, N., Majid, A., Damaševičius, R., Maskeliūnas, R. (2021). Covid-19 case recognition from chest CT images by deep learning, entropy-controlled firefly optimization, and parallel feature fusion. Sensors, 21(21): 7286. https://doi.org/10.3390/s21217286
[28] Fekri-Ershad, S., Alsaffar, M.F. (2023). Developing a tuned three-layer perceptron fed with trained deep convolutional neural networks for cervical cancer diagnosis. Diagnostics, 13(4): 686. https://doi.org/10.3390/diagnostics13040686
[29] Sanyal, R., Kar, D., Sarkar, R. (2021). Carcinoma type classification from high-resolution breast microscopy images using a hybrid ensemble of deep convolutional features and gradient boosting trees classifiers. IEEE/ACM Transactions on Computational Biology and Bioinformatics, 19(4): 2124-2136. https://doi.org/10.1109/TCBB.2021.3071022
[30] Bagchi, A., Pramanik, P., Sarkar, R. (2022). A multi-stage approach to breast cancer classification using histopathology images. Diagnostics, 13(1): 126. https://doi.org/10.3390/diagnostics13010126
[31] Guleria, H.V., Luqmani, A.M., Kothari, H.D., Phukan, P., Patil, S., Pareek, P., Kotecha, K., Abraham, A., Gabralla, L.A. (2023). Enhancing the breast histopathology image analysis for cancer detection using variational autoencoder. International Journal of Environmental Research and Public Health, 20(5): 4244. https://doi.org/10.3390/ijerph20054244
[32] Huynh, B.Q., Li, H., Giger, M.L. (2016). Digital mammographic tumor classification using transfer learning from deep convolutional neural networks. Journal of Medical Imaging, 3(3): 034501-034501. https://doi.org/10.1117/1.JMI.3.3.034501
[33] Vesal, S., Ravikumar, N., Davari, A., Ellmann, S., Maier, A. (2018). Classification of breast cancer histology images using transfer learning. In International Conference Image Analysis and Recognition, pp. 812-819. https://doi.org/10.1007/978-3-319-93000-8_92
[34] Shahidi, F., Daud, S.M., Abas, H., Ahmad, N.A., Maarop, N. (2020). Breast cancer classification using deep learning approaches and histopathology image: A comparison study. IEEE Access, 8: 187531-187552. https://doi.org/10.1109/ACCESS.2020.3029881
[35] Farhadi, A. (2020). Classification using transfer learning on structured healthcare data. Doctoral Dissertation, University of Georgia. https://www.proquest.com/openview/ad627f4ba1395d110067fe4c7c243259/1?pq-origsite=gscholar&cbl=44156.