Ying Du![]() | Yingying Xie
| Yingying Xie![]() | Zhijie Han
| Zhijie Han![]() | Pu Cheng
| Pu Cheng![]() | Wei Zhao*
| Wei Zhao*![]()
© 2025 The authors. This article is published by IIETA and is licensed under the CC BY 4.0 license (http://creativecommons.org/licenses/by/4.0/).
OPEN ACCESS
Utilizing deep learning methods for retinal vessel segmentation is crucial for aiding ophthalmologists in diagnosing fundus diseases clinically. However, existing deep learning models often fail to achieve ideal performance when facing complex scenarios such as multi-directional vascular endings and overlapping intersections in the retina. In order to improve the detection rate of retinal blood vessels and ensure high connectivity, this paper proposes a new method EDCE-Net, which combines the directional information and scale differences of retinal blood vessels for the first time. Specifically, by designing an edge detection module (EDM) to assist the model in extracting vascular details and directional information at different scales, and integrating them into the depth feature map, it ensures the restoration of lost edge information while maintaining the correctness of the global topology. Additionally, this paper designs a connectivity enhancement module (CEM) based on multi-scale coordinate attention to effectively assist the model in establishing long-range spatial dependencies in spatial directions, accurately capturing and locating crossing and overlapping vessel structures, so as to improve the connectivity of vessel segmentation. Finally, we employ multiple auxiliary loss functions to provide hierarchical supervision for the model, fully considering the impact of various levels of feature maps on the segmentation outcomes, thereby enhancing the robustness of the model. EDCE-Net was validated on four public datasets: DRIVE, CHASE_DB1, STARE, and DCA1, achieving AUC values of 98.79%, 98.76%, 98.06%, and 99.08%, respectively, which are the highest compared to several existing advanced methods. JI reached 70.15%, 68.84%, 70.52%, and 68.37% on these datasets, respectively, representing improvements of 2.51%, 3.58%, 2.06%, and 5.3% compared to the baseline, highlighting the potential of the proposed method in aiding retinal disease diagnosis.
deep learning, retinal vessel segmentation, encoder-decoder, edge detection, connectivity enhancement
In recent years, significant advancements have occurred in retinal vessel segmentation through deep learning [1, 2].
Deep neural networks, with their excellent feature extraction capabilities, can not only accurately capture contextual associations in retinal images, but also construct multi-level feature expressions, effectively improving the accuracy of vascular segmentation. Nevertheless, there are still certain constraints associated with current methods. Firstly, the continuous convolution and down-sampling operations of the traditional model inevitably compress the image resolution, leading to the loss of edge information containing vascular spatial features [3]. Secondly, considering the complex structure of retinal vessel crossovers and overlaps, existing models often struggle to grasp the long-distance dependence between vascular pixels, which may lead to disconnected segmentation results [4].
The above problems lead to suboptimal extraction results, manifested as blurred vessel edges and poor connectivity. To tackle this, we propose an Edge Detection and Connectivity Enhancement Network (EDCE-Net). Firstly, regarding the loss of vascular end details in continuous convolution and down-sampling, we propose an Edge Detection Module (EDM) that effectively captures the edge information from the encoded feature map of the vessel. Secondly, to enhance vessel connectivity, we propose a Connectivity Enhancement Module (CEM) that accurately locates the position information of overlapping vessels, thereby enhancing the connectivity of segmentation results. Finally, we design amultiple auxiliary loss functions (ML) to achieve hierarchical supervision of the model. We implement our idea in the proposed EDCE-Net, and conduct a large number of experiments on four popular datasets. The contributions of this paper are as follows:
(1) Combining vascular morphology and scale differences, EDM based on Sobel operator and multi-directional feature pyramid is designed to effectively help the model extract vascular details and directional information at different scales, addressing the issue of vascular edge loss.
(2) CEM is proposed to effectively assist the model in establishing remote dependencies in the spatial direction, improving the network's ability to handle complex situations such as vessel crossings and overlaps, thereby enhancing the connectivity of segmentation results.
(3) A branch-weighted loss mechanism, implemented within a deep supervision network, enhances the network model by integrating ML into the decoder layer during training, resulting in improved segmentation outcomes.
Recently, the latest trends in retinal vessel segmentation research indicate that deep learning is playing an important role as a key technology. As a popular deep learning framework, the advantage of UNet [5] in medical image segmentation lies in its flexible full convolution network structure. UNet can avoid the loss of information and help extract high-level feature representation and map it back to the input image space. However, facing the complex and ever-changing morphology of retinal blood vessels, traditional UNet networks are unable to meet segmentation requirements, prompting researchers to continuously explore improvement solutions.
Alom et al. [6] proposed R2-Unet, which achieves progressive feature accumulation by embedding cyclic convolutional layers, aiming to provide more efficient feature representation for retinal vessel segmentation tasks. Zhou et al. [7] proposed an improved architecture called Unet++ to address the issue of feature fusion efficiency in the Unet model. By designing dense skip connections and more refined feature fusion paths, the original encoder-decoder structure was optimized; Huang et al. [8] developed the Unet3+ based on Unet, which enhances the integration ability of multi-scale contextual information by constructing a multi-level and cross-stage feature interaction mechanism, thereby improving the performance of image segmentation tasks. Gu et al. [3] proposed the CE-Net and effectively optimized the segmentation performance of medical images by introducing multi-scale Arous convolution to capture richer semantic features. Yang et al. [9] proposed NAUNet, as a lightweight encoder-decoder network, constructs an efficient attention module that captures richer global information through a channel interaction mechanism and introduces a dropout regularization strategy to randomly discard local semantic information, promoting the network to learn more robust feature representations. Guo et al. [10] proposed SA-Unet, which focuses on key region features by introducing embedded spatial attention mechanisms while suppressing irrelevant information interference and enhancing the extraction of effective spatial features. This significantly improves the network's modeling ability for spatial contextual information, thereby more accurately capturing the spatial structural features of retinal blood vessels. Wang et al. [11] designed a dual decoding framework to retain spatial information and semantic information respectively. Dong et al. [12] proposed CRAUNet, which replaces the skip connections in the original model with attention mechanisms to explore useful information while greatly reducing the risk of overfitting; Liu et al. [13] proposed FR-Unet, which achieves complete preservation of image resolution and expansion of horizontal and vertical dimensions through the use of a multi-resolution convolution interaction mechanism. It also uses a feature aggregation module to fuse adjacent stage feature maps across layers, ultimately achieving high-precision detail segmentation in pixel-level retinal vessel segmentation tasks. Li et al. [14] studied a dynamic channel graph convolutional network model, which is one of the models that applies graph neural networks to retinal vessel segmentation. By constructing a topological space mapping mechanism with channel dimensions, the utilization efficiency of multi-channel feature information has been significantly improved; Qu et al. [15] proposed TP-Net, which adopts a dual path architecture to construct a parallel structure of main and sub-branches, focusing on feature extraction of main blood vessels and low contrast fine blood vessels, respectively. This model achieves targeted processing of blood vessels of different scales through differentiated path design, demonstrating excellent segmentation performance while maintaining a lightweight parameter scale. Transformers [16] have also been applied to image segmentation, giving rise to classic models such as TransUnet [17] and SwinUnet [18], which integrate Transformer mechanisms to enhance global context dependency modeling. Recently, Hu et al. [19] proposed a hybrid Transformer for fundus image analysis, combining a feature refinement module and a feature fusion module to capture local details and enable long-range information exchange, thereby improving vessel segmentation accuracy. Meanwhile, Rahman and Marculescu [20] introduced a cascaded graph attention decoder that refines multi-level feature maps (output by a hierarchical Transformer encoder) through efficient graph convolution blocks.
However, in pixel-level image segmentation tasks, graph neural networks (GNNs) and Transformer architectures often generate massive parameters, significantly increasing computational complexity and conflicting with the goal of lightweight, efficient models. Additionally, some unsupervised methods have been proposed to reduce manual annotation efforts [21, 22].
However, existing segmentation models still have certain limitations in capturing complex pixels such as retinal vessel end structures and cross overlaps. To overcome these limitations, this paper proposes a retinal vascular structure perception method that accurately detects the ends of blood vessels in all directions while ensuring high connectivity.
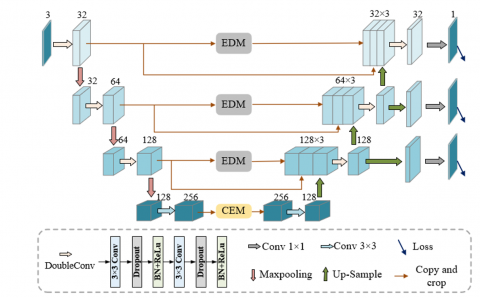
The framework of EDCE-Net is shown in Figure 1, including encoder, decoder, EDM, CEM, ML. Because the different levels of feature map of the encoder focus on different types of vascular information, we embed the designed EDM into the lower-level extraction stage of the encoder containing more detailed features, so as to detect the edge information of retinal vessels. The encoder and decoder are connected through CEM to enrich the high-level semantic information in the image and enhance the spatial correlation between different regions. In addition, the dynamic optimization model of multiple auxiliary loss branches is used to improve the segmentation performance.
Figure 1. EDCE-Net network framework
3.1 EDM
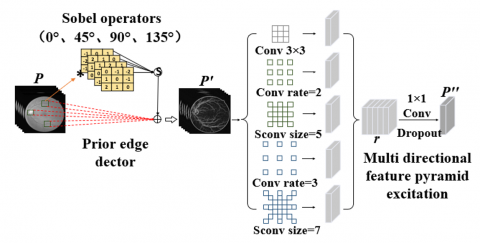
Retinal blood vessels often have complex branches and curves, especially in small vascular structures. To address this issue, we designed EDM based on the Sobel operator to preserve these details, thereby more comprehensively representing the shape and structure of blood vessels.
The improved Sobel operator can effectively extract the vessel edge information in the 0°, 45°, 90°, and 135° directions in the original image. In Figure 2, S represents the operation shown in Eq. (1). The process is as follows:
${{P}^{\prime }}=\sqrt{P_{{{0}^{{}^\circ }}}^{2}+P_{{{45}^{{}^\circ }}}^{2}+P_{{{90}^{{}^\circ }}}^{2}+P_{{{135}^{{}^\circ }}}^{2}}$ (1)
where, P represents the input image, P' is the edge output obtained through the Sobel operator.
Figure 2. Edge Detection Module (EDM)
The P' containing edge information is input into the multi-directional feature pyramid pool for feature excitation to enhance the edges in different directions of the retinal image. The key to multi-directional characteristic pyramid excitation is two convolutions, which include convolutions in four different directions: 0°, 45°, 90°, and 135° [23, 24]. This convolution kernel corresponds one-to-one to the improved Sobel edge detection operator, and can fully adapt to the striped and directional characteristics of retinal blood vessels.
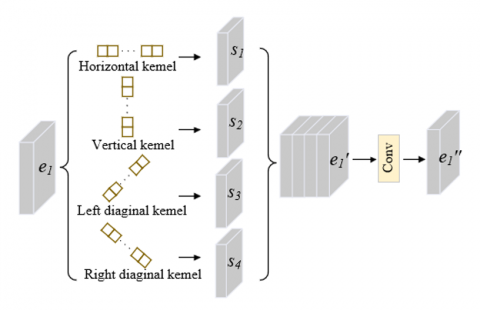
In Figure 3, $e_1 \in \mathbb{R}^{H \times W \times C}$ is the input of the strip convolution, which is sent to four parallel paths to obtain four output feature maps $S_i \in \mathbb{R}^{H \times W \times C / 4}$ (i=1,2,3,4). The four feature maps are concatenated by channel dimension to obtain $e_1^{\prime} \in \mathbb{R}^{H \times W \times C}$. The output process is as follows:
$e_{1}^{\prime }={{\left( {{e}_{1}}*\omega \right)}_{D}}[i,j]\text{ }=\sum\limits_{t=-k}^{k}{{{e}_{1}}}\left[ i+{{D}_{H}}t,j+{{D}_{W}}t \right]\cdot \omega [k-t]$ (2)
where, $e_1 * \omega$ is a convolution operation, $\omega \in \mathbb{R}^{2 k+1}$ is a strip convolution filter with size 2k+1, and D=(DH,DW) is the direction vector of the strip convolution.
Figure 3. Strip convolution
The multi-directional feature pyramid pooling module we designed is inspired by spatial pyramid pooling modules such as ASPP [25]. In Figure 2, the multi-directional feature pyramid pooling module introduces three different convolutions, including a 3×3 convolution, two different sizes of dilated convolutions, and two different sizes of strip convolutions. We connect these five feature maps by channel dimension to form a richer and more comprehensive feature representation $r \in \mathbb{R}^{H \times W \times 5 C}$, which improves the receptive field of the network while enhancing the affinity between pixels in the retinal vascular neighborhood, thus accurately capturing edge information in different directions.
Finally, we use a 1×1 convolutional kernel to reduce the dimensionality of the feature representation, and add dropout to prevent overfitting, resulting in the final feature representation $P^{\prime \prime} \in \mathbb{R}^{H \times W \times C}$.
$\begin{align} & r=\text{ Concat }\left[ {{f}^{3\times 3}}\left( {{P}^{\prime }} \right);{{d}^{\text{rate }=2}}\left( {{P}^{\prime }} \right) \right.; \\ & \left. {{s}^{\text{size }=5}}\left( {{P}^{\prime }} \right);{{d}^{\text{rate }=3}}\left( {{P}^{\prime }} \right);{{s}^{\text{size }=7}}\left( {{P}^{\prime }} \right) \right] \\\end{align}$ (3)
${{P}^{\prime \prime }}=D\left( {{\operatorname{conv}}^{1\times 1}}(r) \right)$ (4)
Concat[·] is the concatenation operation, $f^{3 \times 3}$ represents convolution with a kernel size of 3, $d^{\text {rate }=2}, d^{\text {rate }=3}$, respectively, represent dilated convolution with expansion rates of 2 and 3, $s^{\text {size }=5}, s^{\text {size }=7}$, respectively, represent strip convolution with kernel sizes of 5 and 7. D is the dropout function to prevent overfitting [26].
3.2 CEM
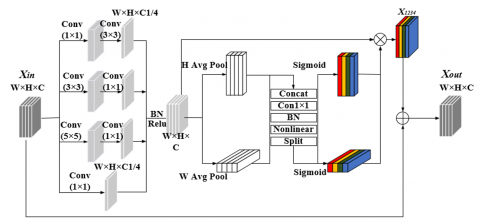
To address the problem of low connectivity caused by complex vascular structures and noise, we design CEM that accurately captures the remote dependencies between pixels by introducing a multi-scale coordinate attention with a residual mechanism. Multi-scale coordinate attention further emphasizes the criticality of different locations in the image, while the residual mechanism helps to effectively transfer and integrate local and global feature details, making EDCE-Net more responsive to complex vascular structures (Figure 4).
Figure 4. Connectivity Enhancement Module (CEM)
We take the output of the final layer encoder as the input $X_{\text {in }} \in \mathbb{R}^{H \times W \times C}$ of CEM. By combining convolution kernels of different sizes, the rich multi-scale information in the image is extracted and integrated into X1234. Then, the dependency between adjacent pixels is perceived from the horizontal and vertical directions through the embedded coordinate attention mechanism, so as to obtain the feature map X'1234 with rich long-distance position interaction information. The X'1234 is superimposed on the input characteristic map to form a residual connection. This process aims to maintain the effective transmission of global features while improving vascular connectivity. Finally, we get the characteristic graph Xout.
3.3 Multiple auxiliary loss function (ML)
The potential loss of basic feature information that may occur when a single loss function adjusts network weights [27], we deeply consider the different degrees of impact of feature maps at different levels on the final segmentation results by using multiple branch losses.
In this paper, binary cross entropy losses are calculated for the different outputs of the last three levels and assigned different loss weights. The output of the top layer with high resolution and rich details has the greatest impact on the final segmentation result, with a loss weight set at 0.6, The intermediate layer containing intermediate level feature information assists in fine segmentation of the topmost layer while balancing the entire network, with a loss weight set at 0.3. The lowest level is responsible for capturing global and abstract feature information, so the weight is set to 0.1 to avoid excessive attention to low-level features. Finally, the weighted losses of each layer are added together to better capture the feature information of different layers during the training process, achieving continuous optimization of model performance. The network's total loss is computed as follows:
$L o s s=\sum_{i=1}^I P_i \cdot L_i(i=1,2,3)$ (5)
${{L}_{i}}=-\frac{1}{N}\sum\limits_{x}{{{{\hat{y}}}_{i}}}\log {{y}_{i}}+\left( 1-{{{\hat{y}}}_{i}} \right)\log \left( 1-{{y}_{i}} \right)$ (6)
where, $\sum_{i=1}^I P_i=1$ represents the weights of all loss functions, with a sum of 1. $\hat{y}_i$ represents the true label, yi represents the segmentation result obtained through the proposed method, x represents the sample, and N represents the total number of samples.
4.1 Datasets
Dataset 1: DRIVE dataset is from the diabetes retinopathy screening project in the Netherlands, which collects 40 images with a resolution of 565 × 584 [28]. We use 20 of them as training sets and the other 20 for verification and testing.
Dataset 2: CHASE_DB1 dataset contains 28 images with a resolution of 999 × 960 pixel [29]. We use 20 of them as training sets, and the other 8 for verification and testing.
Dataset 3: STARE contains 20 retinal fundus images. The image resolution is 605 × 700 [30]. We use 18 of them as training sets and the other 2 for verification and testing.
Dataset 4: DCA1 dataset is a set of 134 X-ray coronary artery imaging data collected by a cardiologist [31], consisting of angiography images and their corresponding real label images. Each angiography is a grayscale image format of 300 × 300 pixels in PGM. This article divides the database into two subsets: 100 training sets and 34 testing sets.
4.2 Implementation details
We have successfully implemented the EDCE-Net model based on the PyTorch framework. These experiments were conducted within a high-performance computing environment powered by a single GeForce RTX 2080 Ti GPU, ensuring optimal computational efficiency and resource allocation. We utilized the Adam [32] optimization algorithm, renowned for its efficient adaptive learning rate adjustment mechanism. Specifically, we set a weight decay term of 1e-5, initialized the learning rate at 1e-4, and configured the training to run for 40 epochs.
We preprocess the training images as follows:
1) We first convert the color images to grayscale images, while the original images in the DCA1 dataset are grayscale images, which means this step is omitted.
2) Next, use a sliding window with a step size of 6 to crop the images from four public datasets into a size of 48×48 pixels.
3) Lastly, the cropped images were further processed through horizontal and vertical flipping, as well as rotations of 90, 180, and 270 degrees. These steps were taken to increase data diversity and reduce the risk of overfitting.
After data augmentation, the number of images in the DRI-VE, CHASE-DB1, STARE, and DCA1 datasets increased to 160160, 492800, 186120, and 193600, respectively. These datasets were input into EDCE-Net for training. In the testing phase, the input is a full-size image.
4.3 Evaluation indicators
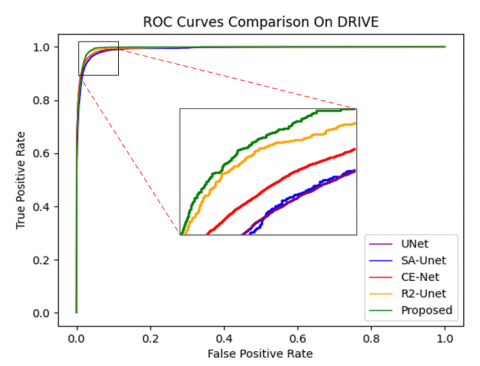
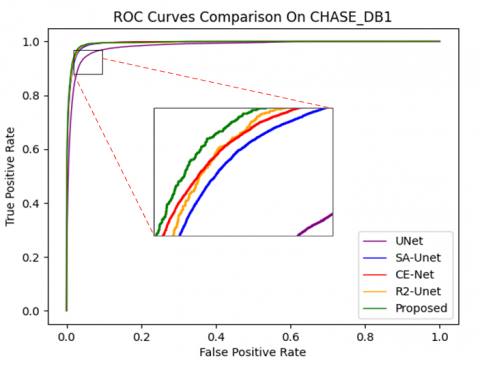
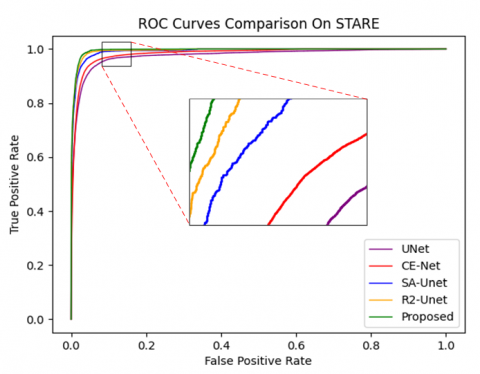
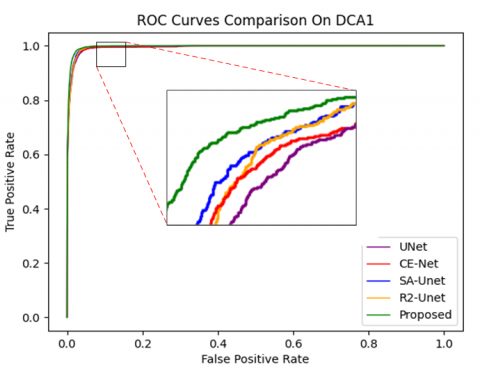
In this paper, to comprehensively and multidimensionally evaluate the performance of the EDCE-Net model, we selected several key evaluation metrics, encompassing Accuracy (Acc), Sensitivity (Sen), Specificity (Spe), Dice coefficient (DICE), Jaccard index (JI), and the area under the receiver operating char acteristic curve (ROC). Acc serves as an intuitive standard to gauge the overall prediction correctness of the model, directly reflecting the overall effectiveness of EDCE-Net on the given task. Sen, also known as True Positive Rate (TPR), focuses on assessing the model's capability to identify positive samples, ensuring that important information is not overlooked. Conversely, Spe concerns the model's ability to recognize negative samples, aiding in controlling the false alarm rate. DICE is a commonly used metric for measuring the similarity between two sets of samples. JI, also known as Intersection over Union (IOU), is used to assess the overlap between the predicted region and the ground truth region. Additionally, the ROC curve is independent of specific classification threshold settings and effectively reflects the EDCE-Net's overall performance across various classification.
The specific calculation process is as follows:
$Acc=\frac{TP+TN}{TP+TN+FP+FN}$ (7)
$\text{ Sen }=\frac{TP}{TP+FN}$ (8)
$Spe=\frac{TN}{TN+FP}$ (9)
$DICE=\frac{2TP}{2TP+FP+FN}$ (10)
$JI=\frac{TP}{TP+FP+FN}$ (11)
where, TP, TN, FP, and FN respectively represent true positive, true negative, false positive, and false negative pixels in the segmentation results.
In addition, we further evaluate the boundary accuracy of the segmentation results using HD95, which calculates the Hausdorff distance between the predicted and true values in millimeters at the 95% percentile [33]. The calculation process is as follows:
${{h}_{95}}(AS,GT){{=}^{95}}K_{a\in AS}^{th}{{\min }_{g\in GT}}\|g-a\|$ (12)
In this formula, $95 K_{a \in A S}^{t h}$ refers to setting the Kth minimum distance set at the 95th percentile. AS is the set of boundary points for model segmentation results, and GT is the set of boundary points for real labels. The definition formula for HD95 is as follows:
$H{{D}_{95}}(AS,GT)=\max \left( {{h}_{95}}(AS,GT),{{h}_{95}}(GT,AS) \right)$ (13)
4.4 Experimental results
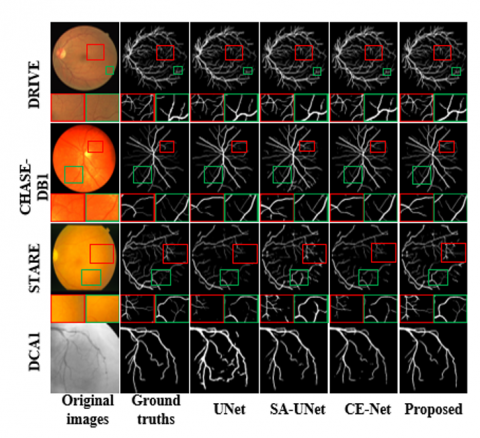
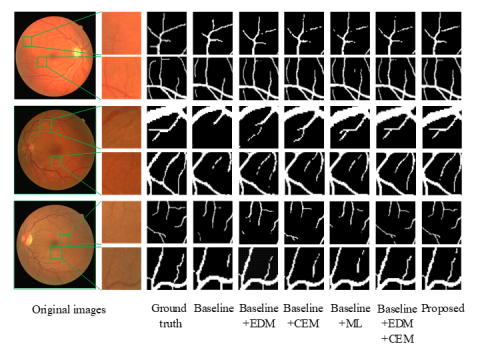
To assess the effectiveness of EDCE-Net, we carried out experiments on three datasets and compared its performance with traditional methods. Our evaluation criteria encompass Acc, Sen, Spe, AUC, DICE, JI and HD95. In Figure 5, we enhanced the visibility of small blood vessels in the image to improve the clarity of the visualization results. It is evident from the visualization that EDCE-Net excels in detecting a greater number of small blood vessels compared to other models. In the second subgraph of CHASE-DB1, it can be found that EDCE-Net performs better in connectivity. From the visualization results of DCA1, it can be clearly seen that EDCE-Net can detect more fine blood vessels and ensure higher connectivity.
Figure 5. Visualization of segmentation results
Table 1. Comparison of different methods on DRIVE
|
Heading1 |
Methods |
Year |
Acc |
Sen |
Spe |
AUC |
DICE |
JI |
HD95 |
|
DRIVE |
UNet [5] |
2015 |
96.60 |
76.82 |
98.53 |
97.07 |
80.41 |
67.64 |
9.12 |
|
R2-Unet [6] |
2018 |
95.56 |
77.92 |
98.13 |
97.84 |
81.12 |
68.27 |
7.95 |
|
|
CE-Net [3] |
2019 |
95.50 |
79.03 |
97.69 |
97.80 |
80.49 |
67.21 |
8.68 |
|
|
SA-Une t[10] |
2020 |
96.41 |
81.1 |
97.67 |
97.38 |
80.27 |
69.65 |
6.87 |
|
|
TP-Net [15] |
2023 |
96.39 |
87.29 |
97.48 |
98.52 |
85.39 |
- |
- |
|
|
Proposed |
— |
97.00 |
82.82 |
98.37 |
98.79 |
82.72 |
70.15 |
4.60 |
Table 2. Comparison of different methods on CHASE_DB1
|
Heading1 |
Methods |
Year |
Acc |
Sen |
Spe |
AUC |
DICE |
JI |
HD95 |
|
CHASE_DB1 |
UNet [5] |
2015 |
96.43 |
77.64 |
98.65 |
93.26 |
77.98 |
65.26 |
10.75 |
|
R2-Unet [6] |
2018 |
96.34 |
77.56 |
98.20 |
98.15 |
80.05 |
67.57 |
8.17 |
|
|
CE-Net [3] |
2019 |
96.33 |
80.08 |
97.23 |
97.97 |
78.04 |
66.19 |
9.38 |
|
|
SA-Unet [10] |
2020 |
97.08 |
81.51 |
98.09 |
97.78 |
77.36 |
67.25 |
7.80 |
|
|
TP-Net [15] |
2023 |
97.30 |
86.00 |
98.41 |
98.74 |
85.18 |
- |
- |
|
|
Proposed |
— |
97.32 |
82.62 |
98.32 |
98.76 |
79.39 |
68.84 |
2.45 |
Table 3. Comparison of different methods on STARE
|
Heading1 |
Methods |
Year |
Acc |
Sen |
Spe |
AUC |
DICE |
JI |
HD95 |
|
STARE |
UNet [5] |
2015 |
96.60 |
77.64 |
98.65 |
93.63 |
78.18 |
68.46 |
11.75 |
|
R2-Unet [6] |
2018 |
97.12 |
82.98 |
98.62 |
97.14 |
77.79 |
68.39 |
9.28 |
|
|
CE-Net [3] |
2019 |
97.32 |
79.09 |
97.21 |
95.97 |
77.58 |
68.12 |
12.45 |
|
|
SA-Unet [10] |
2020 |
95.21 |
71.20 |
98.30 |
96.26 |
77.36 |
69.06 |
10.56 |
|
|
TP-Net [15] |
2023 |
97.24 |
88.52 |
98.20 |
98.04 |
86.75 |
- |
- |
|
|
Proposed |
— |
97.44 |
80.22 |
98.63 |
98.06 |
78.67 |
70.52 |
6.32 |
Table 4. Comparison of different methods on DCA1
|
Heading1 |
Methods |
Year |
Acc |
Sen |
Spe |
AUC |
DICE |
JI |
HD95 |
|
DCA1 |
UNet [5] |
2015 |
96.42 |
78.16 |
97.66 |
97.72 |
77.35 |
63.07 |
9.76 |
|
R2-Unet [6] |
2018 |
96.79 |
79.54 |
98.42 |
98.25 |
77.86 |
63.75 |
9.04 |
|
|
CE-Net [3] |
2019 |
95.46 |
80.07 |
98.67 |
98.03 |
78.08 |
67.08 |
8.81 |
|
|
SA-Unet [10] |
2020 |
97.02 |
81.07 |
98.79 |
98.67 |
78.90 |
65.54 |
7.58 |
|
|
Proposed |
— |
97.82 |
82.19 |
98.81 |
99.08 |
79.36 |
68.37 |
5.10 |
In addition, we conducted quantitative analysis on the final segmentation results, as shown in Tables 1-4. Table 1 shows that the evaluation results of EDCE-Net on the DRIVE dataset for Acc, Sen, Spe, AUC, DICE, JI and HD95 are 97.0, 82.82, 98.37, 98.79, 82.72, 70.15 and 4.60, respectively. Among them, Acc, Spe, AUC, JI, and HD95 are all superior to other models. Table 2 shows that on the CHASE_DB1 datasets, the Acc, Sen, Spe, AUC, DICE, JI and HD95 of EDCE-Net are 97.32, 82.62, 98.32, 98.76, 79.39, 68.84 and 2.45, respectively. It can be seen that the HD95 value obtained by EDCE-Net is the smallest, which means that the predicted value is closest to the true value. Table 3 shows that on the STARE datasets, Acc, Sen, Spe, AUC, DICE, JI and HD95 are 97.44, 80.22, 98.63, 98.06, 78.67, 70.52 and 6.32, respectively, all of which are superior to UNet. Table 4 presents a comparison of the results of various models on the largest dataset, DCA1. As shown in the Table 4, EDCE-Net achieved Acc, Sen, Spe, AUC, DICE, JI, and HD95 values of 97.82, 82.19, 98.81, 99.08, 79.36, 68.37, and 5.10, respectively. All these metrics surpass those of the other models, indicating that EDCE-Net performs exceptionally well on larger datasets. This further demonstrates its significant potential and advantages in vessel segmentation.
4.5 Ablation studies
In the ablation experiment, the classical segmentation framework UNet was used as the baseline to validate the effectiveness of each component of EDCE-Net.
Effectiveness of EDM: Figure 6 clearly shows that our proposed EDM module effectively segments small vessels, which may not be adequately captured by baseline networks without EDM. From Table 5, it can be seen that adding EDM significantly improves the DICE value, indicating that EDM can effectively help the model capture vascular information. In addition, comparison with the baseline, the baseline + EDM model shows an improvement in Sen performance from 76.82% to 83.45%, indicating the strong capability of our proposed EDM in extracting microvascular structures.
Effectiveness of CEM: Secondly, we investigated the effectiveness of the CEM module. Baseline + CEM model improved the Acc performance from 96.60% to 96.94%. As shown in Figure 7, the model with the CEM module extracted blood vessels with higher connectivity compared to the baseline. This shows that CEM can effectively enhance the remote dependency between vascular pixels while obtaining the global topology.
We integrate EDM and CEM into the baseline model to validate their complementary nature. Table 5 indicates a notable enhancement in segmentation accuracy, with Acc and AUC showing increases of 0.38% and 1.71%, respectively. The DICE value increased from 80.41% to 82.70%, indicating a significant improvement in the model's ability to correctly predict samples, demonstrating the effectiveness of the combination of EDM and CEM.
Effectiveness of ML: To maximize the utilization of segmentation outcomes from each decoder layer, we incorporated the ML into our network. As illustrated in Figure 7, our model achieves precise segmentation results through the ML. Notably, in terms of AUC, it surpasses the baseline by 0.81%, validating the robustness of our approach.
Table 5. Comparison of ablation experiments on DRIVE
|
Method |
EDM |
CEM |
ML |
Acc |
Sen |
Spe |
AUC |
DICE |
|
Baseline |
|
|
|
96.60 |
76.82 |
98.53 |
97.07 |
80.41 |
|
Method1 |
√ |
|
|
96.95 |
83.45 |
98.30 |
98.75 |
82.27 |
|
Method2 |
|
√ |
|
96.94 |
83.02 |
98.31 |
98.70 |
81.58 |
|
Method3 |
|
|
√ |
96.67 |
79.28 |
98.35 |
97.88 |
80.55 |
|
Method4 |
√ |
√ |
|
96.98 |
83.46 |
98.22 |
98.78 |
82.70 |
|
EDCE-Net |
√ |
√ |
√ |
97.0 |
82.82 |
98.37 |
98.79 |
82.72 |
4.6 Complexity analysis
This section compares the complexity of several different models on the DRIVE dataset. As shown in Table 6, the number of model parameters (Param (M)), Model size (MB), computational cost required for image processing (FLOPS (M)), and prediction time (Inference(seconds)) for one image are listed. Compared with other models, the parameter count and model size of the proposed model in this paper are relatively small, with only 49.76M parameters and a model size of 73.99MB. The time required to infer an image is only 0.05s longer than UNet, which proves that within an acceptable time range gain, the segmentation performance of EDCE-Net is greatly improved. This balance between enhanced accuracy and efficient computation highlights the practical applicability of EDCE-Net in real-world scenarios where both performance and speed are critical.
Figure 7. Visualization results of ablation experiment
Table 6. Comparison of complexity of different models on the DRIVE dataset
|
Model |
Param (M) |
Model Size (MB) |
Inference (Seconds) |
FLOPS (M) |
|
UNet [5] |
46.50 |
63.46 |
0.62 |
54.01 |
|
R2-Unet [6] |
42.59 |
58.24 |
0.58 |
47.51 |
|
CE-Net [3] |
53.46 |
85.76 |
0.89 |
101.78 |
|
SA-Unet [10] |
82.06 |
132.64 |
1.02 |
149.08 |
|
Proposed |
49.76 |
73.99 |
0.67 |
62.64 |
The EDCE-Net proposed in this paper can effectively capture thin edge blood vessel information while ensuring high connectivity. It comprises three key modules: EDM, CEM, and ML. The designed EDM module is embedded in the network and restores edge information lost due to continuous down-sampling through edge detection operators and multi-directional pyramid pooling incentives. At the bottom layer of the encoder, we proposed the CEM module. This module enhances the interaction of long-distance spatial information among various positions by incorporating multi-scale coordinate attention alongside a residual mechanism. This enhancement equips the network to effectively handle intricate vascular structures. Finally, multi outputweighted loss optimization model is improved therobustness of the model. EDCE-Net retains more detailed information about blood vessels, with accuracies of up to 97.00%, 97.32%, 97.44%, and 97.82% on four publicly available datasets, and outperforms comparative methods in most performance evaluation metrics.
In addition, EDCE-Net still has some limitations. Due to the potential presence of varying degrees of eye diseases or conditions in patients, such as retinitis pigmentosa and hemangioma, which may alter the morphology and density of retinal vessels, EDCE-Net's performance may be less outstanding on certain metrics. In the future, we will explore more retinal vessel segmentation methods, such as incorporating more advanced neural network structures or using reinforcement learning techniques, to further improve segmentation accuracy and stability.
This work was supported by the Special Project for Key R&D and the Promotion of Science Technology Department of Henan Province (Grant No.: 252102210175, 252102210115).
[1] Chen, C., Chuah, J.H., Ali, R., Wang, Y. (2021). Retinal vessel segmentation using deep learning: A review. IEEE Access, 9: 111985-112004. https://doi.org/10.1109/ACCESS.2021.3102176
[2] Sule, O.O. (2022). A survey of deep learning for retinal blood vessel segmentation methods: Taxonomy, trends, challenges and future directions. IEEE Access, 10: 38202-38236. https://doi.org/10.1109/ACCESS.2022.3163247
[3] Gu, Z., Cheng, J., Fu, H., Zhou, K., et al. (2019). Ce-net: Context encoder network for 2d medical image segmentation. IEEE Transactions on Medical Imaging, 38(10): 2281-2292. https://doi.org/10.1109/TMI.2019.2903562
[4] Yan, J., Wang, X., Cai, J., Qin, Q., et al. (2022). Medical image segmentation model based on triple gate MultiLayer perceptron. Scientific Reports, 12(1): 6103. https://doi.org/10.1038/s41598-022-09452-x
[5] Ronneberger, O., Fischer, P., Brox, T. (2015). U-net: Convolutional networks for biomedical image segmentation. In Medical image computing and computer-assisted intervention–MICCAI 2015: 18th international conference, Munich, Germany, pp. 234-241. https://doi.org/10.1007/978-3-319-24574-4_28
[6] Alom, M.Z., Hasan, M., Yakopcic, C., Taha, T.M., Asari, V.K. (2018). Recurrent residual convolutional neural network based on u-net (r2u-net) for medical image segmentation. arXiv preprint arXiv:1802.06955. https://doi.org/10.48550/arXiv.1802.06955
[7] Zhou, Z., Siddiquee, M.M.R., Tajbakhsh, N., Liang, J. (2019). Unet++: Redesigning skip connections to exploit multiscale features in image segmentation. IEEE Transactions on Medical Imaging, 39(6): 1856-1867. https://doi.org/10.1109/TMI.2019.2959609
[8] Huang, H., Lin, L., Tong, R., Hu, H., et al. (2020). UNet 3+: A full-scale connected UNet for medical image segmentation. In ICASSP 2020 - 2020 IEEE International Conference on Acoustics, Speech and Signal Processing (ICASSP), Barcelona, Spain, pp. 1055-1059. https://doi.org/10.1109/ICASSP40776.2020.9053405
[9] Yang, D., Zhao, H., Yu, K., Geng, L. (2023). NAUNet: lightweight retinal vessel segmentation network with nested connections and efficient attention. Multimedia Tools and Applications, 82(16): 25357-25379. https://doi.org/10.1007/s11042-022-14319-4
[10] Guo, C., Szemenyei, M., Yi, Y., Wang, W., Chen, B., Fan, C. (2021). SA- UNet: Spatial attention U-net for retinal vessel segmentation. In 2020 25th International Conference on Pattern Recognition (ICPR): Milan, Italy, pp. 1236-1242. https://doi.org/10.1109/ICPR48806.2021.9413346
[11] Wang, B., Qiu, S., He, H. (2019). Dual encoding U-Net for retinal vessel segmentation. In Medical Image Computing and Computer Assisted Intervention–MICCAI 2019: 22nd International Conference, Shenzhen, China, pp. 84-92. https://doi.org/10.1007/978-3-030-32239-7_10
[12] Dong, F., Wu, D., Guo, C., Zhang, S., Yang, B., Gong, X. (2022). CRAUNet: A cascaded residual attention U-Net for retinal vessel segmentation. Computers in Biology and Medicine, 147: 105651. https://doi.org/10.1016/j.compbiomed.2022.105651
[13] Liu, W., Yang, H., Tian, T., Cao, Z., et al. (2022). Full-resolution network and dual-threshold iteration for retinal vessel and coronary angiograph segmentation. IEEE Journal of Biomedical and Health Informatics, 26(9): 4623-4634. https://doi.org/10.1109/JBHI.2022.3188710
[14] Li, Y., Zhang, Y., Cui, W., Lei, B., Kuang, X., Zhang, T. (2022). Dual encoder-based dynamic-channel graph convolutional network with edge enhancement for retinal vessel segmentation. IEEE Transactions on Medical Imaging, 41(8): 1975-1989. https://doi.org/10.1109/TMI.2022.3151666
[15] Qu, Z., Zhuo, L., Cao, J., Li, X., Yin, H., Wang, Z. (2023). TP-Net: Two-path network for retinal vessel segmentation. IEEE Journal of Biomedical and Health Informatics, 27(4): 1979-1990. https://doi.org/10.1109/JBHI.2023.3237704
[16] Vaswani, A., Shazeer, N., Parmar, N., Uszkoreit, J., et al. (2017). Attention is all you need. arXiv preprint arXiv:1706.03762. https://arxiv.org/abs/1706.03762
[17] Chen, J., Lu, Y., Yu, Q., Luo, X., et al. (2021). Transunet: Transformers make strong encoders for medical image segmentation. arXiv preprint arXiv:2102.04306. https://doi.org/10.48550/arXiv.2102.04306
[18] Cao, H., Wang, Y., Chen, J., Jiang, D., Zhang, X., Tian, Q., Wang, M. (2022). Swin- UNet: UNet-like pure transformer for medical image segmentation. In European Conference on Computer Vision, Tel Aviv, Israel, pp. 205-218. https://doi.org/10.1007/978-3-031-25066-8_9
[19] Hu, X., Wang, L., Li, Y. (2022). HT-Net: A hybrid transformer network for fundus vessel segmentation. Sensors, 22(18): 6782. https://doi.org/10.3390/s22186782
[20] Rahman, M.M., Marculescu, R. (2024). G-cascade: Efficient cascaded graph convolutional decoding for 2d medical image segmentation. In 2024 IEEE/CVF Winter Conference on Applications of Computer Vision (WACV), Waikoloa, HI, USA, pp. 7713-7722. https://doi.org/10.1109/WACV57701.2024.00755
[21] Ding, L., Kuriyan, A.E., Ramchandran, R.S., Wykoff, C.C., Sharma, G. (2020). Weakly-supervised vessel detection in ultra-widefield fundus photography via iterative multi-modal registration and learning. IEEE Transactions on Medical Imaging, 40(10): 2748-2758. https://doi.org/10.1109/TMI.2020.3027665
[22] Tian, F., Li, Y., Wang, J., Chen, W. (2021). Blood vessel segmentation of fundus retinal images based on improved frangi and mathematical morphology. Computational and Mathematical Methods in Medicine, 2021(1): 4761517. https://doi.org/10.1155/2021/4761517
[23] Sun, T., Di, Z., Che, P., Liu, C., Wang, Y. (2019). Leveraging crowdsourced GPS data for road extraction from aerial imagery. In 2019 IEEE/CVF Conference on Computer Vision and Pattern Recognition (CVPR), Long Beach, CA, USA, pp. 7501-7510. https://doi.org/10.1109/CVPR.2019.00769
[24] Chen, L.C., Papandreou, G., Schroff, F., Adam, H. (2017). Rethinking atrous convolution for semantic image segmentation. arXiv preprint arXiv:1706.05587. https://doi.org/10.48550/arXiv.1706.05587
[25] Woo, S., Park, J., Lee, J.Y., Kweon, I.S. (2018). CBAM: Convolutional block attention module. In Computer Vision – ECCV 2018: 15th European Conference, Munich, Germany, pp. 3-19. https://doi.org/10.1007/978-3-030-01234-2_1
[26] Mei, J., Li, R.J., Gao, W., Cheng, M.M. (2021). CoANet: Connectivity attention network for road extraction from satellite imagery. IEEE Transactions on Image Processing, 30: 8540-8552. https://doi.org/10.1109/TIP.2021.3117076
[27] Deng, X., Ye, J. (2022). A retinal blood vessel segmentation based on improved D-MNet and pulse-coupled neural network. Biomedical Signal Processing and Control, 73: 103467. https://doi.org/10.1016/j.bspc.2021.103467
[28] Staal, J., Abràmoff, M.D., Niemeijer, M., Viergever, M.A., Van Ginneken, B. (2004). Ridge-based vessel segmentation in color images of the retina. IEEE Transactions on Medical Imaging, 23(4): 501-509. https://doi.org/10.1109/TMI.2004.825627
[29] Owen, C.G., Rudnicka, A.R., Mullen, R., Barman, S.A., et al. (2009). Measuring retinal vessel tortuosity in 10-year-old children: Validation of the computer-assisted image analysis of the retina (CAIAR) program. Investigative Ophthalmology & Visual Science, 50(5): 2004-2010. https://doi.org/10.1167/iovs.08-3018
[30] Hoover, A.D., Kouznetsova, V., Goldbaum, M. (2000). Locating blood vessels in retinal images by piecewise threshold probing of a matched filter response. IEEE Transactions on Medical imaging, 19(3): 203-210. https://doi.org/10.1109/42.845178
[31] Cervantes-Sanchez, F., Cruz-Aceves, I., Hernandez-Aguirre, A., Hernandez-Gonzalez, M.A., Solorio-Meza, S.E. (2019). Automatic segmentation of coronary arteries in X-ray angiograms using multiscale analysis and artificial neural networks. Applied Sciences, 9(24): 5507. https://doi.org/10.3390/app9245507
[32] Kingma, D.P., Ba, J. (2014). Adam: A method for stochastic optimization. arXiv preprint arXiv:1412.6980. https://doi.org/10.48550/arXiv.1412.6980
[33] Fick, T., Van Doormaal, J.A., Tosic, L., Van Zoest, R.J., Meulstee, J.W., Hoving, E.W., Van Doormaal, T.P. (2021). Fully automatic brain tumor segmentation for 3D evaluation in augmented reality. Neurosurgical Focus, 51(2): E14. https://doi.org/10.3171/2021.5.FOCUS21200
[34] Metz, C.E. (1978). Basic principles of ROC analysis. Seminars in Nuclear Medicine, 8(4): 283-298. https://doi.org/10.1016/S0001-2998(78)80014-2