Jiao He*![]() | Juan Miao
| Juan Miao![]()
© 2025 The authors. This article is published by IIETA and is licensed under the CC BY 4.0 license (http://creativecommons.org/licenses/by/4.0/).
OPEN ACCESS
Marine microplastics pose a significant ecological and health risk due to their widespread sources and distribution. As a result, the rapid and accurate identification and classification of microplastics have become critical for marine environmental protection. Currently, traditional visual and microscope detection methods are inefficient and subjective. Some image-based recognition methods suffer from insufficient feature extraction capabilities, resulting in limited accuracy, while spectral-based techniques fail to effectively address data redundancy and noise, leading to poor classification performance in complex environments. To address these challenges, this study focuses on the development of an automatic recognition and classification technology for marine microplastic pollution using deep learning combined with spectral images. The research includes: proposing a feature extraction method for marine microplastics from multispectral images based on the ReliefF algorithm, which effectively selects features and removes redundant information; and developing a Conv-ReliefF-based recognition method for marine microplastics, integrating the feature learning ability of Convolutional Neural Networks (CNNs) with the feature selection advantages of the ReliefF algorithm. The innovation of this study lies in precisely extracting key features from multispectral images using the ReliefF algorithm to solve the problems of redundancy and noise interference in traditional feature extraction. By combining CNNs with the ReliefF algorithm, the Conv-ReliefF method balances feature learning depth and selective screening, thereby improving the accuracy and efficiency of microplastic recognition in complex marine environments. This approach provides technical support for large-scale marine microplastic monitoring.
marine microplastics, multispectral images, ReliefF algorithm, Conv-ReliefF, automatic recognition and classification
Marine microplastic pollution has become a major environmental challenge that needs to be addressed globally [1-4]. These tiny plastic particles have widespread sources [5, 6], including the degradation of everyday plastic products, industrial emissions, and sewage discharge, among others. They are widely distributed in the ocean, from coastal areas to the open sea, from the ocean surface to the deep sea. Marine microplastics not only pose a serious threat to marine life through ingestion, which can endanger their survival and reproduction, disrupting the balance of marine ecosystems, but they may also enter the human body through the food chain, posing potential risks to human health [7-10]. Due to their small size, large quantity, and complex composition, the rapid and accurate identification and classification of marine microplastics have become key challenges in the field of marine environmental protection and are prerequisites for effective pollution management.
Research on the automatic identification and classification of marine microplastic pollution is of great practical significance and scientific value. From a practical application perspective, accurate identification and classification of marine microplastics can provide strong evidence for tracing pollution sources [11, 12], helping to identify the main sources of pollution and take targeted control measures. Additionally, understanding the distribution of microplastics in different regions and types can allow for in-depth analysis of their diffusion paths [13, 14], providing data support for developing scientifically sound pollution prevention and control strategies. From a scientific research perspective, this research can promote the development of marine environmental monitoring technologies, enrich the research content of marine environmental science, and provide basic data for understanding the environmental behavior and ecological effects of marine microplastics.
Currently, several research methods have been proposed for the identification and classification of marine microplastics, but they have obvious flaws and shortcomings. Traditional detection methods mainly rely on visual inspection and microscope techniques [15, 16], which require researchers to manually sort and identify samples. These methods are not only highly inefficient and fail to meet the demand for large-scale detection of marine microplastics, but the results are also heavily influenced by the experience and subjective judgment of the testers, making accuracy difficult to guarantee. Some image-based recognition methods have improved efficiency to a certain extent [17-20], but they still fall short in feature extraction, making it difficult to accurately capture the subtle features of marine microplastics, leading to low identification accuracy. Some methods that combine spectral technology have poor classification performance in complex marine environments due to their failure to effectively handle redundancy and noise in spectral data.
This paper focuses on the automatic identification and classification technology of marine microplastic pollution using deep learning and spectral images. It specifically includes two core components. First, a feature extraction method based on the ReliefF algorithm for marine microplastic pollution multispectral images is proposed. This method can effectively filter out features that are important for microplastic identification from multispectral images, removing redundant information and improving the discriminative power of features. Second, a marine microplastic pollution recognition method based on Conv-ReliefF is developed. This method combines the powerful feature learning ability of CNNs with the feature selection advantages of the ReliefF algorithm to improve the accuracy and efficiency of marine microplastic recognition. The value of this study lies in the fact that the proposed method can achieve automatic, rapid, and accurate identification and classification of marine microplastics, providing a new technical approach for large-scale monitoring of marine microplastic pollution. This will contribute to the scientific and effective management of marine environments and has important application prospects for advancing the work of marine microplastic pollution control.
2.1 Texture features of multispectral images
In this study, seven texture features were selected for the statistical calculation of marine microplastic pollution multispectral image features: (1) Mean; (2) Standard deviation; (3) Smoothness; (4) Third-order moment; (5) Information entropy; (6) Average gradient; (7) Fractal dimension.
(1) Mean
In the feature extraction of marine microplastic pollution multispectral images, the mean refers to the arithmetic average of the spectral reflectance values of the pixels in the target region containing marine microplastics within a specific band of the multispectral image. Due to the different materials of marine microplastics, they exhibit relatively stable reflection characteristics in multispectral bands, while the spectral reflectance values of background substances such as seawater and plankton fluctuate significantly. By calculating the mean, we can capture the typical spectral response of microplastics in specific bands, providing a basis for distinguishing microplastics from background materials. The mean of the microplastic region usually differs significantly from that of the background region. For example, in the near-infrared band, the mean of microplastics may be higher than that of seawater, which can preliminarily filter potential microplastic areas. Let the gray value of the pixel in the target area be Au, and the total number of pixels be V, then the mean ω of the target region image can be calculated as:
$\omega=\frac{1}{V} \sum_{u=1}^V A_u$ (1)
(2) Standard Deviation
The standard deviation is an indicator of the degree of dispersion of the spectral reflectance values of the microplastic target region pixels in a specific band of the marine microplastic pollution multispectral image, that is, the square root of the average of the squared deviations of the spectral values of each pixel from the mean of that region. The physical structure of marine microplastics is relatively stable, and their spectral reflectance values fluctuate less within the region, so the standard deviation is small. However, in the background, suspended particles, bubbles, and other substances can cause significant fluctuations in spectral reflectance values, resulting in a larger standard deviation. By calculating the standard deviation, we can effectively distinguish the “uniform spectral value microplastic regions” from the “disordered spectral value background regions”, reducing the impact of background interference on feature extraction and improving the accuracy of subsequent recognition. The standard deviation calculation formula is:
$\delta=\sqrt{\frac{1}{V} \sum_{u=1}^V\left(A_u-\omega\right)^2}$ (2)
(3) Smoothness
Smoothness is used to describe the degree of smooth variation of the spectral reflectance values in the microplastic target region in the marine microplastic pollution multispectral image. The surface of marine microplastics is relatively regular, and their spectral reflectance values change smoothly from the center to the edge in the multispectral image. However, in the background, substances such as mud, sand, and seaweed may exhibit sudden jumps in spectral reflectance values due to irregular shapes, resulting in lower smoothness. This feature highlights the “regular texture and smooth spectral variation” characteristics of microplastics, helping to locate potential microplastic regions in complex backgrounds and providing the basis for accurate recognition in subsequent steps. The calculation formula for smoothness T is:
$T=1-\frac{1}{1+\delta^2}$ (3)
(4) Third-order Moment
The third-order moment is an indicator of the skewness of the distribution of spectral reflectance values in the microplastic target region of the marine microplastic pollution multispectral image. If the distribution is symmetric, the third-order moment is close to 0; if the distribution is skewed to the left or right of the mean, the third-order moment will be negative or positive. The spectral reflectance value distribution of marine microplastics is relatively symmetric and is minimally affected by material and shape, so the third-order moment is close to 0. In contrast, background substances such as plankton may have a skewed distribution of spectral reflectance values due to varying individual sizes and uneven distribution, resulting in a deviation of the third-order moment from 0. The third-order moment σ3 can distinguish between “symmetrical spectral distribution microplastics” and “skewed spectral distribution background materials”, further refining feature differences and improving the specificity of feature extraction. The calculation formula for third-order moment σ3 is:
$\delta^3=\left[\frac{1}{V} \sum_{u=1}^V\left(A_u-\omega\right)^3\right]^{\frac{1}{3}}$ (4)
(5) Information Entropy
Information entropy is used to measure the disorder of spectral information in the microplastic target region of the marine microplastic pollution multispectral image. A lower entropy value indicates more ordered information, while a higher entropy value indicates more disordered information. The composition and structure of marine microplastics are relatively simple, and in multispectral images, the distribution pattern of their spectral reflectance values is clear, resulting in lower entropy. However, the background regions containing various impurities exhibit complex and disordered spectral information, leading to higher entropy. By calculating information entropy, we can filter out “ordered spectral information of pure microplastic regions”, excluding impurity interference and providing cleaner feature data for subsequent classification. Let the probability of occurrence of each gray level be represented by O(Au), the calculation formula for information entropy r is:
$r=-\sum_{u=1}^V O\left(A_u\right) \log \left(A_u\right)$ (5)
(6) Average Gradient
The average gradient is an indicator of the clarity of the edges in the microplastic target region of the marine microplastic pollution multispectral image. It is calculated by the average of the rate of change of the spectral reflectance values of adjacent pixels. A higher value indicates a clearer edge. The physical properties of marine microplastics differ significantly from seawater, and in multispectral images, there is a significant change in spectral reflectance values at the boundary between the two, resulting in a larger average gradient. In contrast, in the background, substances with similar properties exhibit smooth changes in spectral reflectance values, resulting in a smaller average gradient. This feature helps precisely locate the boundary contours of microplastics, distinguishing between “microplastics with clear boundaries” and “background materials with fuzzy boundaries,” thus improving the accuracy of microplastic region segmentation. The average gradient H represents the multi-level details of the image. The larger H is, the more levels the image has. Let the number of rows and columns in the sample image be l and v, and the gray value of the image be D(u,k), then the calculation formula is:
$\begin{aligned} & H=\frac{1}{(l-1)(v-1)} \times \sum_{u=1}^{l-1} \sum_{k=1}^{v-1} \sqrt{\frac{(D(u, k)-D(u+1, k))^2+(D(u, k)-D(u, k+1))^2}{2}}\end{aligned}$ (6)
(7) Fractal Dimension
Fractal dimension is used to describe the spatial complexity of the texture in the microplastic target region of the marine microplastic pollution multispectral image. The higher the value, the more complex the texture, while a lower value indicates a more regular texture. The shape of marine microplastics is relatively regular, and the texture structure presented in multispectral images is simple, resulting in a lower fractal dimension. However, in the background, substances such as seaweed and biological debris have irregular shapes and interwoven textures, resulting in a higher fractal dimension. The fractal dimension can quantify the texture differences between microplastics and the background, especially in complex marine environments, and can effectively filter out the regularly textured microplastic features, providing key data for recognition and classification. Let the total number of boxes required to cover the entire image be V(γ), and the side length of the sub-images dividing the original image be γ, the calculation formula for fractal dimension DF is:
$D F=\underset{\gamma \rightarrow 0}{\operatorname{LIM}}[\log V(\gamma) / \log (1 / \gamma)]$ (7)
2.2 Feature selection for marine microplastic pollution multispectral images based on the ReliefF algorithm
In the feature extraction of marine microplastic pollution multispectral images, combining multiple bands of the multispectral image with the seven texture features will result in a high-dimensional feature dataset. Some features may be redundant due to the correlation between bands or their low relevance to the microplastic recognition task. For example, the "information entropy" feature of two adjacent bands may be highly similar, or the "third-order moment" feature of a specific band may have a weak effect in distinguishing microplastics from the background. These redundant features not only increase the input volume for subsequent recognition models, leading to large computational overhead and low efficiency but may also introduce irrelevant information that interferes with the model’s learning of key features, reducing recognition accuracy in complex marine environments. Therefore, this paper uses the ReliefF algorithm for feature selection, with the classification goal of "distinguishing marine microplastics from background materials". The ReliefF algorithm calculates the weight of each feature for the classification task, where a higher weight indicates that the feature contributes more to distinguishing microplastics from seawater, sediment, and other background materials, and thus the key features with higher ranks are retained. Additionally, methods such as Partial Least Squares Regression (PLSR) can be used to evaluate the selection effect and verify the adaptability of the selected feature set to the microplastic recognition task. Through this process, redundant features can be removed to reduce the computational complexity of the subsequent model, making the model lighter, while preserving the core features that are highly relevant to microplastic recognition, providing more accurate input for subsequent recognition models and improving the efficiency and accuracy of marine microplastic automatic recognition.
The core of the marine microplastic pollution multispectral image feature selection based on the ReliefF algorithm is to determine the feature importance by evaluating the ability of each feature to distinguish "microplastics from the background" and "different types of microplastics". The basic principle begins with sample selection and distance calculation: a random sample is selected from the multispectral image feature dataset, which contains the spectral reflectance values, texture features, etc., of the microplastic targets, seawater, plankton, sediment, and other background materials. Then, j nearest neighbor samples are found in the same material microplastics or the same type of background, and the total within-class distance of these samples on each feature is calculated. At the same time, j nearest neighbor samples are found in the heterogeneous samples such as microplastics and background or different material microplastics, and the total between-class distance is calculated. For marine microplastic multispectral images, effective features should minimize the within-class distance for the same microplastics and maximize the between-class distance between microplastics and the background. This is the core judgment criterion for the algorithm's selection process. Specifically, for a randomly selected sample au in the dataset, the distance Σjk=1t(du,au,Gu) of the j nearest neighbor samples in the same class as au is calculated, and the distance Σjk=1F(du,au,Lk(X)) of the j nearest neighbor samples in different classes as au is calculated. Assuming that the weight of the m-th feature d in the u-th sample is represented by Qu(d), the k-th sample in the same class as au is represented by Gk(k=1,2,...,j), and the proportion of samples in category X in the training set is represented by o(X), while the proportion of same-class samples in the total sample is represented by O(CL(au)), wherein the label of au is represented by CL(au). The k-th sample among the j nearest neighbors of different classes from au is denoted by Lk(X)(k=1,2,...,j). The weight is adjusted based on the magnitude of inter-class distance and intra-class distance, and is updated iteratively for l iterations.
$\begin{aligned} & Q^{u+1}\left(d_u\right)=Q^u\left(d_u\right)-\frac{\sum_{k=1}^j T\left(d_u, a_u, G_k\right)}{l j} +\sum_{Z \neq C L} \frac{\frac{o(X)}{1-O\left(C L\left(a_u\right)\right)} \sum_{k=1}^j T\left(d_u, a_u, L_k(X)\right)}{l j}\end{aligned}$ (8)
In the distance calculation step, normalization of the feature attributes of the marine microplastic multispectral images is required. The multispectral image features include spectral features and texture features, and the value ranges of different features vary significantly. Therefore, the normalized distance of a sample on a particular feature is calculated: using the maximum and minimum values of the feature, the sample’s feature value is converted to a uniform range, and then the absolute difference of the transformed values is computed. This processing eliminates the interference of dimensional differences between features in the distance calculation, ensuring that the distance weights of different types of features, such as "near-infrared band reflectance" and "average gradient", are fair and accurately reflect the contribution of features to category differentiation. Specifically, assuming that the normalized distance between samples a1 and a2 on the d-th feature is denoted by Fd(a1, a2), the d-th features of samples a1 and a2 are denoted by a1d and a2d, and the maximum and minimum values of the corresponding feature d in all samples are denoted by MAX(d) and MIN(d), the distance calculation formula is:
$F_d\left(a_1, a_2\right)=\frac{\left|a_{1 d}-a_{2 d}\right|}{\operatorname{MAX}(d)-\operatorname{MIN}(d)}$ (9)
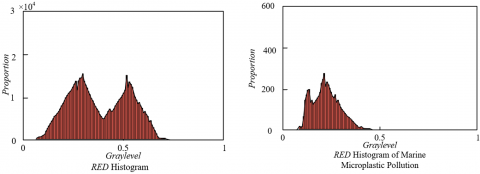
Finally, feature selection is achieved through weight iteration and updating: initially, all features are assigned the same weight. After each round of calculation, the weights are adjusted based on the within-class and between-class distances. If a feature results in a small within-class distance for the same microplastic sample and a large between-class distance for microplastics and background samples, its weight is increased; otherwise, its weight is decreased. This process is iterated multiple times on the multispectral image feature dataset, and the features with higher final weights are the key features for microplastic recognition, such as the specific band standard deviation that distinguishes polyethylene microplastics from seawater, or the fractal dimension that distinguishes fibrous from plate-shaped microplastics. Through this method, the algorithm can select the core features with low redundancy and high discriminability from the multi-dimensional features, providing precise input for subsequent recognition models. Figure 1 shows the target region segmentation effect of marine microplastic pollution in the RED, REG, and GREEN channels.
Figure 1. Target region segmentation effect of marine microplastic pollution in RED, REG, and GREEN channels
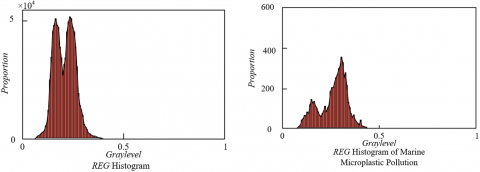
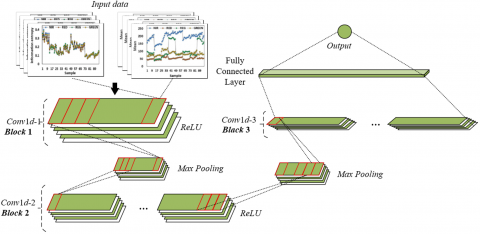
Figure 2 shows the marine microplastic pollution recognition and classification model architecture diagram. This paper adopts a recognition and classification method based on Conv-ReliefF for marine microplastic pollution. Its basic principle is to complement the advantages of CNNs (Conv) and the ReliefF algorithm to solve the core problems in the recognition of marine microplastic multispectral images. CNNs are good at automatically extracting deep spectral features and complex texture features from high-dimensional multispectral images. Even under complex background interference such as seawater and plankton, CNNs can capture the subtle feature patterns of microplastics, making up for the limitations of traditional manual feature extraction methods. The ReliefF algorithm can perform secondary screening on the features extracted by the CNN, removing redundant features unrelated to microplastic category discrimination and retaining the core features most critical for classification such as "microplastics and background" and "different material/morphology microplastics", thereby avoiding high feature dimensionality which leads to model complexity and reduced generalization ability. The combination of the two enables Conv-ReliefF to achieve deep feature mining through the CNN and precise feature selection via ReliefF, ultimately outputting a more discriminative feature set to improve the accuracy and efficiency of marine microplastic recognition, meeting the practical requirements of automatic recognition and classification.
The method takes the multispectral image features selected by the ReliefF algorithm as the core input, realizing the synergy of feature optimization and deep learning. ReliefF selects the most contributive feature subset to microplastic recognition from the original multidimensional multispectral features, such as the mean value of the near-infrared band for distinguishing microplastics from seawater, and the fractal dimension for distinguishing different material microplastics. After normalization, these features form input vectors with adapted dimensions. This input method retains the core discriminative features of microplastics while removing redundant information, reducing the computational load for subsequent convolution operations and avoiding interference from irrelevant features during model training.
The first convolution module undertakes the task of basic feature extraction and is composed of a convolution layer, activation function, and pooling layer. For the input key feature vector, this module uses eight 1×5 convolution kernels with a stride of 1 to perform convolution operations. By using a sliding window to perform weighted summation on five adjacent features in the feature vector, it captures the "spectral-texture" correlation patterns unique to microplastics. For example, high reflectance values in specific bands of polyethylene microplastics are often accompanied by low smoothness texture features. After convolution, the ReLU activation function is used to introduce nonlinear mapping to enhance the response intensity of effective features. Then a max-pooling layer with a window size of 2 compresses the feature dimensions, retains local maxima, filters out minor information, and outputs a 6×8 feature map. Specifically, assume that the feature map output from the k-th convolution in the m-th layer is denoted by bmk, the nonlinear activation function is d, the convolution operation is represented by *, the number of kernels in the (m−1)-th layer is V, the u-th feature map in the (m−1)-th layer is am-1u, the weights are qmuk, and the bias of the k-th convolution kernel in the m-th layer is ymk. The 1D convolution operation is given by:
$b_k^u=d\left(\sum_{u=1}^V q_{u k}^m * a_u^{m-1}+y_k^m\right)$ (10)
Assume that the value of the s-th neuron corresponding to the u-th feature in the m-th layer is wmu(s), the width of the pooling layer is q, and the neuron value in the (m+1)-th layer is om+1u(k). The max-pooling process used in this paper is as follows:
$o_u^{m+1}(k)=\underset{(k-1) q+1 \leq m \leq k q}{\operatorname{MAX}}\left\{w_u^m(s)\right\}$ (11)
The second convolution module focuses on deep feature mining and is composed of convolution layers and pooling layers. This module uses sixteen 1×3 convolution kernels to perform secondary convolution on the feature map output from the first module, mainly to capture the subtle differences in microplastic features, such as the combined differences in fractal dimension and information entropy between fibrous and flake microplastics. The convolution process still uses the ReLU activation function to enhance nonlinear representation, and then a max-pooling layer with a window size of 2 further compresses the features, retaining the core differential features. The final output is a 2×16 feature map, which at this point has been transformed into more abstract class-discriminative signals for microplastics.
The third convolution module and fully connected layer complete feature integration and classification decision-making. The third convolution layer uses thirty-two 1×1 convolution kernels to perform the final convolution on the previous feature map, reorganizing the 16 feature channels into 32 fusion channels, enhancing the correlation between different features. After ReLU activation, a 1×32 feature vector is formed. This vector is input into the fully connected layer, where 32 neurons perform weighted integration of the features. Finally, the output layer uses the Softmax activation function to output the probability value of each category, and the category with the highest probability is the recognition result. Suppose that the weight coefficient at position (l, g) in the connection weight matrix n is bkg, the g-th element of the bias vector in the k-th fully connected layer is vkg, and the l-th element received by the k-th fully connected layer is xk+1l. The mathematical calculation formula of the fully connected layer is as follows:
$b_g^k=\delta\left(\sum_{l=1}^L x_l^{k-1} n_{l, g}^k+v_g^k\right)$ (12)
The entire method achieves accurate recognition of marine microplastics through the cooperative process of "ReliefF feature selection - convolution feature extraction - fully connected classification". ReliefF preprocessing ensures the specificity of the input features and avoids interference from irrelevant information. The convolution modules, through multi-layer convolution and pooling, gradually transform shallow features into deep class features, adapting to the characteristics of marine microplastics which are "complex in features but exhibit stable discriminative patterns". The combination of the two not only improves the model's anti-interference capability in complex marine environments but also reduces computational complexity through feature dimension reduction, ultimately achieving efficient recognition and classification of marine microplastics in different types and environments.
Figure 2. Marine microplastic pollution recognition and classification model architecture diagram
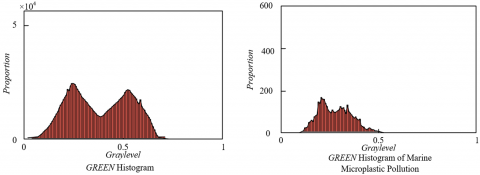
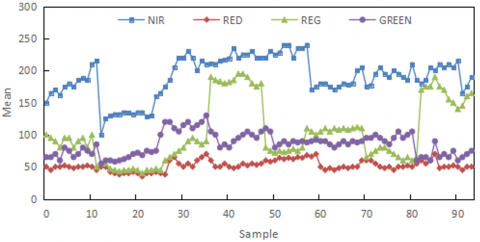
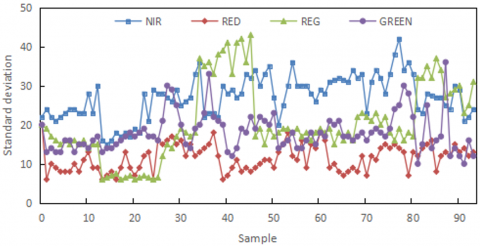
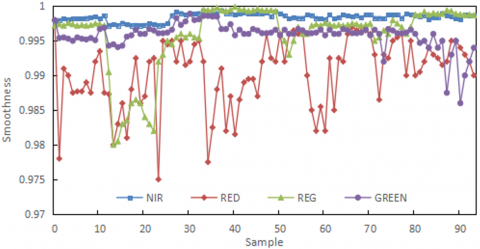
From the analysis of multispectral image texture feature values in Figures 3(a)-(c), it can be seen that different bands show significant differences in mean, standard deviation, and smoothness. In the mean feature, the mean values of the NIR and REG bands are generally higher than those of the RED and GREEN bands, indicating that the near-infrared and related bands are more sensitive to the spectral reflectance characteristics of microplastics. Their high mean value characteristics can effectively distinguish microplastics from the seawater background. The standard deviation feature shows that the standard deviations of the NIR and REG bands fluctuate greatly, reflecting that these bands can capture the diversity among microplastic samples. In contrast, the low standard deviations of the RED and GREEN bands indicate more stable reflectance characteristics, contributing less to classification. In the smoothness feature, the smoothness of the NIR and REG bands is closer to 1, reflecting the smoothness of their texture, which is highly related to the physical state of the microplastic surface. Meanwhile, the smoothness of the RED band fluctuates significantly, possibly corresponding to rough-textured microplastics, where the low smoothness feature can assist in distinguishing the surface morphology of microplastics.
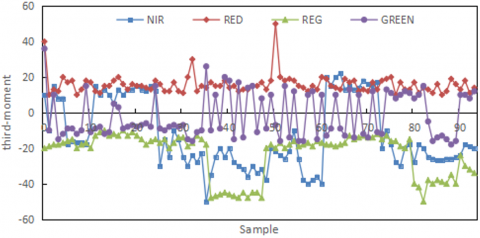
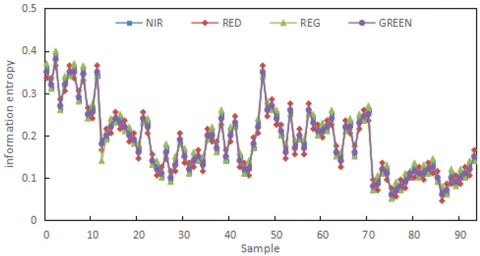
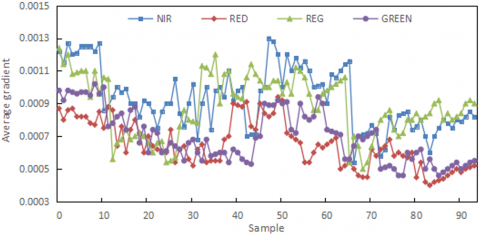
From the analysis of multispectral image texture feature values in Figures 3(d)-(e), it can be seen that different bands show significant differences in these features. In the third-order moment, the RED band fluctuates sharply, reflecting its high sensitivity to the skewness of microplastic morphology and its usefulness in distinguishing shape categories. The third-order moments of the NIR, REG, and GREEN bands are relatively stable, with weaker capability to capture morphological skewness. In terms of information entropy, the overall values in the NIR and REG bands are higher than those in the RED and GREEN bands, indicating that they can encode the texture complexity of microplastics more fully, playing a key role in material classification. The RED band has lower information entropy, corresponding to microplastics with simpler texture, which can assist in material identification. In average gradient, the values in the NIR and REG bands are generally higher, showing strong ability to capture the edge details of microplastics, which is conducive to recognizing surface features. The RED and GREEN bands have lower average gradients, showing insufficient resolution for fine textures.
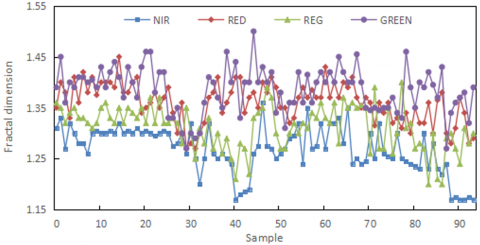
From the analysis of the fractal dimension feature in Figure 3(f), it can be seen that different bands show significant differences in describing microplastic textures. The fractal dimension of the NIR band fluctuates within a large range, reflecting its high sensitivity to complex surface textures of microplastics and serving as a core discriminative feature for material and surface state. The RED band has a generally low fractal dimension, suitable for identifying smooth-surfaced microplastics and distinguishing them from the background through low fractal dimension values. The fractal dimension of the REG band lies between NIR and RED, and combined with the characteristics of the red-edge band, it can assist in identifying microplastics with biofilm. The fractal dimension of the GREEN band is the lowest and has the smallest fluctuation (0.0005–0.0007), with weak texture resolution, and is prone to being removed during ReliefF algorithm filtering to reduce redundancy.
Experimental data show that the mean, standard deviation, and smoothness of the near-infrared and red-edge bands have core discriminative value in microplastic identification: high mean and high standard deviation enhance the spectral distinguishability between microplastics and the background, while smoothness characterizes the surface texture features of microplastics. The high response of the NIR and REG bands in terms of information entropy and average gradient is highly consistent with the high near-infrared reflectivity and the transitional characteristics of the red-edge band of microplastics, which can effectively distinguish different materials and surface states. The third-order moment of the RED band shows significant discrimination ability for shape categories such as fibers and fragments. The fractal dimension features of the NIR and RED bands play a key role in microplastic classification: the high fluctuation of NIR captures the differences in material and surface complexity, while the low fractal dimension of RED distinguishes smooth shape categories.
(a) Mean
(b) Standard deviation
(c) Smoothness
(d) Third-order moment
(e) Information entropy
(f) Average gradient
(g) Fractal dimension
Figure 3. Multispectral image texture feature values of marine microplastic pollution
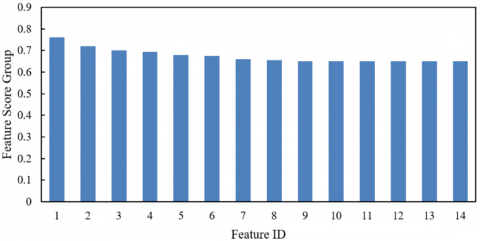
From the distribution of ReliefF feature scores in Figure 4, the scores of the 14 features are all above 0.6, with the top few features approaching 0.8, indicating that the ReliefF algorithm successfully selected multispectral features with high discriminative power for marine microplastic identification. These high-score features reflect the significant differences between microplastics and the background and other interferences in spectral reflectance and texture complexity. The high-score features of the near-infrared band correspond to the high reflectivity of microplastics in the near-infrared region and serve as the core basis for material classification. The standard deviation feature of the red-edge band captures the texture variation of microplastics, assisting in shape category differentiation. The fractal dimension feature describes the surface roughness of microplastics, strengthening surface feature recognition. Although the subsequent features have slightly lower scores, they still maintain effective discriminative power, showing that ReliefF retains secondary but critical information while avoiding interference from redundant features. The experimental data verify the effectiveness of the ReliefF algorithm: through feature selection, the signal-to-noise ratio of the feature set is greatly improved, reducing computational complexity and enhancing the relevance of model inputs. High feature scores mean that these features can be more efficiently learned by the CNN during training. For example, the high score of near-infrared features enables the model to quickly capture the spectral uniqueness of microplastics, and the high score of fractal dimension features helps the model distinguish surface states, ultimately improving the recognition accuracy and efficiency of the Conv-ReliefF model for marine microplastics.
Figure 4. ReliefF feature scores of multispectral images of marine microplastic pollution
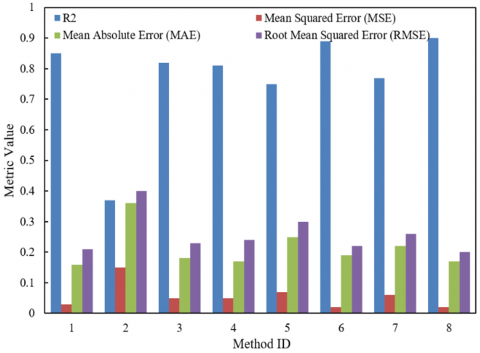
From the evaluation results of the PLSR regression models in Figure 5, the performance differences of different feature selection methods are intuitively presented. Taking the R² metric as an example, the feature selection method based on the ReliefF algorithm performs outstandingly in terms of model interpretability, indicating that the selected multispectral features can highly fit the spectral-texture relationship of microplastic pollution and effectively capture the differences between microplastics, the background, and interfering objects. The mean squared error, mean absolute error, and root mean squared error are significantly lower in the ReliefF-related methods than in other comparative methods, indicating that the features selected by ReliefF greatly reduce model prediction error and improve regression accuracy. These data validate the effectiveness of the ReliefF algorithm: by removing redundant spectral features and retaining key features that are highly sensitive to microplastic pollution, the PLSR model can more accurately describe the spectral-texture patterns of microplastics.
Figure 5. Evaluation results of PLSR regression models using different feature selection methods
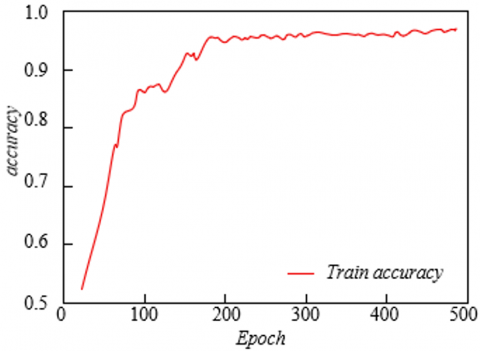
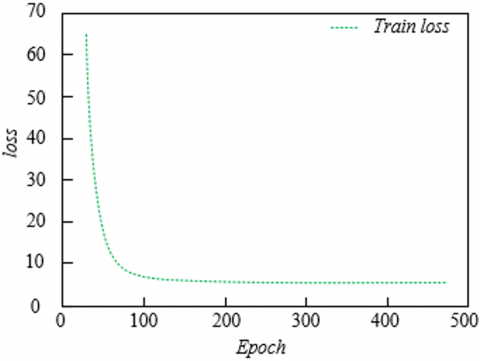
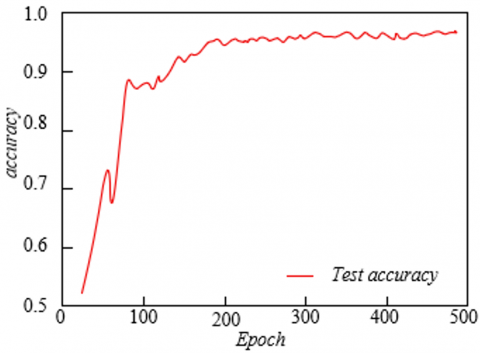
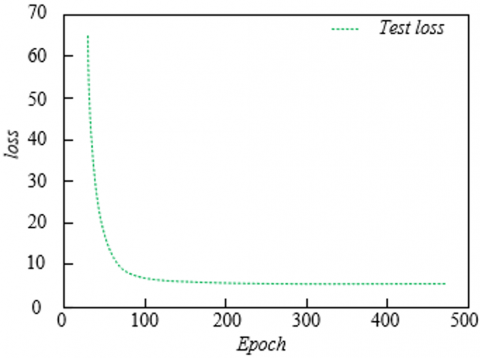
From the performance curves of training and testing in Figure 6, it is evident that the Conv-ReliefF-based model performs excellently over 500 iterations. The training set accuracy rises rapidly and stabilizes above 0.95 after 100 epochs, and the loss rate drops sharply from 70 to nearly 0, indicating that the model efficiently learns the multispectral features selected by ReliefF and can deeply capture the spectral-texture patterns of microplastics. The testing set accuracy also stabilizes around 0.95, and the loss rate decreases to a very low level, closely matching the training set performance, proving that the model does not overfit and has strong generalization ability. These data verify the effectiveness of the Conv-ReliefF method: the high-value features pre-selected by ReliefF provide accurate inputs for the convolutional network, avoiding interference from redundant information and allowing the model to focus on the core discriminative dimensions of microplastics during learning. The convolutional layers extract features in a multi-level manner and, combined with the classification decisions of fully connected layers, achieve efficient recognition of microplastics in complex marine environments.
(a) Training set accuracy
(b) Training set loss rate
(c) Testing set accuracy
(d) Testing set loss rate
Figure 6. Accuracy and loss rate of marine microplastic pollution automatic recognition and classification in 500 training and testing iterations
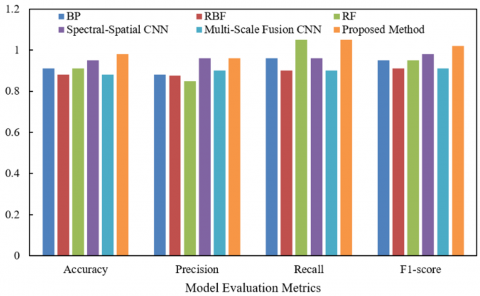
From the performance comparison results of the models in Figure 7, the Conv-ReliefF-based method proposed in this paper significantly outperforms traditional methods and other deep learning models in key evaluation metrics such as accuracy, precision, recall, and F1-score. Specifically, the accuracy of the proposed method is close to 1.0, and the precision, recall, and F1-score all exceed 0.95, while the metrics of the comparison models mostly fall in the 0.8–0.9 range, showing a clear gap. This result verifies the effectiveness of the Conv-ReliefF method, whose advantage stems from the deep synergy between the ReliefF algorithm and the CNN: first, ReliefF selects highly discriminative features from multispectral images, removes redundant information, and provides precise input for the convolutional network, avoiding interference from irrelevant features in model learning. Second, the convolutional network extracts features in multiple levels and deeply learns the spectral-texture correlations of microplastics in complex marine environments, achieving efficient classification of microplastic materials, shapes, and surface features. Compared with traditional methods, Conv-ReliefF avoids the limitations of manual features and uses deep learning to automatically mine feature representations; compared with other deep learning models, it optimizes the input through ReliefF, reduces training noise, and improves learning efficiency and generalization capability.
Figure 7. Performance results of the model in marine microplastic pollution automatic recognition and classification
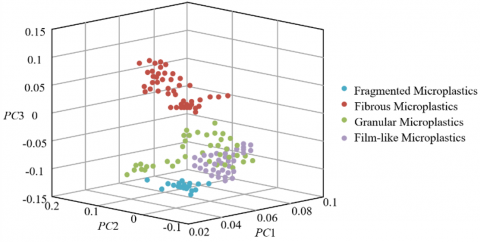
From the 3D visualization results in Figure 8, it can be seen that fragment-like, fiber-like, particle-like, and film-like microplastics form distinct clustering groups in the principal component space composed of PC1, PC2, and PC3, with clear boundaries between categories and no obvious overlap. This indicates that the method based on Conv-ReliefF, through the multispectral features selected by ReliefF, successfully captures the core discriminative information of different microplastic types in the low-dimensional space: the distribution of fiber-like microplastics on PC1 and PC2 is significantly separated from other types, reflecting that their unique texture features are effectively learned by the model; the clustering of film-like microplastics on PC3 reflects that the spectral reflectance characteristics of their smooth surfaces are accurately extracted. This clear clustering effect echoes the high accuracy, precision, recall, and F1-score of the model in Figure 7, verifying the effectiveness of the method.
Figure 8. 3D visualization of spectral classification of marine microplastic pollution
This paper constructed a "feature selection–deep learning integration" technical system for the automatic recognition and classification of marine microplastic pollution. First, based on the ReliefF algorithm, key features were extracted from multispectral images, redundant information was removed, and a feature set with high discriminative power was formed. Second, a Conv-ReliefF model was constructed, which learnt the spectral-texture correlation of microplastics through a multi-level convolutional network to achieve precise classification. Experimental results show that the method significantly outperformed traditional methods and similar deep learning models in metrics such as accuracy and F1-score. Moreover, 3D visualization demonstrated clear clustering of different microplastic types in the feature space, verifying the effectiveness of the technique. Through feature optimization and model design, the complexity of microplastic classification in marine environments was successfully addressed, providing an efficient automated tool for ecological monitoring.
The technical innovation of this paper lies in combining the feature selection advantages of ReliefF with the deep learning capability of convolutional networks, overcoming the limitations of traditional manual features and achieving high-precision classification of microplastic materials, shapes, and surface features. This provides key technical support for real-time monitoring and source tracing analysis of marine microplastic pollution, promoting the intelligent upgrade of marine ecological protection and pollution control. The model's robustness under extreme environments has not yet been fully verified, and the feature selection process depends on parameter tuning of ReliefF, which requires further optimization in practical applications. Future directions include: ① expanding multimodal data to enhance feature dimensions and improve classification accuracy in complex scenarios; ② exploring model lightweighting and edge deployment to meet the real-time computing needs of mobile monitoring devices such as drones and buoys; ③ introducing self-supervised learning and few-shot learning to reduce the cost of data annotation and enhance the generalization ability of the technology in data-scarce scenarios. Through continuous iteration, the technology will advance from laboratory validation to real-world marine monitoring applications, contributing more practical solutions to global marine ecological protection.
[1] Ribó, M., Watson, S.J., Novikova, N.I., Deppeler, S., Seabrook, S., Hale, R., Strachan, L.J. (2023). Microplastic pollution distribution: Differences between marine reserves and urbanised areas. Continental Shelf Research, 267: 105115. https://doi.org/10.1016/j.csr.2023.105115
[2] Li, Y. (2022). Scientific uncertainty of marine microplastic pollution and the dilemma of future international unified legislation. International Journal of Environmental Research and Public Health, 19(24): 16394. https://doi.org/10.3390/ijerph192416394
[3] Astorga García, D. (2021). Microplastic pollution in seawater and marine organisms across the Tropical Eastern Pacific and Galápagos. Repositorio Nacional.
[4] Fagiano, V., Compa, M., Alomar, C., Deudero, S. (2024). Global meta-analysis and review of microplastic in marine copepods. Environmental Pollution, 351: 124092. https://doi.org/10.1016/j.envpol.2024.124092
[5] Portz, L., Manzolli, R.P., Herrera, G.V., Garcia, L.L., Villate, D.A., do Sul, J.A.I. (2020). Marine litter arrived: Distribution and potential sources on an unpopulated atoll in the Seaflower Biosphere Reserve, Caribbean Sea. Marine Pollution Bulletin, 157: 111323. https://doi.org/10.1016/j.marpolbul.2020.111323
[6] van Duinen, B., Kaandorp, M.L., Van Sebille, E. (2022). Identifying marine sources of beached plastics through a Bayesian framework: Application to southwest Netherlands. Geophysical Research Letters, 49(4): e2021GL097214. https://doi.org/10.1029/2021GL097214
[7] Compa, M., Alomar, C., Wilcox, C., van Sebille, E., Lebreton, L., Hardesty, B.D., Deudero, S. (2019). Risk assessment of plastic pollution on marine diversity in the Mediterranean Sea. Science of the Total Environment, 678: 188-196. https://doi.org/10.1016/j.scitotenv.2019.04.355
[8] Garrard, S.L., Clark, J.R., Martin, N., Nelms, S.E., et al. (2024). Identifying potential high-risk zones for land-derived plastic litter to marine megafauna and key habitats within the North Atlantic. Science of the Total Environment, 922: 171282. https://doi.org/10.1016/j.scitotenv.2024.171282
[9] Bonanno, G., Orlando-Bonaca, M. (2020). Marine plastics: What risks and policies exist for seagrass ecosystems in the Plasticene? Marine Pollution Bulletin, 158: 111425. https://doi.org/10.1016/j.marpolbul.2020.111425
[10] Xiao, J., Yang, X., Zhang, Z., Wang, M., Yang, Z., Zhang, X. (2024). Research progress of the sources, distribution characteristics, and potential risks of microplastics in the global marine environment. Water, Air, & Soil Pollution, 235(11): 717. https://doi.org/10.1007/s11270-024-07518-2
[11] Meng, X., Chen, S., Sun, L., Liu, B., et al. (2025). Identification of marine microplastics by a combined method of principal component analysis and random forest for fluorescence spectrum processing. Marine Pollution Bulletin, 214, 117740. https://doi.org/10.1016/j.marpolbul.2025.117740
[12] Dellisanti, W., Leung, M.M.L., Lam, K.W.K., Wang, Y., Hu, M., Lo, H.S., Fang, J.K.H. (2023). A short review on the recent method development for extraction and identification of microplastics in mussels and fish, two major groups of seafood. Marine Pollution Bulletin, 186: 114221. https://doi.org/10.1016/j.marpolbul.2022.114221
[13] Kukulka, T., Law, K.L., Proskurowski, G. (2016). Evidence for the influence of surface heat fluxes on turbulent mixing of microplastic marine debris. Journal of Physical Oceanography, 46(3): 809-815. https://doi.org/10.1175/JPO-D-15-0242.1
[14] Simantiris, N., Avlonitis, M., Theocharis, A. (2022). Simulation of the transport of marine microplastic particles in the Ionian Archipelago (NE Ionian Sea) using a Lagrangian model and the control mechanisms affecting their transport. Journal of Hazardous Materials, 437: 129349. https://doi.org/10.1016/j.jhazmat.2022.129349
[15] Cocciaro, B., Merlino, S., Bianucci, M., Casani, C., Palleschi, V. (2023). Feasibility study for the development of a low-cost, compact, and fast sensor for the detection and classification of microplastics in the marine environment. Sensors, 23(8): 4097. https://doi.org/10.3390/s23084097
[16] Kaviya, K., Bhavani, R., Shanker, N.R., Bejaxhin, A., Herbert, B. (2025). Advanced classification of marine pollutants using sentinel-2 multispectral thermal imaging and vision transformer for enhanced water quality assessment. Global NEST Journal, 27(4): 1-15.
[17] Faisal, M., Chaudhury, S., Sankaran, K.S., Raghavendra, S., Chitra, R.J., Eswaran, M., Boddu, R. (2022). Faster R-CNN algorithm for detection of plastic garbage in the ocean: a case for turtle preservation. Mathematical Problems in Engineering, 2022(1): 3639222. https://doi.org/10.1155/2022/3639222
[18] Fang, C., Awoyemi, O.S., Naidu, R. (2024). Is paper bag plastic-free, without plastic in colourful logo area? Journal of Hazardous Materials, 471: 134403. https://doi.org/10.1016/j.jhazmat.2024.134403
[19] Septianto, F., Lee, M.S. (2020). Emotional responses to plastic waste: Matching image and message framing in encouraging consumers to reduce plastic consumption. Australasian Marketing Journal, 28(1): 18-29. https://doi.org/10.1016/j.ausmj.2019.09.002
[20] Yang, Z., Zhang, H., Lu, F., Yang, Y., Hu, T., He, P. (2024). A novel high-throughput detection method for plastic debris in organic-rich matrices based on image fusion. Analytical Chemistry, 96(15): 6045-6054. https://doi.org/10.1021/acs.analchem.4c00584