Aouatef Haouari*![]() | Rachid Boudour
| Rachid Boudour![]() | Yazid Benazzouz
| Yazid Benazzouz![]()
© 2025 The authors. This article is published by IIETA and is licensed under the CC BY 4.0 license (http://creativecommons.org/licenses/by/4.0/).
OPEN ACCESS
Access to daily activity has a potential impact on differently-abled individuals. BCI-based EEG devices have emerged as a potential aid to improve daily assistance, using only brain signals as a communication path. The EEG signals of mental imagination of any action, specifically visual imagery, are challenged in classification due to the diversity and variety of neural activity patterns. This study specifically concentrates on the EEG signal classification of imagery mental tasks, employing the imagination of turning light on and off. Electroencephalogram signals were recorded using a NeuroSky headset. Our methodology involved comparing raw data, extracted features, and power spectra images. These data were then fed into recurrent neural networks (RNNs) and deep neural networks (DNNs) for task recognition. Results indicate that image power spectra images, which identify EEG signal frequencies, are the most significant, and the classification outperformed raw data and extracted features. Notably, greyscale power spectra images achieved the highest accuracy, reaching 97.4% through a deep-learning network. The superior performance of image classification suggests its efficacy in discerning imagery tasks. In conclusion, greyscale power spectra images emerge as the most suitable data type for classifying imagery tasks, showing a clear pattern of imagery tasks.
brain-computer interface (BCI), deep neural networks (DNNs), electroencephalogram (EEG), imagery task, recurrent neural networks (RNNs)
Brain-computer interfaces (BCIs) constitute an emerging field of research [1]. A BCI allows users to interact with a computer only through intention [2] without using the natural pathways of nerves and muscles. The user's intention is detected through brain signals, usually measured by electroencephalography (EEG). BCIs could help patients with disabilities by providing a new means of communication that can respond to brain commands and be considered aware.
A variety of applications of EEG signals have been studied, such as motor imagery [3], mental workloads [4], emotion recognition [5], Alzheimer's classification [6], visual imaginary tasks [7, 8], and brain intentions [9]. The foundational work using brain intentions has relied on motor imagery [10, 11], mental workloads, and goal-directed thinking. However, the decoding of imagination task commands has not been widely explored. In this work, we explore this type of EEG application called imagination tasks.
Imagination tasks are actions of the imagination carried out mentally, and they may be referred to as mental imagination or mental intentions [12]. This topic has been explored mainly in motor imagery studies [13-15] to distinguish different body movements. It has also been studied to define the reproducibility of the EEG spectrum, as in reference [16]. Furthermore, to detect some pathophysiology disorders [17].
Decoding the EEG signals of the user while imagining daily tasks and differentiating it from imaging the use of his body is essential, to settle a high-performance tool that can communicate with the user efficiently, also we can implement a variety of daily applications such as opening and closing the door, to improve the level of autonomy of those who need such type of application, and control their environment.
In this study, we applied a type of mental imagery called visual imagery, an EEG-based, BCI-endogenous paradigm. Visual imagery (VI) relies only on visual perception without using any aid devices. The user has to imagine an action that activates different frequency bands, such as delta, theta, and alpha bands [18].
EEG signal classification generally passes through four principal stages: signal acquisition, preprocessing, feature extraction, and feature classification. In this paper, we implement different neural and deep learning networks to classify EEG signals and thereby identify the action imagined by the user - in our case, turning a light on and off. Specifically, we used LSTM and BiLSTM networks, deep neural network LSTM (DNN-LSTM), and simple deep learning architecture to classify EEG signals. Our simple DNN model achieved the best results, with 97.4% accuracy, with greyscale power spectra images as features.
The rest of the paper is organized as follows: Section 2 briefly describes the experiment with recorded data, and the used material, and provides also the details of different feature extraction with a description of the network models classifiers for the imaginary tasks: turning a light on and off. The classification results of recorded data and discussion of the classification percentage of our experiments are described in Section 3, and Section 4 is dedicated to discussing the conclusion about the best features of classification imagery EEG signal.
2.1 Flow of the experiment
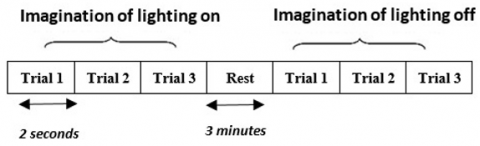
Twenty-four university students participated in this experiment as subjects for EEG data acquisition. Every student imagined the first action, turning on the light in the room, and the second action, turning it off. The imagination of one task lasted for one minute, with a rest of three minutes between the two tasks. To help students focus on one task, the requested action was written on paper and shown to the subject. The action of holding their attention on the written tasks was meant to avoid eye artefacts that could be recorded.
The experiment consisted of 25 trials, each containing five or six trials. Each trial was divided into A (turning the light on) and B (turning it off). The duration of every trial was two seconds. A temporal chart of our experiment is shown in Figure 1.
2.2 Data
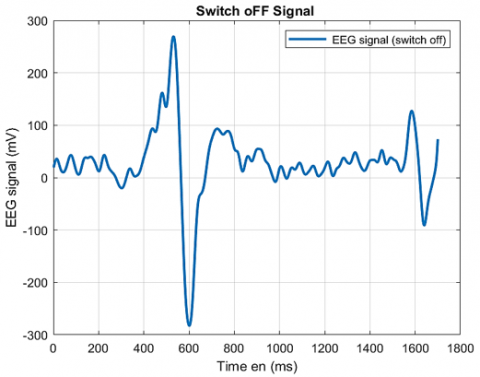
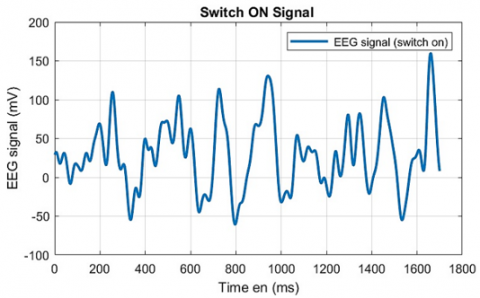
After rejecting poorly recorded signals, 216 trials were divided into Task A (122) and Task B (94). Data on each subject’s trials in tasks A and B were collected from 24 subjects. Figure 2 shows a temporal representation of the EEG signals recorded for the two imagination tasks. As our dataset was small, we used data augmentation by making new samples for training and regularizing the dropout values.
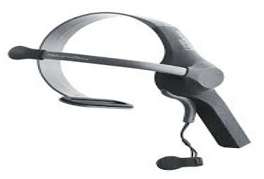
2.3 NeuroSky MindWave
The EEG signals were recorded using the NeuroSky MindWave headset, as shown in Figure 3. This headset has a 512-Hz sampling rate. The NeuroSky MindWave’s [19] data are received every second. The raw EEG data are provided as eight signals: delta from 0.5 to 2.75Hz, theta from 3.5 to 6.75, low-alpha from 7.5 to 9.25Hz, high-alpha from10 to 11.75Hz, low-beta from 13 to 16.75Hz, high-beta from 18 to 29.75Hz, low-gamma from 31 to 39.75Hz, and mid-gamma from 41 to 49.75Hz. The connection between the application and the headset is paired through Bluetooth.
2.4 Features extraction
Instantaneous frequency (IF) and spectral entropy (SE) features [20, 21] were extracted from the 216 EEG signals recorded. The samples were divided into training and testing data for the introduction to the classification models.
2.4.1 IF
IF is a parameter of time variation that defines the frequency of spectral peaks varying with time [22]. The IF for a real signal x(t) is given by the Eq. (1):
$I F(t)=\frac{d \theta(t)}{d t}$ (1)
where, $\theta(t)$–represents the phase of z(t), and z(t)–is the analytic function of x(t) and can be written as in Equation Eq. (2):
$z(t)=x(t)+i H(t)=a(t) e^{i \theta(t)}$ (2)
where, a(t)–is a real function, which represents the amplitude of z(t), $\theta(t)$–is a real function, which represents the phase of z(t), and H(t) –is the Hilbert transform of signal z(t), which is given by Eq. (3):
$H(x)(t)=\frac{1}{\pi} \int_{-\infty}^{\infty} \frac{x(k)}{t-k} d k$ (3)
2.4.2 SE
SE quantifies the number of peaks (spectral complexity) of the EEG signal. This measure is given by Eq. (4):
$E=-\sum_f p_f \log p_f$ (4)
where, $p_f$ is the power spectral density in each frequency.
2.4.3 Power spectral density
Power spectral density is widely used to analyze EEG signals [23-25], which is a measure of the power across the frequency domain. The power is a quantity related to energy. A plot of the signal power is the energy per unit time, while the power spectral density is the signal’s power falling within given frequency bins. This measure is defined by Eq. (5):
$P=\frac{1}{N}|X(m)|^2$ (5)
where, X(m) is Fourier transform of the time-domain signal x(n) with n samples, the Fourier transformation of discrete signal x(n), is given by Eq. (6):
$0 \leq m \leq N-1$ (6)
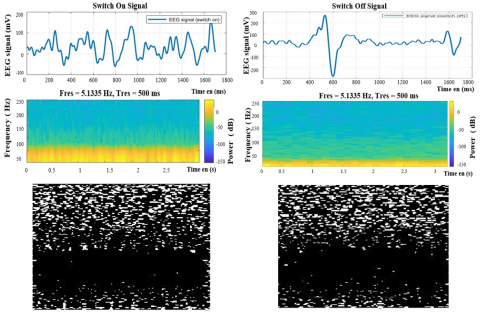
The power spectral density images were generated for all EEG signals, as presented in Figure 4.
Figure 4 presents the original plot of the EEG signal in the first row, the color power spectra image of the signal in the second row, and the last row presents the same images in grayscale. We have resized each of the original power spectra images for the experiment down to 227×227 pixels.
2.5 Neural networks
2.5.1 LSTM
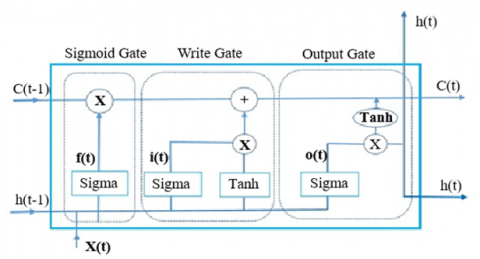
Long short-term memory networks (LSTMs) are recurrent neural networks (RNNs) with a special feature: their ability to learn long-term dependencies. The algorithm has a memory element to remember previous sequences of steps, which overcomes the exploding gradients problem of traditional RNNs [26]. Figures 5 and 6 show the elementary structure of the LSTM unit and BILSTM structure respectively.
The basic cell of LSTM architecture, shown in Figure 5, consists of three gates.
Gate 1 (the sigmoid gate) selects the information to be retained, as described by Eq. (7):
$f(t)=\sigma\left(w_f[h(t-1), x(t)]+b_f\right)$ (7)
where, f(t) is the output of the forget gate, σ is the sigmoid function, wf is the weight function, h(t-1) is the input of the previous cell, x(t) is the input to the cell, and bf is the bias.
Gate 2 (the write gate) stores the information in the memory. Its behaviour is described by Eq. (8):
$\begin{gathered}c(t)=f_t * c(t-1)+i(t) * c_1(t) \\ i(t)=\sigma\left(w_f[h(t-1), x(t)]+b_f\right) \\ c_1(t)=\tanh \left(w_c[h(t-1), x(t)]+b_c\right)\end{gathered}$ (8)
where, i(t) is the output from gate 1, and c(t) is the new state, while c1 (t-1) represents the old cell state.
Gate 3 (the output gate) is described by Eq. (9):
$\begin{gathered}h(t)=o(t) * \tanh (c(t)) \\ o(t)=\sigma\left(w_0[h(t-1), x(t)]+b_0\right)\end{gathered}$ (9)
where, o(t) is the output of the sigmoid layer, and h(t) is the output of the LSTM cell.
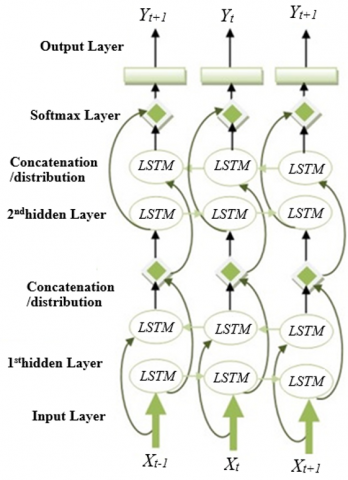
2.5.2 BI-LSTM network
Bidirectional LSTM is a type of recurrent neural network widely used in language, video, voice, and other applications as a classification tool. In the EEG field is used for the features classification of motor imagery signals, as in study by Hochreiter and Schmidhuber [27]. This type of RNN network has internal memory and predicts efficient time series. It also has bidirectional propriety, which means that the information flows in two directions. In the first direction, the model learns the sequence from the input information, but in the second direction, the model learns the reverse of that information. Then, both models are combined using one of the following functions: summing, multiplication, averaging, or concatenation [28]. We used the structure presented in Figure 6 to classify the EEG signals.
The BILSTM structure shown in Figure 6 consists of two hidden BILSTM layers: a softmax (normalized exponential function) layer for classification into the class labels, and an input layer containing the data displayed by the NeuroSky headset. From dataset, 80% were used for training and 20% for testing. For backpropagation (weight updating), the ‘Adam’, ‘Sigmoid’ and ‘RMSProp’ versions of gradient descent was used.
2.5.3 Deep learning network
Deep-learning models are models that learn through non-linear transformations. Deep-learning networks (DNNs) has been explored for the classification of EEG signals efficiently [29], they contain several layers. The layers are of different types: the principal three types used for building deep neural networks are the fully connected (FC), convolutional, and recurrent layers [30]. We experiment with three different DL models with varying complexity and different architectural properties to test and compare the performance of the extracted features and power spectra images as classification inputs.
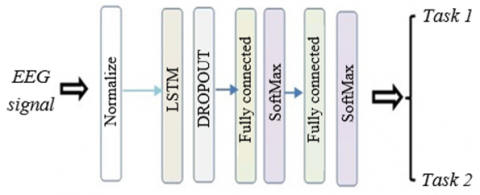
We used fully connected LSTM layers to build our first model, presented in Figure 7.
Every neuron in the FC layer receives the activation of every neuron in the previous layer as input. The dropout layer is used to reduce overfitting. The values 1 and 0 mean no input; 0.5 is used for this hyperparameter.
Figure 7. The fully connected deep learning model proposed
2.5.4 Image classifiers
To classify images, we have chosen two classifiers, the first one includes a convolutional layer, the convolutional neural network (CNN) has been used recently for image classification [31, 32], we have chosen a six layers CNN architecture; the design includes an image input layer, a dropout layer, a fully connected layer, a softmax layer, and the last one, the classification layer. The second classifier, is a simple deep neural network with four layers, which includes a fully connected layer and a softmax layer.
The data were divided into two groups for the two imagery tasks: one for training and the second for testing. We classified our three types of data with different neural networks. We used BiLSTM, LSTM neural networks, and deep learning networks. We evaluated the classifiers using Adam, sigmoid, and rmsprop optimizers. We investigated the classification into two groups:
- Raw data and extracted features with BiLSTM, LSTM neural networks, and deep learning networks, and the results are presented in Table 1.
- Power spectra images with a convolutional neural network and a simple neural network, with the results presented in Table 2.
Table 1. Comparative results (in percentages) of raw data and extracted features classification
|
|
Hyper-Parameters |
BiLSTM |
LSTM |
DNN LSTM |
|
Raw data |
Sgmd |
57.0% |
71.0% |
54.0% |
|
Adam |
68.0% |
50.0% |
75.0% |
|
|
Rmsprop |
65.0% |
52.0% |
54.0% |
|
|
Features SE IF |
Sgmd |
48.0% |
51.0% |
51.0% |
|
Adam |
58.0% |
52.0% |
49.0% |
|
|
Rmsprop |
55.0% |
51.0% |
54.0% |
Table 2. Comparative results (in percentages) of power spectra images classification
|
Images |
Hyper-Parameters |
Convolutional DNN |
Simple Network DNN |
|
Power spectra grayscale images |
Sgmd |
94.87% |
97.44% |
|
Adam |
89.74% |
94.87% |
|
|
Rmsprop |
96.15% |
93.59% |
|
|
Power spectra color images |
Sgmd |
64.94% |
68.83% |
|
Adam |
90.91% |
85.71% |
|
|
Rmsprop |
96.10% |
92.21% |
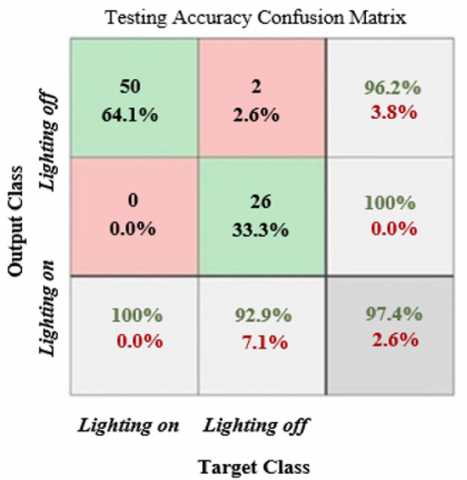
The results imply that power spectra images are more suitable for imagery classification, especially greyscale images, with an accuracy range from 89.7% to 97.4% instead of color images, with an accuracy range from 64.94% to 96.10%. The highest accuracy of 97.4% was achieved with the sigmoid function, as illustrated by the confusion matrix plot in Figure 8.
The grey images were more efficient than the color images because pixels in color images are represented by three values (red, green, bleu); otherwise, in greyscale images, pixels are represented by one value, which reduces the size of data efficiently and improves the memory usage and processing time subsequently. Additionally, the importance of power spectra presentation is the intensity of power that each signal contains; the graduation of color is trivial in our case, so the greyscale images will be adequate for the classification. The key criterion of greyscale is the visualization of the most dominant frequency, with reduce signal noise or artifacts.
In conclusion, our study focused on the classification of daily imagery tasks using various feature extraction methods and neural network architectures, including LSTM, BiLSTM, and DNN-LSTM classifiers applied to raw data and extracted features. Notably, the classification of greyscale power spectra images yielded the most promising results, achieving an accuracy of 97.4%. The superior performance of image classification, particularly with greyscale images, underscores the significance of this approach in the context of imagination tasks. Raw data, in contrast, proved to be insignificant for these tasks.
Our findings represent a substantial step toward realizing a brain-computer interface controlled solely by thought for daily tasks. The primary contribution of our work lies in the effective utilization of greyscale power spectra images as inputs for classification, offering a valuable insight for future BCI development. While the results suggest the simplicity of a DNN architecture as the optimal choice for classifying imagery tasks, further exploration is needed. As part of future work, the development of a prototype will be undertaken, addressing practical aspects and potential challenges in implementing our findings.
Our objective was to make an application that contains some options. One of these options is to light off and on the room. When the user mentally chooses an option, the device will select it. The environment of the experiment was a natural environment within an office with students; we have not used specific isolated environment.
The prototype we would adapt will be a device with an interactive interface with some options; once an option is selected mentally, the classification algorithm will highlight it. The signal acquisition device will be the same device used in our experiment, the NeuroSky headset. The device receives the EEG signals via Bluetooth, and the classification algorithm on the device will be implemented on an open-source electronic prototyping platform, such as Arduino. The challenge is using the device in real-time and training the users. By addressing these challenges, we aim to advance the practical implementation of BCI technology, making it more accessible and efficient for everyday applications.
We thank our participants for their time and their cooperation in the experiment.
[1] Nicolas-Alonso, L.F., Gomez-Gil, J. (2012). Brain computer interfaces, a review. Sensors, 12(2): 1211-1279. https://doi.org/10.3390/s120201211
[2] Keirn, Z.A., Aunon, J.I. (2002). A new mode of communication between man and his surroundings. IEEE Transactions on Biomedical Engineering, 37(12): 1209-1214. https://doi.org/10.1109/10.64464
[3] Guo, Y., Wang, M., Zheng, T., Li, Y., Wang, P., Qin, X. (2020). NAO robot limb control method based on motor imagery EEG. In 2020 International Symposium on Computer, Consumer and Control (IS3C), Taichung City, Taiwan, pp. 521-524. https://doi.org/10.1109/IS3C50286.2020.00141
[4] Singh, U., Ahirwal, M.K. (2023). Improved classification of mental workload using one dimensional convolutional neural network and smote technique. In Proceedings of the 2023 7th International Conference on Graphics and Signal Processing, Fujisawa, Japan, pp. 50-55. https://doi.org/10.1145/3606283.3606291
[5] Abdulrahman, A., Baykara, M. (2021). A comprehensive review for emotion detection based on EEG signals: Challenges, applications, and open issues. Traitement du Signal, 38(4): 1189-1200. https://doi.org/https://doi.org/10.18280/ts.380430
[6] Göker, H. (2023). Welch spectral analysis and deep learning approach for diagnosing alzheimer’s disease from resting-state EEG recordings. Traitement du Signal, 40(1): 257-264. https://doi.org/https://doi.org/10.18280/ts.400125
[7] Li, M., Chen, W. (2021). FFT-based deep feature learning method for EEG classification. Biomedical Signal Processing and Control, 66: 102492. https://doi.org/10.1016/j.bspc.2021.102492
[8] Fu, Y., Li, Z., Gong, A., Qian, Q., Su, L., Zhao, L. (2022). Identification of visual imagery by electroencephalography based on empirical mode decomposition and an autoregressive model. Computational Intelligence and Neuroscience, 2022(1): 1038901. https://doi.org/10.1155/2022/1038901
[9] Huang, C., Xiao, Y., Xu, G. (2021). Predicting human intention-behavior through EEG signal analysis using multi-scale CNN. IEEE/ACM Transactions on Computational Biology and Bioinformatics, 18(5): 1722-1729. https://doi.org/10.1109/TCBB.2020.3039834
[10] Hrisca-Eva, O.D., Lazar, A.M. (2021). Multi-Sessions outcome for EEG feature extraction and classification methods in a motor imagery task. Traitement du Signal, 38(2): 261-268. https://doi.org/https://doi.org/10.18280/ts.380202
[11] Ak, A., Topuz, V., Midi, I. (2022). Motor imagery EEG signal classification using image processing technique over GoogLeNet deep learning algorithm for controlling the robot manipulator. Biomedical Signal Processing and Control, 72: 103295. https://doi.org/10.1016/j.bspc.2021.103295
[12] Xiong, X., Yu, Z., Ma, T., Wang, H., Lu, X., Fan, H. (2020). Classifying action intention understanding EEG signals based on weighted brain network metric features. Biomedical Signal Processing and Control, 59: 101893. https://doi.org/10.1016/j.bspc.2020.101893
[13] Wu, B., Meng, W., Chiu, W.Y. (2022). Towards enhanced EEG-based authentication with motor imagery brain-computer interface. In Proceedings of the 38th Annual Computer Security Applications Conference, New York, United States, pp. 799-812. https://doi.org/10.1145/3564625.3564656
[14] Wang, X., Liesaputra, V., Liu, Z., Wang, Y., Huang, Z. (2024). An in-depth survey on deep learning-based motor imagery electroencephalogram (EEG) classification. Artificial Intelligence in Medicine, 147: 102738. https://doi.org/10.1016/j.artmed.2023.102738
[15] Pavlov, A.N., Runnova, A.E., Maksimenko, V.A., Pavlova, O.N., Grishina, D.S., Hramov, A.E. (2018). Detrended fluctuation analysis of EEG patterns associated with real and imaginary arm movements. Physica A: Statistical Mechanics and its Applications, 509: 777-782. https://doi.org/10.1016/j.physa.2018.06.096
[16] Ding, L., Duan, W., Wang, Y., Lei, X. (2022). Test-retest reproducibility comparison in resting and the mental task states: A sensor and source-level EEG spectral analysis. International Journal of Psychophysiology, 173: 20-28. https://doi.org/10.1016/j.ijpsycho.2022.01.003
[17] Ravan, M., Noroozi, A., Sanchez, M.M., Borden, L., Alam, N., Flor-Henry, P., Colic, S., Khodayari-Rostamabad, A., Minuzzi, L., Hasey, G. (2024). Diagnostic deep learning algorithms that use resting EEG to distinguish major depressive disorder, bipolar disorder, and schizophrenia from each other and from healthy volunteers. Journal of Affective Disorders, 346: 285-298. https://doi.org/10.1016/j.jad.2023.11.017
[18] Kwon, B.H., Lee, B.H., Cho, J.H., Jeong, J.H. (2022). Decoding visual imagery from EEG signals using visual perception guided network training method. In 2022 10th International Winter Conference on Brain-Computer Interface (BCI), Gangwon-do, Korea, pp. 1-5. https://doi.org/10.1109/BCI53720.2022.9735014
[19] EEG-ECG-Biosensors. (2025). https://NeuroSky .com/, accessed on Jan. 15, 2023.
[20] Nafea, M., Abdul-Kadir, N.A., Harun, F.K.C. (2018). Brainwave-controlled system for smart home applications. In 2018 2nd International Conference on BioSignal Analysis, Processing and Systems (ICBAPS), Kuching, Malaysia, pp. 75-80. https://doi.org/10.1109/ICBAPS.2018.8527397
[21] Qing-Hua, W., Li-Na, W., Song, X. (2020). Classification of EEG signals based on time-frequency analysis and spiking neural network. In 2020 IEEE International Conference on Signal Processing, Communications and Computing (ICSPCC), Macau, China, pp. 1-5. https://doi.org/10.1109/ICSPCC50002.2020.9259508
[22] Díaz, D., Córdova, F. (2022). Visualization of EEG brain entropy dynamic maps in basal resting state conditions. Procedia Computer Science, 199: 1393-1400. https://doi.org/10.1016/j.procs.2022.01.176
[23] Boashash, B. (1992). Estimating and interpreting the instantaneous frequency of a signal-Part 1: Fundamentals. In Proceedings of the IEEE, 80(4): 520-538. https://doi.org/10.1109/5.135376
[24] Zeng, Y., Lao, J., Wu, Z., Lin, G., Wang, Q., Yang, M., Zhang, S., Xu, D., Zhang, M., Liang, S., Liu, Q., Yao, K., Li, J., Ning, Y., Zhong, X. (2024). Altered resting-state brain oscillation and the associated cognitive impairments in late-life depression with different depressive severity: An EEG power spectrum and functional connectivity study. Journal of Affective Disorders, 348: 124-134. https://doi.org/10.1016/j.jad.2023.10.157
[25] Ou, S., Cao, Y., Xie, T., Jiang, T., Li, J., Luo, W., Ma, N. (2023). Effect of homeostatic pressure and circadian arousal on the storage and executive components of working memory: Evidence from EEG power spectrum. Biological Psychology, 184: 108721. https://doi.org/10.1016/j.biopsycho.2023.108721
[26] Clark, M., Euler, M.J., King, B.R., Williams, A.M., Lohse, K.R. (2024). Associations between age-related differences in occipital alpha power and the broadband parameters of the EEG power spectrum: A cross-sectional cohort study. International Journal of Psychophysiology, 195: 112272. https://doi.org/10.1016/j.ijpsycho.2023.112272
[27] Hochreiter, S., Schmidhuber, J. (1997). Long short-term memory. Neural Computation, 9(8): 1735-1780. https://doi.org/10.1162/neco.1997.9.8.1735
[28] Mwata-Velu, T.Y., Avina-Cervantes, J.G., Cruz-Duarte, J.M., Rostro-Gonzalez, H., Ruiz-Pinales, J. (2021). Imaginary finger movements decoding using empirical mode decomposition and a stacked BiLSTM architecture. Mathematics, 9(24): 3297. https://doi.org/10.3390/math9243297
[29] Yang, J., Huang, X., Wu, H., Yang, X. (2020). EEG-based emotion classification based on bidirectional long short-term memory network. Procedia Computer Science, 174: 491-504. https://doi.org/10.1016/J.PROCS.2020.06.117
[30] Xu, C., Xia, R.Z. (2023). EEG signal classification and feature extraction methods based on deep learning: A review. In 2023 2nd International Conference on Big Data, Information and Computer Network (BDICN), Xishuangbanna, China, pp. 186-189. https://doi.org/10.1109/BDICN58493.2023.00046
[31] Hatcher, W.G., Yu, W. (2018). A survey of deep learning: Platforms, applications and emerging research trends. IEEE Access, 6: 24411-24432. https://doi.org/10.1109/ACCESS.2018.2830661
[32] Medhi, K., Hoque, N., Dutta, S.K., Hussain, M.I. (2022). An efficient EEG signal classification technique for brain-computer interface using hybrid deep learning. Biomedical Signal Processing and Control, 78: 104005. https://doi.org/10.1016/j.bspc.2022.104005