Jianxin Hu![]() | Senguang Yan
| Senguang Yan![]() | Shangpu Ai
| Shangpu Ai![]() | Yucheng Wang
| Yucheng Wang![]() | Wenlong Fan
| Wenlong Fan![]() | Shilong Chang
| Shilong Chang![]() | Gongjian Che*
| Gongjian Che*![]() | Linyan Xue*
| Linyan Xue*![]()
© 2025 The authors. This article is published by IIETA and is licensed under the CC BY 4.0 license (http://creativecommons.org/licenses/by/4.0/).
OPEN ACCESS
To address the challenges of non-stationarity and multi-scale feature extraction in bridge vibration signals for structural health monitoring, this paper proposes a deep learning framework, termed Wavelet-Statistic-Frame with LSTM-Attention Network (WSF-LANet), that integrates multi-source feature extraction with temporal modeling to extract damage-sensitive features from bridge vibration signals for identification and localization of different damage states. The model architecture is designed with three parallel feature extraction pathways: Discrete Wavelet Transform (DWT) based time-frequency analysis, extract statistical descriptors for quantifying latent damage indicators, and frame-wise segmentation and extraction of spatiotemporal features. After merging the features extracted from these three paths, a multi-attention block dynamically allocates weights across feature dimensions. The Long Short-Term Memory (LSTM) network is then used to further effectively capture the temporal dependencies of the sequence. The output is the final predicted damage matrix, which contains damage identification for each channel. In order to achieve both damage identification and localization functions, we additionally use unique heat encoding to represent multi-location and multi-category labels in a unified format. Experimental results show that on a bridge dataset from Japan, the proposed method achieves an accuracy of up to 97.5% for damage classification and a macro precision of 96.82% for localization. Ablation studies further validate the effectiveness of each feature extraction path. Cross-dataset evaluations also demonstrate strong generalization capability. In summary, the proposed WSF-LANet offers an efficient, accurate, and generalizable solution for intelligent damage identification and localization in bridge structural health monitoring.
structural damage detection, multi-source feature fusion, DWT, multi-label classification
With the continuous advancement of science and technology, bridge construction has developed rapidly over the past 30 years. These bridges have made significant contributions to social and economic development. However, under the influence of loads, environmental erosion, and natural disasters, bridge structures inevitably suffer from issues such as material corrosion and degradation, structural damage and cracking, performance deterioration, functional failure, and other types of defects or deterioration [1-4]. If structural damage in bridges is not detected in a timely manner, it can lead to serious engineering accidents, potentially resulting in devastating casualties and significant property losses. Therefore, the development of structural damage identification is of critical importance [5].
Structural health monitoring (SHM) systems can generally be categorized into visual-based damage detection methods, mathematical model-based damage detection methods, and data-based damage detection methods. Traditional visual inspection is usually based on manual visual inspection, which is labor-intensive, time-consuming, traffic-disturbing, and costly, in addition to the fact that the visual inspection results may be subject to the subjective judgment of the inspector [6, 7]. Nowadays, bridge inspection based on computer vision has also been developed [8, 9], which can effectively reduce the work intensity and subjective error of manual inspection. In addition, through the unmanned aerial vehicle or robotic system equipped with high-resolution camera equipment, efficient, contactless and full-coverage inspection of bridge structures can be realized, which can significantly improve the inspection efficiency and safety. However, vision-based damage detection focusing on detecting concrete cracking, concrete crushing, steel corrosion and steel fracture in visible components still has limitations, relying on environmental conditions and being limited to surface detection, and is unable to detect damage to the internal structure of the bridge [10].
In contrast, the bridge damage detection method based on mathematical modeling obtains the vibration signals (i.e., acceleration or strain) of the bridge through various sensors (e.g., displacement transducers, accelerometers, and strain gauges), and then constructs finite elements with physical formulas to deduce the specific damage conditions [4, 11-14]. The dynamic properties of the structure (e.g., intrinsic frequency, vibration pattern, and modal damping) are investigated in damaged and healthy states, and these changes alter the vibration characteristics of the structure. Thus mathematical model-based detection methods can detect damage to the internal structure of a bridge, including both visible and invisible components [15, 16]. Although methods based on mathematical models have strong physical interpretability, they rely on model accuracy and are difficult to accurately locate damage. Modal parameters are affected by environmental and operating conditions such as temperature, humidity, and vehicle load, and these changes may mask or mislead changes caused by damage, reducing the robustness of detection. Actual bridges are usually in non-ideal working conditions, resulting in deviations between theoretical models and actual measured responses.
In recent years, artificial intelligence has been gradually introduced into civil engineering, and this emerging and promising tool has attracted a great deal of attention from researchers [17]. Thus data-based damage detection methods were born. Machine learning has been applied to the task of data-based bridge damage detection, where damage-sensitive features are extracted directly from sensor-based measurements or simulated vibration data, and pattern recognition is performed on the structure [18]. The most popular algorithms used for data-based damage detection are such as Principal Component Analysis (PCA) [19, 20], Support Vector Machine (SVM) [21] and Random Forest (RF) [22]. However, these algorithms usually lead to considerable computational complexity and time, which affects the application of ML-based methods in real-time SHM operations.
Moreover, the complexity of bridge vibration signals under varying operational and environmental conditions further increases the challenge. ML often fail to generalize well across different scenarios. A large number of deep learning-based bridge damage diagnosis technologies have achieved results superior to traditional technologies in many aspects. Therefore, the focus of research is gradually shifting from mathematical models to data-driven intelligent diagnosis [23-26]. It is necessary to develop a deep learning model to investigate the vibration data collected from bridges under different dynamic conditions. Deep learning methods also face some challenges. In practical applications, model performance is highly dependent on the quantity and quality of training data. However, it is difficult to collect real bridge damage data, and it is also necessary to effectively extract sufficient features from the data.
In our paper, we propose a data-driven method to address the above issues by using three parallel methods to extract bridge vibration signal features. In the third branch, an improved Alexnet network is used as a feature extractor to extract intra-frame and inter-frame spatio-temporal features. The characteristic information contained in the signal that changes over time provides key clues about the target state. To extract features at a deeper level, we also use a multi-head attention mechanism to capture the correlations between features, and then use an Long Short-Term Memory (LSTM) module to capture the dynamic patterns of features, forming a model with a much more comprehensive understanding than a single model. This is particularly valuable for the processing of bridge vibration signals, as the correlation between damage and time series is of great importance.
Specifically, our major contributions are summarized as follows.
(i) The model architecture is designed with three parallel feature extraction pathways: Discrete Wavelet Transform (DWT) based time-frequency analysis, extract statistical descriptors for quantifying latent damage indicators, and frame-wise segmentation and extraction of spatiotemporal features. This achieves a multi-scale, multi-perspective representation of complex non-stationary vibration signals.
(ii) After multi-source feature fusion, a multi-attention mechanism is introduced to adaptively assign weights to different feature dimensions. Combined with LSTM for in-depth modeling of frame-level sequence dependencies, this effectively highlights damage-sensitive patterns and enhances the model's perception of temporal changes. To simultaneously enable both damage identification and localization, we further employ a distinctive heatmap-style encoding scheme that integrates multi-location and multi-category labels into a unified representation.
(iii) The results obtained using public data demonstrate the superiority of WSF-LANet in handling multi-channel time series classification and problems. In addition, ablation studies were conducted to verify the effectiveness of each design component. Furthermore, we verified the generalizability of WSF-LANet.
Convolutional neural network (CNN) as an artificial neural network can automatically learn many feature information from raw data and can be used to automatically detect relevant scenes, which ensures high detection accuracy and significantly improves the computational speed, and will be a potential SHM approach [27]. Sony et al. [28] proposed a multi-class SDI method based on 1D-CNN for analyzing the full bridge vibration response. In addition, Teng et al. [10] demonstrated a structural damage identification (SDI) method that uses CNNs to classify the location and severity of structural damage. Lin et al. [29] achieved structural damage identification by automatically extracting features from sensor data using CNN. Huang et al. [5] introduces an innovative approach to bridge SDI in a few-shot context by integrating an adaptive simulated annealing particle swarm optimization-convolutional neural network (ASAPSO-CNN) as the foundational framework, augmented by data enhancement techniques. Cofre-Martel et al. [30] proposes a CNN-based deep structure damage localization and quantification method, which composes images generated from the transfer rate function of a structure in order to utilize the image processing capabilities of CNNs and automatically extract and select features related to the structure degradation process.
In addition, LSTM has shown promising results in modeling long-term dependencies in sequential or time-series data for structural damage detection and localization. Fu et al. [31] proposed a CNN-LSTM based on hierarchical classification for capturing spatial and temporal information features between simulated data for large span bridge damage identification. The results show that the proposed hybrid approach achieves better classification performance (e.g., damage localization accuracy and average relative recognition error for damage severity identification) compared to the CNN model, even in the presence of noise.
Sun et al. [32] proposed an intra-frame network and fusion method for extracting feature vectors from signals for vehicle type recognition in the field. At the same time, an inter-frame classifier is proposed to analyze the temporal correlation between feature maps and overall classification. Although the combination of feature extraction and deep learning performs well in multi-dimensional time series classification, existing research has mainly focused on multi-sensor fusion, which is mainly applicable to single-frame target classification. Given that interframe classifiers can identify various types of vehicles based on damaged time series signals, it is theoretically possible to incorporate interframe correlation feature extraction of time series into the bridge damage identification process.
3.1 Overview
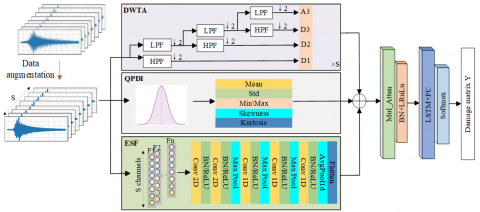
In this section, we first present our proposed method for classifying and locating bridge damage. The structure of WSF-LANet is illustrated in Figure 1. The original data is preprocessed with spatial enhancement, and noise is injected to improve data robustness. In the feature extraction stage, the system implements three parallel processing paths for preprocessed data. The first pathway directs the data through a DWT module, applying multi-resolution analysis to produce wavelet coefficients that exhibit excellent time-frequency localization. The second pathway focuses on extracting statistical features to characterize the shape of the data distribution. These features include key parameters such as the mean, extreme values, and kurtosis. In the third pathway, a sliding window mechanism divides the continuous signal into data frames with temporal dependencies, from which a modified AlexNet module subsequently extracts features. After merging the features extracted from these three paths, a multi-attention block dynamically allocates weights across feature dimensions. The output of the weighted optimized new feature vector is fed into the LSTM layer, followed by a fully connected layer. The purpose of this module is to further learn the global temporal information of each channel at each time step, thereby identifying dynamic temporal features. The FC layer is followed by the softmax function, which outputs prediction probabilities for each channel, ultimately forming the damage matrix Y.
Figure 1. The overall proposed framework and procedures
3.2 The proposed framework
3.2.1 DWT for time-frequency analysis (DWTA)
Unlike the traditional Fourier transform, which only provides global spectral information, the wavelet transform can perform localized analysis of signals simultaneously in both the time domain and the frequency domain. This multi-resolution characteristic makes DWT particularly suitable for analyzing non-stationary signals (such as mechanical vibrations), as their spectra change over time. DWT uses the Daubechies 4 (dB4) wavelet, which offers several significant advantages for extracting features from non-stationary signals. The extracted detail coefficients capture the high-frequency variations of the signal, enabling the representation of rapid changes and fine details Meanwhile, the approximation coefficients represent the low-frequency components of the signal, providing a deeper understanding of the signal's overall structure. The process of extracting features using DWT is shown in Figure 1. In which D1, D2, and D3 are the detail coefficients, and A4 is the approximation coefficient.
In order to map the wavelet coefficients of each layer to a fixed-length feature vector, the mean of each set of coefficients was calculated, and then these means were concatenated hierarchically. Let the approximation coefficients of the jth layer be the vector $C_A^{(L)}$, and the detail coefficients of the Kth layer be the vector $C_D^{(K)}$. Then, the approximate coefficient for the Lth layer is
$\mu_A^{(L)}=\frac{1}{\left|C_A^{(L)}\right|} \sum_n C_A^{(L)}[n]$ (1)
For the Kth layer (K=1,2,…,L), the detail coefficient is
$\mu_D^{(K)}=\frac{1}{\left|C_D^{(K)}\right|} \sum_n C_D^{(K)}[n]$ (2)
Concatenate all these means into a feature vector:
$f=\left[\mu_A^{(L)}, \mu_D^{(L)}, \mu_D^{(L-1)}, \ldots, \mu_D^{(1)}\right]^T$ (3)
Therefore, it can be concluded that if the input signal is a multidimensional time signal
$f=\left[\mu_A^{(L, 1)}, \mu_D^{(L, 1)}, \ldots, \mu_D^{(1,1)}, \mu_A^{(L, 2)}, \ldots, \mu_D^{(1, C)}\right]^T$ (4)
3.2.2 Quantify potential damage indicators (QPDI)
Statistical characterization of data is a method used to describe data distribution, providing information about the dataset, including the central location of the data, the dispersion of the data, and the skewness of the data. For the characteristics of measured data, this paper mainly selects the mean, standard deviation, root mean square, extreme value, and kurtosis as statistical characteristics.
$\left\{\begin{array}{c}\beta_1=\frac{1}{N} \sum_{i=1}^N x_i \\ \beta_2=\sqrt{\frac{1}{N} \sum_{i=1}^N\left(x_i-\mu\right)^2} \\ \beta_3=\sqrt{\frac{1}{N} \sum_{i=1}^N x_i^2} \\ \beta_4=\max \left(\left|x_1\right|,\left|x_2\right|, \ldots,\left|x_N\right|\right) \\ \beta_5=\frac{\frac{1}{N} \sum_{i=1}^N\left(x_i-\mu\right)^4}{\left(\frac{1}{N} \sum_{i=1}^N\left(x_i-\mu\right)^2\right)^2}\end{array}\right.$ (5)
The statistical features obtained from the above five calculations are input into the neural network for quantifying latent damage indicators.
3.2.3 Extraction of spatiotemporal features (ESF)
In this section, the entire input time signal segment is divided into multiple frames, and a method is employed to focus on the inter-frame change characteristics within the time series. The objective is to examine the minute changes in the signal that occur within extremely short time intervals, such as the response changes caused by impact vibrations on a bridge. In this paper, each frame is set to 0.1 seconds. When processing each frame, we use an improved AlexNet network as the inter-frame feature extractor to extract features. The network mainly consists of five convolutional layers, each followed by a BN layer and a nonlinear activation function (ReLU). The first two layers are two-dimensional convolutions used to extract features between eight channels within each time frame, while the last three layers are one-dimensional convolutions used to extract inter-frame features to analyze the dynamic evolution patterns between frames. Figure 1 shows the architecture of the improved AlexNet.
3.2.4 Deep contextual and dynamic analysis module
This module deeply integrates the core models of two different schools of thought: multi-head attention and LSTM. This is not a simple stacking but rather a complementary collaboration: Multi-head attention adaptively constructs a global feature relationship map for different features, capturing specific relationships between different channels; LSTM then deeply models frame-level sequence dependencies based on these relationships, capturing their dynamic patterns. Therefore, the LSTM block simultaneously possesses global temporal information for each variable.
4.1 Data setup
In this section, the performance of the proposed method was validated using a bridge dataset and two other types of time series datasets. The bridge dataset is a steel truss bridge located in Japan. The other two datasets are HandMovementDirection and PenDigits.
4.1.1 Old ADA Bridge
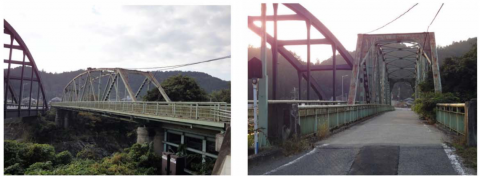
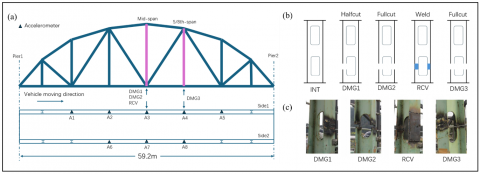
The Old ADA Bridge [33], constructed in Japan during 1959 as a steel-truss configuration, features a single-span supported design measuring 59.2 meters in length and 3.6 meters in deck width (Figure 2). Ambient vibration data were systematically recorded from this infrastructure under various operational conditions before its demolition. Dynamic responses were recorded using eight single-axis accelerometers, with sensor locations shown in Figure 3. Vertical acceleration was measured at a sampling rate of 200 Hz, with each scenario lasting approximately 45 seconds. The vehicle traveled across the bridge at a constant speed of 40 km/h, passing over it only once. Table 1 shows the specific test conditions. The vertical components of the steel truss bridge are divided into 14 units, named E1–E14. Acceleration sensors A1–A5 are placed on components E2–E6, while acceleration sensors A6–A8 are placed on components E10–E12. In addition to the aforementioned 8 accelerometers, an optical sensor is placed at each end of the bridge to monitor the exact time of vehicle entry and exit, and another optical sensor is installed at the bridge’s midpoint to verify the exact time of vehicle passage through the bridge’s center.
Figure 2. Photo of Old ADA Bridge
Figure 3. The overall layout, monitoring scheme and damage case of the bridge: (a) Sketch and sensor information; (b) Sketch of damage scenarios; (c) Artificial damage applied to tension members
Table 1. Vehicle-induced vibration test information
|
Case (Scenario) |
Vehicle Speed (km/h) |
No. Test Repetitions |
The Number of Channels |
|
INT |
40 |
10 |
12 |
|
DMG1 |
40 |
12 |
12 |
|
DMG2 |
40 |
10 |
12 |
|
RCV |
40 |
10 |
12 |
|
DMG3 |
40 |
10 |
12 |
Table 2. Details of time series datasets abbreviations: EEG—electroencephalogram and meg—magnetoencephalography
|
Dataset Name |
Num Class |
Train Size |
Series Length |
Test Size |
Num Dimensions |
Type |
|
HandMovementDirection |
4 |
160 |
400 |
74 |
10 |
EEG/MEG |
|
PenDigits |
10 |
7494 |
8 |
3498 |
2 |
EEG/MEG |
To artificially simulate damage, in addition to the healthy condition, four other different damage scenarios were considered. Figure 3(b) illustrates the sketches of the damage scenarios and the on-site photos of the artificially induced damage. INT represents a healthy condition; DMG1 involves cutting the vertical truss member at the third sensor location to half its cross-sectional depth; DMG2 involves completely cutting the vertical truss member from DMG1; RCV involves repairing the truss that was cut in DMG2; DMG3 involves completely cutting the vertical truss member at the fourth sensor location. Note that before restoring the completely cut truss member, a jack was used to attempt to reduce the gap between the two halves; however, it cannot be guaranteed that the bridge can be restored to its original intact state. In this paper, since damage identification is based on sensor locations, each location's damage type can be categorized into four types: INT, DMG1, DMG2, and RCV.
4.1.2 External validation datasets
HandMovementDirection is the third dataset from the BCI IV competition. The study recorded two participants moving a joystick from the center position to one of four targets radially distributed at 90° intervals using only their right hand and wrist after hearing a cue. The task was to classify the direction of movement based on magnetoencephalography (MEG) data recorded during the activity. Each instance included data from 10 MEG reading channels located above the motor area, spanning 0.4 seconds before movement to 0.6 seconds after movement. Table 2 presents the specific details of the dataset. For more information on the data collection process, please refer to [34].
PenDigits is a handwritten digit classification task taken from the UCI Archive, originally described in [35].44 writers were asked to draw the digits 0 to 9, where instances are made up of the x and y coordinates of the pen-tip traced across a digital screen. The coordinate data was originally recorded at a resolution of 500x500 pixels. It was then standardized and resampled to 100x100. Subsequently, based on the expertise of the original dataset creators, the data was spatially resampled to enable sampling with a constant spatial step size and variable temporal step size. The data is resampled into 8 spatial points, resulting in each instance having 2 dimensions of 8 points, with a single class label (0. . . 9) representing the digit drawn. Table 2 presents the specific details of the dataset.
4.2 Data preprocessing
To improve the robustness and generalization ability of the model, this study systematically preprocessed the original sensor data before model training, including data augmentation and label encoding operations.
4.2.1 Data augmentation
Due to the relatively limited amount of data available in bridge structural health monitoring tasks, especially under multi-sensor deployment conditions where the actual number of vehicle passages and damage conditions are scarce, this study uses an additive Gaussian white noise (AGWN) method for data augmentation to construct a more diverse training sample set. Specifically, let the original sensor-collected acceleration time series be $x \in \mathbb{R}^{C \times T}$, where C denotes the number of sensor channels (8 in this study) and T denotes the number of sampling points per signal segment. The process of introducing noise into the original signal $x$ to form the enhanced sample $\tilde{x}$ is as follows:
$\tilde{x}=x+\epsilon, \epsilon \sim \mathrm{N}\left(0, \sigma^2\right)$ (6)
Among these, $\mathrm{N}\left(0, \sigma^2\right)$ denotes a Gaussian white noise distribution with a mean of 0 and a standard deviation of σ. To avoid damaging the structural characteristics of the original signal, the noise standard deviation σ is set to 5%~10%, of the original signal's mean amplitude, with specific values randomly sampled. Furthermore, to further enhance the diversity of the augmented data, the noise addition operation is performed independently on each channel, ensuring the variability of perturbations across different sensor channels and simulating the heterogeneity of multi-source signals in real-world scenarios. The augmented signals exhibit moderate perturbation characteristics in both the frequency domain and time domain, preserving key structural information while introducing minor perturbations to enhance the model's adaptability to non-ideal inputs.
4.2.2 Model input processing
After enhancing and preprocessing the raw sensor signals, the label information must also be encoded to meet the input requirements of the deep learning model. This study employs one-hot encoding to convert the target labels in the classification task. The objective is to integrate the damage category and damage location of the bridge into a single label, enabling the model to directly provide damage classification and localization functionality. This task has a multi-location output characteristic, where each sample corresponds to multiple damage detection locations, and each location requires prediction of its corresponding damage category. Therefore, the overall task can be categorized as a multi-label, multi-class classification problem, where each label channel represents a specific spatial location, and the label value indicates the damage type at that location.
This paper converts label vectors into one-hot encoding form, allowing the classification task for each damage location to be performed independently, thereby forming a multi-location, multi-class label joint prediction output space. Specifically, let the original label space be $\mathcal{Y}=\left\{L_0, L_1, \ldots, L_{K-1}\right\}$, where K denotes the total number of damage detection locations on the bridge. $\mathcal{L}=\{0,1, \ldots, 0\}$, where the dimension of $\mathcal{L}$ is the number of damage categories. The entire process of one-hot encoding converts each category label n into an N-dimensional vector, where only the nth position is 1, and the remaining positions are 0. For example, if the damage category number is 2 (in this paper, the undamaged condition is assigned index 0), and the total number of categories is 5, then its one-hot encoding is [0,0,1,0,0]. If there are 5 sensor locations and this damage occurs at the third damage location on the bridge, then the label space Y is represented as a K×N matrix, with each row indicating the damage category encoding for that location. For example,
$\mathcal{Y}=\left[\begin{array}{l}1,0,0,0,0 \\ 1,0,0,0,0 \\ 0,0,1,0,0 \\ 1,0,0,0,0 \\ 1,0,0,0,0\end{array}\right]$ (7)
This design not only retains damage category information but also explicitly encodes its location, enabling the network to jointly model damage classification and localization tasks. It can also be directly used for modeling multi-class cross-entropy loss functions, supporting joint optimization of damage classification and localization. This setup not only captures potential spatial correlations between different locations but also allows the model to maintain strong expressive power and classification robustness in complex scenarios where different damage types exist at multiple locations. It also provides a foundation for the construction of multi-task loss functions, enabling the model to simultaneously optimize classification accuracy and damage localization precision.
4.3 Model evaluation metrics
In order to comprehensively evaluate the performance of the proposed model in bridge damage identification tasks, this paper selects several commonly used and representative evaluation indicators from the perspectives of classification accuracy and localization ability, including accuracy, precision, recall, and F1-score.
On this basis, this paper also uses ROC curves to visually analyze the model's prediction results, allowing us to intuitively observe the model's ability to identify different damage samples, thereby revealing the model's strengths and weaknesses in specific categories.
5.1 Experimental results
To comprehensively evaluate the performance of the proposed method in bridge damage identification and localization tasks, this paper conducted multiple experiments on publicly available datasets. The model outputs are damage label matrix form, corresponding to damage categories at multiple locations in the bridge structure. In the experiments, all data collected from all sensors were used to train and test the algorithm. 80% and 20% of the images were used for training and testing, respectively.
5.1.1 Damage identification performance
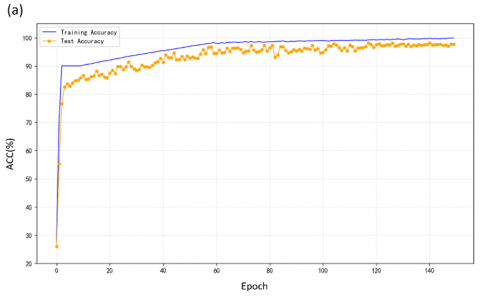
In this study, to validate the effectiveness and feasibility of the proposed method, the damage detection method based on multi-modal feature extraction and classification described in Section 3.2 was applied to the bridge from Japan. Each multi-label vector from each experiment can be regarded as a single label, and each combination can be viewed as a single category. Therefore, when evaluating model performance, the task can be flexibly treated as a standard multi-classification task for comparison with other models. The training process is shown in Figure 4(a). The results show that WSF-LANet can quickly reach convergence and maintain high and stable accuracy and low training loss values during the later training period. Figure 4(b) shows the ROC curve during the testing process. This figure displays the ROC curves for the four categories of the multi-classification model and their corresponding AUC values, used to evaluate classification performance. The AUC values for all categories exceed 0.8, indicating that the model achieves overall good classification performance. Among them, DMG2 has the highest AUC (0.98) and the best recognition performance, while DMG3 has the lowest (0.92). The gray dashed line represents the baseline for random predictions.
Table 3 shows the overall accuracy, F1, recall, and precision of WSF-LANet in the test set. According to Table 3, the average accuracy of the predicted test dataset is as high as 97.5%. In addition, to study the performance of WSF-LANet damage type discrimination, we compared it with four existing bridge damage detection algorithms. Overall, the experimental results of WSF-LANet on the Old ADA Bridge dataset outperform the other four methods. Specifically, compared with the semi-supervised learning method of MS-GAN [36], the ACC is improved by 11.08%; compared with the methods utilizing the physical domain or finite element analysis of PGDNN [37] and DT+TL [38], the ACC is improved by 11.01% and 0.2%, respectively. Compared to methods using CWT and AlexNet [39], the ACC improved by 2.89%. The excellent performance of WSF-LANet can be attributed to its three parallel feature extraction paths, which effectively capture the dynamic characteristics of bridge time-series signals, combined with the deep contextual and dynamic analysis module, enabling more efficient multi-scale feature extraction and dynamic analysis.
Figure 4. (a) ACC change curve during training; (b) ROC curve of the testing process
Table 3. The overall accuracy, F1, recall and precision of WSF-LANet in the test set
|
Model |
ACC |
F1-Score |
Recall |
Precision |
|
WSF-LANet |
0.9750 |
0.9620 |
0.9700 |
0.9680 |
|
MS-GAN |
0.8642 |
— |
— |
— |
|
PGDNN |
0.8649 |
— |
— |
— |
|
DT+TL |
0.9730 |
— |
— |
— |
|
CWT+AlexNet |
0 .9461 |
— |
— |
— |
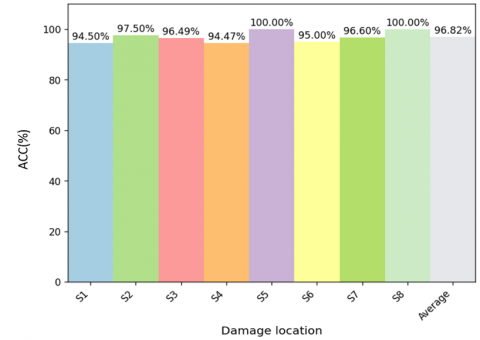
Figure 5. The ACC prediction results for each sensor
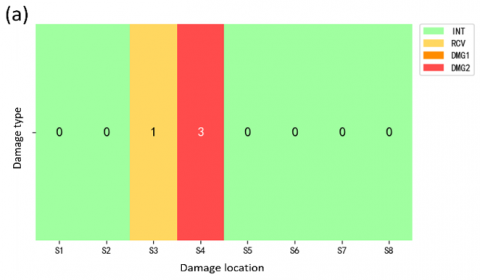
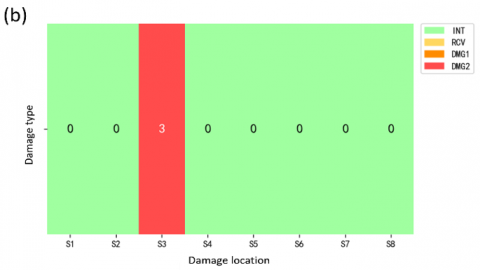
Figure 6. Visualization of partial injury localization results (a) indicates the visualization status of DMG3; (b) indicates the visualization status of DMG2
5.1.2 Damage localization performance
In this study, to further validate the effectiveness of the proposed method in bridge damage localization tasks, an evaluation index system was designed to assess the localization capabilities for various damage locations. Accurate localization of damage locations can be expressed as the accuracy of damage prediction at each sensor location. The higher the average damage prediction accuracy at sensor locations, the higher the localization accuracy of the system. Figure 5 shows the ACC prediction results for each sensor, yielding an average prediction positioning accuracy of 96.82%. This demonstrates that WSF-LANet has a high positioning accuracy. Figure 6 shows some visualizations of damage localization results, where the damage location corresponds to the sensor location, and the damage category varies with color, clearly displaying the damage type at each damage location, thereby allowing for an intuitive observation of the location where the damage occurred.
5.2 Ablation study
To further validate the contribution of each component module in the proposed model to the overall performance, a series of ablation experiments were designed and conducted. The original model only had deep contextual and dynamic analysis modul; by gradually adding key modules, we observed changes in the model's performance in damage identification and localization tasks, thereby systematically analyzing the actual role of each module.
As shown in Table 4, under the condition that the remaining training settings remain unchanged, the key indicators such as damage classification accuracy, macro F1-score, recall, and precision of each model on the main dataset are compared.
Table 4. The accuracy of damage classification, macro F1 score, recall and precision of each model on the main dataset
|
Model |
ACC |
F1-score |
Recall |
Precision |
|
Baseline |
0.8263 |
0.7520 |
0.8125 |
0.8440 |
|
+QPDI |
0.8960 |
0.9080 |
0.8750 |
0.8680 |
|
+ESF |
0.9250 |
0.9110 |
0.9255 |
0.9215 |
|
+DWTA |
0.9750 |
0.9620 |
0.9700 |
0.9680 |
5.3 Generalizability of WSF-LANet
To verify the generality and generalization ability of the proposed method, this paper further conducted transfer experiments on two other time series datasets. During the dataset experiment, the model structure remained unchanged, and only the input data was standardized and encoded according to the same preprocessing process.
The results are shown in Table 5, where the proposed method still achieves excellent classification and localization performance on other datasets. In the HandMovementDirection dataset, our model achieved the highest ACC score. However, in the PenDigits dataset, TapNet achieved the highest score, but our dataset score still ranked second. In the classification task, the model achieved a high accuracy score, indicating that it still has strong discriminative ability in complex scenarios. This further verifies the stability and robustness of the model under different data distribution conditions.
The results clearly demonstrate that the multi-source feature fusion and time series modeling strategy constructed in this paper is not only applicable to specific structural scenarios, but also has good transferability and can be extended to more practical bridge structural health monitoring tasks or other time series classification problems.
Table 5. Accurate results achieved on other datasets
|
Dataset |
1NN-ED |
1NN-DTW |
TapNet |
MF-Net |
Ours |
|
HandMovementDirection |
0.279 |
0.306 |
0.378 |
0.500 |
0.586 |
|
PenDigits |
0.973 |
0.939 |
0.980 |
0.956 |
0.977 |
The three-path parallel feature extraction structure proposed in this study integrates time-frequency analysis, statistical descriptors for quantifying latent damage indicators, and frame-wise segmentation and extraction of spatiotemporal features. This multi-source, multi-scale information fusion strategy significantly enhances the model's ability to characterize different damage patterns. On the one hand, the DWTA path captures non-stationary changes in structural vibration signals, effectively addressing issues such as complex damage types and significant changes in frequency characteristics. On the other hand, the QPDI path introduces the potential morphological information of the global signal, which helps enhance the model's understanding of the overall trend of the data. The ESF path strengthens the model's ability to model spatiotemporal dependencies and transient changes. These three features are efficiently fused in the “feature combination” module, significantly improving the discriminative ability of the final feature vector and laying a solid foundation for subsequent localization and classification tasks. After feature fusion, the model introduces a multi-head attention mechanism to construct a global feature relationship map for different features, capturing specific relationships between different channels. The LSTM network effectively models the dynamic dependencies between different time frames, further enhancing the temporal structure modeling of bridge vibration signals. The memory gating mechanism of LSTM helps the model capture signal trend changes within a long time window, improving sensitivity to damage occurrence time features, thereby enhancing the robustness and accuracy of bridge condition recognition. Additionally, this study innovatively adopts a one-hot encoding scheme to integrate multi-location, multi-category damage labels into a unified output matrix, enabling the model to simultaneously perform damage identification and localization in a single task.
The performance and feasibility of the proposed method were validated using public datasets. The results show that the accuracy rate for bridge damage classification can reach 97.5%, while the macro accuracy rate for bridge damage localization can reach 96.82%. Compared with various existing methods, this model demonstrates a significant advantage in terms of accuracy. Ablation experiments further confirm the positive contribution of each feature extraction pathway and key module to the overall performance of the model. Additionally, successful application on two additional publicly available time-series datasets validates the model's strong generalization capability and robustness.
In summary, the model proposed in this paper fully integrates multi-source information and temporal characteristics of structural response signals, providing an efficient, accurate, and promising solution for intelligent damage identification and localization in bridge structural health monitoring. Future research can further explore the model's lightweight deployment, cross-structure transferability, and integration with actual online monitoring systems.
[1] Huang, M., Cheng, X., Lei, Y. (2021). Structural damage identification based on substructure method and improved whale optimization algorithm. Journal of Civil Structural Health Monitoring, 11(2): 351-380. https://doi.org/10.1007/s13349-020-00456-7
[2] Luo, J., Huang, M., Lei, Y. (2022). Temperature effect on vibration properties and vibration-based damage identification of bridge structures: A literature review. Buildings, 12(8): 1209. https://doi.org/10.3390/buildings12081209
[3] Deng, Z., Huang, M., Wan, N., Zhang, J. (2023). The current development of structural health monitoring for bridges: A review. Buildings, 13(6): 1360. https://doi.org/10.3390/buildings13061360
[4] Azhar, A.S., Kudus, S.A., Jamadin, A., Mustaffa, N.K., Sugiura, K. (2024). Recent vibration-based structural health monitoring on steel bridges: Systematic literature review. Ain Shams Engineering Journal, 15(3): 102501. https://doi.org/10.1016/j.asej.2023.102501
[5] Huang, M., Zhang, J., Li, J., Deng, Z., Luo, J. (2025). Damage identification of steel bridge based on data augmentation and adaptive optimization neural network. Structural Health Monitoring, 24(3): 1674-1699. https://doi.org/10.1177/14759217241255042
[6] Karakostas, C., Quaranta, G., Chatzi, E., Zülfikar, A.C., Çetindemir, O., De Roeck, G., Yeşilyurt, A. (2024). Seismic assessment of bridges through structural health monitoring: A state-of-the-art review. Bulletin of Earthquake Engineering, 22(3): 1309-1357. https://doi.org/10.1007/s10518-023-01819-3
[7] Jiao, P., Borchani, W., Hasni, H., Lajnef, N. (2017). A new solution of measuring thermal response of prestressed concrete bridge girders for structural health monitoring. Measurement Science and Technology, 28(8): 085005. https://doi.org/10.1088/1361-6501/aa6c8e
[8] Hou, F., Lei, W., Li, S., Xi, J., Xu, M., Luo, J. (2021). Improved Mask R-CNN with distance guided intersection over union for GPR signature detection and segmentation. Automation in Construction, 121: 103414. https://doi.org/10.1016/j.autcon.2020.103414
[9] Nasiruddin Khilji, T., Lopes Amaral Loures, L., Rezazadeh Azar, E. (2021). Distress recognition in unpaved roads using unmanned aerial systems and deep learning segmentation. Journal of Computing in Civil Engineering, 35(2): 04020061. https://doi.org/10.1061/(ASCE)CP.1943-5487.0000952
[10] Teng, S., Chen, G., Wang, S., Zhang, J., Sun, X. (2022). Digital image correlation-based structural state detection through deep learning. Frontiers of Structural and Civil Engineering, 16(1): 45-56. https://doi.org/10.1007/s11709-021-0777-x
[11] Sharma, B., Pal, S., Kaur, N., Kumar, P. (2025). Finite element analysis of concrete bridge under moving load across and along the span. In 2025 International Conference on Innovation in Computing and Engineering (ICE), Greater Noida, India, pp. 1-6. https://doi.org/10.1109/ICE63309.2025.10984229
[12] Meng, Y., Chen, F., Huo, J. (2024). Bridge damage identification based on bridge finite element model and transformer. In 2024 6th International Conference on Electronics and Communication, Network and Computer Technology (ECNCT), Guangzhou, China, pp. 287-291. https://doi.org/10.1109/ECNCT63103.2024.10704501
[13] Shi, J., Shi, H., Wu, Z., Li, J. (2024). An on-board damage detection method for heavy-haul railway bridge based on sensitivity analysis of bogie responses. IEEE Sensors Journal, 24(4): 4642-4655. https://doi.org/10.1109/JSEN.2023.3342164
[14] Yu, Z. (2020). Multiscale finite element model and mechanical analysis of a cable-stayed bridge with large cantilever spine girder. In 2020 International Conference on Intelligent Transportation, Big Data & Smart City (ICITBS), Vientiane, Laos, pp. 305-308. https://doi.org/10.1109/ICITBS49701.2020.00069
[15] Pereira, S., Magalhães, F., Gomes, J.P., Cunha, Á., Lemos, J.V. (2021). Vibration-based damage detection of a concrete arch dam. Engineering Structures, 235: 112032. https://doi.org/10.1016/j.engstruct.2021.112032
[16] Shi, J., Shi, H., Li, J. (2023). A three-stage damage diagnosis method for heavy haul railway bridge by bogie response measurements. In 2023 Prognostics and Health Management Conference (PHM), Paris, France, pp. 177-182. https://doi.org/10.1109/PHM58589.2023.00042
[17] Azimi, M., Eslamlou, A.D., Pekcan, G. (2020). Data-driven structural health monitoring and damage detection through deep learning: State-of-the-art review. Sensors, 20(10): 2778. https://doi.org/10.3390/s20102778
[18] Gomez-Cabrera, A., Escamilla-Ambrosio, P.J. (2022). Review of machine-learning techniques applied to structural health monitoring systems for building and bridge structures. Applied Sciences, 12(21): 10754. https://doi.org/10.3390/app122110754
[19] Cross, E.J., Manson, G., Worden, K., Pierce, S.G. (2012). Features for damage detection with insensitivity to environmental and operational variations. Proceedings of the Royal Society A: Mathematical, Physical and Engineering Sciences, 468(2148): 4098-4122. https://doi.org/10.1098/rspa.2012.0031
[20] Huang, J., Yuan, S., Li, D., Jiang, T. (2025). A novel nonlinear output-only damage detection method based on the prediction error of PCA euclidean distances under environmental and operational variations. Structural Control and Health Monitoring, 2025(1): 4684985. https://doi.org/10.1155/stc/4684985
[21] Yang, Y., He, C., Wu, Y., Yu, X., Li, S., Wang, L. (2022). Characterization of stilbenes, in vitro antioxidant and cellular anti-photoaging activities of seed coat extracts from 18 Paeonia species. Industrial Crops and Products, 177: 114530. https://doi.org/10.1016/j.indcrop.2022.114530
[22] Zhang, Y., Xiong, Z., Liang, Z., She, J., Ma, C. (2023). Structural damage identification system suitable for old arch bridge in rural regions: Random forest approach. CMES-Computer Modeling in Engineering & Sciences, 136(1): 447-469. https://doi.org/10.32604/cmes.2023.022699
[23] Yang, C., Hou, X., Wang, L., Zhang, X. (2016). Applications of different criteria in structural damage identification based on natural frequency and static displacement. Science China Technological Sciences, 59(11): 1746-1758. https://doi.org/10.1007/s11431-016-6053-y
[24] Xiao, H., Wang, W., Ogai, H., Wang, M., Shen, R. (2022). Adversarial fuzzy-weighted deep transfer learning for intelligent damage diagnosis of bridge with multiple new damages. IEEE Sensors Journal, 22(17): 17005-17021. https://doi.org/10.1109/JSEN.2022.3192307
[25] Guo, T., Wu, L., Wang, C., Xu, Z. (2020). Damage detection in a novel deep-learning framework: A robust method for feature extraction. Structural Health Monitoring, 19(2): 424-442. https://doi.org/10.1177/1475921719846051
[26] Pathirage, C.S.N., Li, J., Li, L., Hao, H., Liu, W., Wang, R. (2019). Development and application of a deep learning–based sparse autoencoder framework for structural damage identification. Structural Health Monitoring, 18(1): 103-122. https://doi.org/10.1177/1475921718800363
[27] Pathak, N. (2020). Bridge health monitoring using CNN. In 2020 International Conference on Convergence to Digital World-Quo Vadis (ICCDW), Mumbai, India, pp. 1-4. https://doi.org/10.1109/ICCDW45521.2020.9318674
[28] Sony, S., Gamage, S., Sadhu, A., Samarabandu, J. (2022). Multiclass damage identification in a full-scale bridge using optimally tuned one-dimensional convolutional neural network. Journal of Computing in Civil Engineering, 36(2): 04021035. https://doi.org/10.1061/(ASCE)CP.1943-5487.0001003
[29] Lin, Y.Z., Nie, Z.H., Ma, H.W. (2017). Structural damage detection with automatic feature-extraction through deep learning. Computer-Aided Civil and Infrastructure Engineering, 32(12): 1025-1046. https://doi.org/10.1111/mice.12313
[30] Cofre-Martel, S., Kobrich, P., Lopez Droguett, E., Meruane, V. (2019). Deep convolutional neural network-based structural damage localization and quantification using transmissibility data. Shock and Vibration, 2019(1): 9859281. https://doi.org/10.1155/2019/9859281
[31] Fu, L., Tang, Q., Gao, P., Xin, J., Zhou, J. (2021). Damage identification of long-span bridges using the hybrid of convolutional neural network and long short-term memory network. Algorithms, 14(6): 180. https://doi.org/10.3390/a14060180
[32] Sun, L., Zhang, Z., Tang, H., Liu, H., Li, B. (2023). Vehicle acoustic and seismic synchronization signal classification using long-term features. IEEE Sensors Journal, 23(10): 10871-10878. https://doi.org/10.1109/JSEN.2023.3263572
[33] Kim, C.W., Zhang, F.L., Chang, K.C., McGetrick, P.J., Goi, Y. (2021). Ambient and vehicle-induced vibration data of a steel truss bridge subject to artificial damage. Journal of Bridge Engineering, 26(7): 04721002. https://doi.org/10.1061/(ASCE)BE.1943-5592.0001730
[34] Bagnall, A., Dau, H.A., Lines, J., Flynn, M., Large, J., Bostrom, A., Keogh, E. (2018). The UEA multivariate time series classification archive, 2018. arXiv preprint arXiv:1811.00075. https://doi.org/10.48550/arXiv.1811.00075
[35] Alimoğlu, F., Alpaydin, E. (2001). Combining multiple representations for pen-based handwritten digit recognition. Turkish Journal of Electrical Engineering and Computer Sciences, 9(1): 1-12.
[36] Zhang, F.L., Li, X., Kim, C.W., Mu, H.Q. (2024). Multicase structural damage classification based on semisupervised generative adversarial network. Structural Health Monitoring, 24(4): 2475-2503. https://doi.org/10.1177/14759217241258785
[37] Yin, X., Huang, Z., Liu, Y. (2023). Bridge damage identification under the moving vehicle loads based on the method of physics-guided deep neural networks. Mechanical Systems and Signal Processing, 190: 110123. https://doi.org/10.1016/j.ymssp.2023.110123
[38] Teng, S., Chen, X., Chen, G., Cheng, L. (2023). Structural damage detection based on transfer learning strategy using digital twins of bridges. Mechanical Systems and Signal Processing, 191: 110160. https://doi.org/10.1016/j.ymssp.2023.110160
[39] Amanollah, H., Asghari, A., Mashayekhi, M., Zahrai, S.M. (2023). Damage detection of structures based on wavelet analysis using improved AlexNet. Structures, 56: 105019. https://doi.org/10.1016/j.istruc.2023.105019