Yichen Sun![]() | Hongyu Sun*
| Hongyu Sun*![]()
© 2025 The authors. This article is published by IIETA and is licensed under the CC BY 4.0 license (http://creativecommons.org/licenses/by/4.0/).
OPEN ACCESS
With the advancement of smart grid development, the safe operation of power equipment is critical to ensuring reliable energy supply. Infrared imaging technology serves as an effective tool for fault detection in power systems; however, traditional image processing methods struggle to extract robust features under complex environmental conditions, limiting their effectiveness in achieving high-precision fault diagnosis. The emergence of deep learning has opened new avenues in this field. Nonetheless, existing studies based on YOLO-series algorithms face challenges such as low accuracy in detecting small-scale faults and limited capacity for analyzing multiple fault types. Additionally, current approaches to condition assessment often fail to integrate thermal distribution from infrared images with operational parameters, resulting in incomplete evaluations. To address these issues, this study proposes two major contributions: (1) an improved YOLOv5 algorithm enhanced with attention mechanisms for optimized feature fusion and an adaptive anchor box strategy to boost the detection accuracy of small-scale faults, such as bushing overheating and connector oxidation; and (2) a condition assessment framework that integrates features from infrared images, operating parameters, and historical fault data. A comprehensive indicator system is developed based on multi-source information fusion, and the Analytic Hierarchy Process (AHP) combined with a fuzzy comprehensive evaluation model is employed to quantify the health status of equipment. The proposed method significantly enhances the accuracy and robustness of fault identification and establishes an integrated "fault diagnosis–condition assessment" framework. These results offer a complete solution for intelligent maintenance of power equipment and provide valuable theoretical and practical insights for applying deep learning in the field of power system monitoring.
deep learning, power equipment, infrared imaging, fault diagnosis, condition assessment
With the deepening development of smart grid construction [1-4], the safe and stable operation of power equipment puts forward higher requirements for the reliability of energy supply. Infrared imaging technology [5-7], due to its ability to capture abnormal heating states of equipment in a non-contact manner, has become an important means for fault detection of power equipment. However, the operating environment of power equipment is complex, infrared images are easily affected by noise, target scale varies greatly, and fault features are often hidden in subtle differences of thermal imaging. Traditional image processing methods have limitations in feature extraction and fault recognition accuracy [8-11]. In recent years, deep learning technology has demonstrated significant advantages in the field of image recognition due to its powerful automatic feature learning capabilities [12-14], providing a new path for intelligent fault diagnosis of power equipment based on infrared images. How to combine deep learning algorithms with the characteristics of infrared images of power equipment to achieve accurate fault identification and scientific equipment condition assessment has become a research hotspot in the field of intelligent operation and maintenance of power systems.
Early diagnosis and condition assessment of power equipment faults are key links to ensure the safe operation of the power grid [15, 16]. Traditional manual inspection methods are inefficient and subjective, which are difficult to meet the real-time monitoring needs of large-scale equipment. Infrared image fault diagnosis systems based on deep learning [17, 18] can quickly locate potential fault hazards by analyzing equipment thermal imaging data, providing data support for operation and maintenance decision-making. Research on fault diagnosis and condition assessment technology for power equipment infrared images can not only improve the automation level of defect identification and reduce manual inspection costs, but also realize dynamic tracking of equipment health status by building a multi-dimensional condition assessment model, providing scientific basis for preventive maintenance and resource optimization of power systems. This has important practical significance for improving the safety, economy, and intelligence level of power grid operation.
In existing research, deep learning-based object detection algorithms have been widely used in fault recognition of infrared images of power equipment, but there are still certain limitations. For example, the traditional YOLOv5 algorithm, when processing small target faults in infrared images, suffers from decreased detection accuracy due to insufficient sensitivity of the feature extraction network to low-contrast targets [19]. At the same time, some studies focus only on the recognition of a single fault type and lack the ability for comprehensive analysis of multiple fault modes. In terms of condition assessment, existing methods mostly build evaluation models based on single fault features or historical operating data, failing to fully integrate the spatial thermal distribution information in infrared images with the equipment operating environment parameters, resulting in limited comprehensiveness and reliability of assessment results [20]. In addition, the existing systems lack a collaborative linkage mechanism between fault identification and condition assessment, making it difficult to form a complete technical chain from fault detection to condition prediction.
This paper carries out research in two aspects around the intelligent diagnosis and condition assessment of power equipment infrared images: first, aiming at the shortcomings of the traditional YOLOv5 algorithm in infrared image fault recognition, an improved object detection model is proposed. By introducing an attention mechanism to optimize the feature fusion path and combining an adaptive anchor box adjustment strategy to enhance the detection capability of small target faults, high-precision recognition of typical faults in infrared images of power equipment under complex backgrounds is achieved. Second, based on the fault recognition results, a condition assessment scheme for power equipment is constructed. By integrating infrared image features, equipment operating parameters, and historical fault data, a state assessment index system based on multi-source information coupling is established, and the AHP and fuzzy comprehensive evaluation model are used to realize the quantitative evaluation of equipment health status. The research value of this paper lies in: on the one hand, improving the accuracy and robustness of fault recognition of power equipment infrared images through improved deep learning algorithms, providing technical support for early fault warning; on the other hand, constructing an integrated system framework of "fault recognition–condition assessment", realizing deep integration from image detection to equipment health status analysis, and providing a complete solution for intelligent operation and maintenance of power equipment. The research results can effectively make up for the deficiencies of existing methods in multi-scenario adaptability and assessment comprehensiveness, and have important theoretical significance and practical value for promoting the engineering application of deep learning technology in the field of power equipment detection.
This paper chooses to use an improved YOLOv5 for fault recognition of power equipment infrared images, mainly due to the inherent advantages of the YOLOv5 model in lightweight structure and fast detection speed, which are highly adaptable to power equipment inspection scenarios, as well as the improvement space targeted at the characteristics of infrared images and the deficiencies of existing methods. Infrared images of power equipment often face challenges such as complex environmental noise interference, large differences in fault target scales, and low contrast of thermal imaging features. Traditional YOLOv5 has problems such as insufficient detection accuracy for small targets and low sensitivity of feature fusion to thermal distribution details when processing such images. By introducing advanced network structures and novel loss functions, the improved YOLOv5 can not only maintain high inference speed to meet the real-time inspection needs of power equipment, but also enhance the ability to extract and fuse subtle thermal abnormal features in infrared images, effectively improving the detection accuracy of multiple types of faults under complex backgrounds, especially making up for the limitations of traditional methods in small target fault recognition, providing a reliable data basis for subsequent equipment condition assessment based on fault recognition results.
2.1 Backbone network replacement
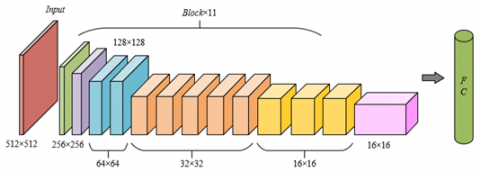
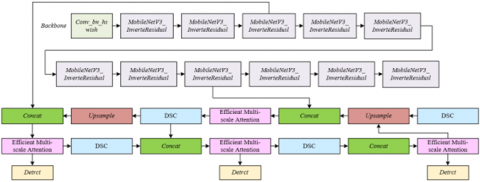
In the infrared inspection scenario of power equipment, infrared images often face the need for low-contrast thermal feature extraction in complex environments and the requirement of real-time detection, especially for multi-scale fault targets such as slight contact faults and local temperature rise. The backbone network of traditional YOLOv5s has problems such as high computational complexity and limited deployment on mobile terminals when dealing with such images. Therefore, this paper selects the MobileNetV3-Small structure as the backbone network to improve YOLOv5s. The specific architecture is shown in Figure 1. This network has comprehensive advantages in lightweight structure, computational efficiency, and feature extraction capability, which are highly consistent with the requirements of fault recognition for power equipment infrared images. The network inherits depthwise separable convolution (DSC) and inverted residual structure, and uses the NetAdapt algorithm to optimize the network structure. While significantly reducing the number of parameters and computational cost, it retains efficient feature extraction capability and can meet the needs of lightweight models and detection speed in power equipment inspection, especially suitable for real-time inference on edge devices such as drones and handheld terminals. In addition, the SE lightweight attention mechanism introduced in the network can perform channel-level weight adjustment for the hidden thermal distribution anomaly features in infrared images, enhancing the model’s attention to low-contrast fault areas, effectively improving the detection accuracy of small target faults under complex backgrounds, and making up for the shortcomings of traditional backbone networks in thermal feature focusing of infrared images.
As a backbone network, MobileNetV3-Small has structural characteristics that are highly consistent with the requirements of power equipment infrared image fault recognition. The network contains 11 Blocks using two different structures. First, it compresses the number of feature map channels through 1×1 convolution, which reduces computational redundancy while retaining key thermal imaging features, adapting to the characteristics of relatively single thermal distribution and complex background noise in infrared images. Then, it uses DSC to replace traditional convolution, decoupling channel-level feature extraction from cross-channel aggregation. While greatly reducing computational cost, it enhances feature sensitivity to low-contrast fault areas in infrared images through hierarchical processing. Specifically, the DSC first performs spatial feature extraction independently on each channel to accurately capture the local thermal features caused by temperature anomalies in infrared images, and then uses 1×1 convolution to realize cross-channel information fusion, generating comprehensive feature maps containing spatial position and thermal radiation intensity coupling information, effectively coping with the detection difficulties such as large scale differences of fault targets and low contrast between thermal features and background in power equipment infrared images. In addition, the flexible combination of two types of Block structures can adapt to different levels of feature extraction needs. Shallow Blocks focus on retaining the spatial location information of original thermal imaging, while deep Blocks strengthen the abstract representation of fault features under complex backgrounds through channel compression and feature aggregation, providing high-quality feature input with both detail representation and semantic information for subsequent multi-scale feature fusion and fault target detection, and improving the recognition accuracy of multiple types of faults such as bushing overheating and clamp oxidation while ensuring detection speed.
Figure 1. Backbone network architecture of improved YOLOv5s
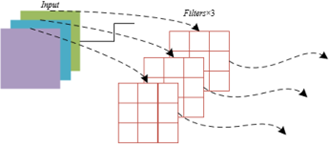
Figure 2. Principle of depthwise convolution step
DSC, as the core component of the MobileNetV3-Small backbone network, is based on the key idea of decoupling the “spatial feature extraction” and “inter-channel information fusion” processes of standard convolution into two independent steps: depthwise convolution and pointwise convolution. The principle of the depthwise convolution step is shown in Figure 2. The principle of the pointwise convolution step is shown in Figure 3. First, depthwise convolution performs spatial convolution operations independently on each channel of the input feature map, that is, for each input channel, a two-dimensional convolution kernel of size Fj×Fj is used for channel-wise feature extraction, and the output is an intermediate feature map with the same number of channels as the input. This step operates only on the spatial dimension and does not involve inter-channel information interaction. Its computational complexity is Fj×Fj×L×FD×FD, where L is the number of input channels, and FD×FD is the feature map size. The computational complexity of standard convolution is:
$F_j \times F_j \times L \times V \times F_D \times F_D$ (1)
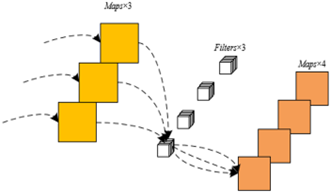
Figure 3. Principle of pointwise convolution step
where, V is the number of output channels. From the above formula, it can be seen that the computational complexity increases linearly with the number of output channels, rather than exponentially. Subsequently, pointwise convolution performs linear combination of the output of depthwise convolution through 1×1 convolution kernels, mapping L input channels to V output channels to realize inter-channel information fusion. The computation is L×V×FD×FD. The computational complexity of DSC is:
$F_j \times F_j \times L \times F_D \times F_D+F_D \times F_D$ (2)
This decomposition reduces the computation of standard convolution to approximately 1/V+1/(FD)2 times, significantly reducing the number of model parameters while retaining the feature extraction capability, making it particularly suitable for deployment on edge devices sensitive to computational resources.
$\frac{F_j \times F_j \times L \times F_D \times F_D+F_D \times F_D}{F_D \times F_D \times L \times V \times F_D \times F_D}=\frac{1}{V}+\frac{1}{F_j^2}$ (3)
In power equipment infrared image fault recognition, the hierarchical processing mechanism of DSC forms an effective match with the characteristics of infrared images. On the one hand, the fault features of infrared images are essentially thermal radiation intensity anomalies in local regions, manifested as spatial distribution differences on single channels. Depthwise convolution’s per-channel independent computation can accurately capture the temperature gradient changes of each pixel, performing spatial localization for low-contrast, weak-edge thermal anomaly regions. In specific application cases, for local overheating caused by poor contact of clamps, depthwise convolution can focus on the edge contours of subtle thermal spots using small-size convolution kernels, avoiding the blurred thermal feature boundaries caused by early fusion of background noise in traditional standard convolution due to cross-channel computation. On the other hand, the 1×1 channel aggregation operation of pointwise convolution can combine the spatial features extracted by depthwise convolution with the relative radiation intensity differences between channels to generate comprehensive feature maps containing “spatial position–thermal intensity coupling information.” In specific application cases, when handling bushing overheating faults, pointwise convolution can weight-combine the bushing contour features extracted from different depthwise convolution channels with the temperature anomaly signals in corresponding regions, enhancing the model's ability to determine the “association between high-temperature regions and device structure,” effectively distinguishing between normal heating and fault-induced heating. In addition, the lightweight nature of DSC allows the improved YOLOv5 model to perform real-time inference on devices with limited computing power, such as drones and handheld inspection terminals, meeting the practical needs of “fast detection–instant warning” in power equipment inspection.
The h-swish activation function, as a lightweight improved version of the swish function, replaces the sigmoid activation unit in the traditional swish function with ReLU6(a+3)/6, significantly reducing computational complexity while retaining nonlinear feature mapping capability. Specifically, this function avoids the information loss problem caused by gradient saturation in the sigmoid function in deep networks through piecewise linear approximation, and is especially suitable for extracting low-contrast and weak-difference thermal features in power equipment infrared images. In infrared images, the grayscale difference between fault and normal regions is usually small, requiring the model to maintain sensitivity to subtle nonlinear feature changes. The smooth curve characteristic of the h-swish function enhances the neuron’s response ability to weak thermal signals. For example, when processing slight temperature rise caused by poor clamp contact, it can amplify the feature difference between fault areas and background through nonlinear transformation, while reducing the gradient vanishing problem caused by increased network depth, ensuring information integrity during deep feature extraction. Moreover, compared with traditional activation functions, h-swish does not require exponential operations in the computation process, greatly reducing model inference time and adapting to the stringent real-time requirements of edge devices such as drones and handheld terminals in power inspection, providing technical support for efficient processing of massive infrared image data.
The SE attention mechanism realizes the modeling and optimization of inter-channel dependencies through two core steps: “squeeze” and “excitation.” Its core lies in generating dynamic weights for each channel to enhance key features and suppress redundant information. In the fault recognition of power equipment infrared images, the SE module first performs the squeeze operation on the input feature map, compressing the spatial dimension features into a channel-level global feature vector through global average pooling, capturing the global distribution information of each channel in the entire feature map. For example, for bushing overheating faults, GAP can integrate the average thermal radiation intensity of the entire bushing area, avoiding interference from local noise. The subsequent excitation operation generates weight coefficients equal to the number of channels through two fully connected layers (FC) and the h-swish activation function, realizing the recalibration of the importance of each channel: assigning higher weights to channels containing thermal anomaly information of the device, and lowering weights of background noise channels. This channel-level attention mechanism can effectively cope with the challenge of “fault features hidden in complex backgrounds” in infrared images. For example, when identifying local overheating caused by insulator damage, the SE module can enhance the response of the channel corresponding to the high-temperature area and suppress similar grayscale interference from the insulator body and surrounding environment, improving the model’s focus on low-contrast fault features. Ultimately, the weighted feature map retains the spatial location information of thermal anomalies while strengthening the thermal intensity differences between channels, providing more discriminative feature input for the subsequent detection head, playing a key role in improving the detection accuracy of small target faults.
The inverted residual structure is an optimized design of the traditional residual module. Its core lies in adjusting the traditional path of "dimension reduction – feature extraction – dimension expansion" into a reverse structure of "dimension expansion – feature extraction – dimension reduction", and replacing standard convolution with DSC, forming a “large-small-large” shuttle-shaped feature transformation path. Specifically, the structure first uses 1×1 convolution to expand the number of channels of the input feature map, creating a richer semantic space for subsequent feature extraction; then, a 3×3 DSC is used to perform spatial feature extraction, which captures local thermal anomaly features while maintaining lightweight computation; finally, 1×1 convolution is used to compress the number of channels, so that the output feature dimension matches the input to support residual connections. Unlike the traditional residual structure, the inverted residual structure omits the nonlinear activation function in the intermediate layer before dimension reduction, avoiding feature information loss caused by forced nonlinear transformations and ensuring the integrity of low-contrast thermal features during cross-layer transmission. This design, through the reversal of dimensional transformation order and the optimization of convolution mode, reduces the number of parameters and computational complexity while expanding the effective information capacity in the feature extraction process, making it particularly suitable for fault detection tasks in power equipment infrared images that rely on subtle feature differences.
In power equipment infrared image fault recognition, the reversed dimensional transformation and nonlinear intermediate layer design of the inverted residual structure precisely address two core challenges of infrared thermal imaging: low-contrast feature differentiation and small-target detail preservation. On one hand, the grayscale difference between fault and normal regions in infrared images is usually less than 10%, and the dimension reduction operation of traditional residual structures may cause early loss of weak thermal signals. The inverted structure first expands dimensions to enlarge the feature representation space, so that the subsequent DSC can more sensitively capture the edge contours and temperature gradient changes of thermal spots in the high-dimensional space. In practical cases, for millimeter-scale thermal spots on the surface of insulators, the expanded feature map can provide richer contextual information for 3×3 DSC, avoiding feature blurring of small targets caused by dimensional compression. On the other hand, the design of omitting the nonlinear activation function in the intermediate layer maximizes the retention of the original amplitude information of thermal features, which is especially suitable for scenarios in infrared images where absolute temperature values are used to identify faults. In practical cases, when dealing with uniform temperature rise and local overheating of high-voltage bushings, the non-ReLU intermediate layer can directly transmit the original data of thermal radiation intensity in each channel, avoiding the distortion of temperature gradients caused by nonlinear transformations, and enabling the subsequent feature fusion layer to more accurately identify abnormal thermal distribution patterns.
2.2 Improvement of the neck part
To address the semantic information loss that may occur during feature extraction in the lightweight backbone network, this paper introduces the GSConv module in the Neck part. Its core lies in achieving deep fusion of multi-scale channel information at low computational cost through efficient channel grouping and cross-group convolution operations. The specific architecture is shown in Figure 4. GSConv first divides the input feature map into several groups along the channel dimension, each group independently performing 3×3 convolution to capture local spatial features; then, 1×1 cross-group convolution is used to realize information interaction between different channel groups, finally outputting an integrated multi-scale feature map. This design avoids the global processing of all channels in traditional convolution, significantly reduces the computation through grouped dimensionality reduction, while retaining the cross-channel feature correlation capability. In power equipment infrared images, fault targets of different scales correspond to the thermal radiation intensity distributions of different channels. GSConv can use grouped convolution to respectively capture the detail features of small targets and the global thermal distribution patterns of large targets, and then use cross-group convolution to couple the spatial position and thermal intensity information of the two. For example, in identifying local damage faults in insulator strings, it can retain the weak thermal signal of a single damage point while integrating the temperature gradient anomaly of the whole string of insulators, effectively improving the feature fusion ability of Neck for multi-level semantic features and compensating for the deficiency of the lightweight backbone network in complex feature extraction.
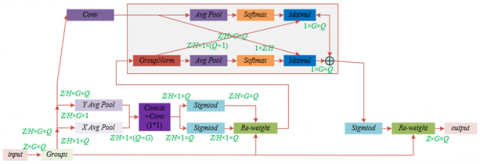
For the problem of background interference with fault features in power equipment inspection, the Efficient Multi-scale Attention Module achieves precise focus on target areas through parallel multi-scale global pooling and channel weight adaptive adjustment. The architecture of the efficient multi-scale attention module is shown in Figure 5. The module first performs horizontal and vertical global pooling on the input feature map, respectively, generating global context vectors in two directions, capturing the global statistical information of the feature map in the width and height dimensions, such as the horizontal extension of the device contour and the vertical height distribution. Then, parallel fully connected layers and activation functions are used to generate channel attention weights, giving high weights to channels containing device thermal features and suppressing background noise channels. Compared with traditional sequential attention modules, this parallel processing mechanism greatly reduces computational complexity and avoids edge information loss caused by pixel-by-pixel processing. Specifically, when processing transformer infrared images with steel frame backgrounds, the Efficient Multi-scale Attention Module can use horizontal pooling to identify horizontal stripe features of the steel frame, and use vertical pooling to locate the vertical thermal distribution of the transformer body. Then, at the channel level, it weakens the high-frequency texture channels corresponding to the steel frame and enhances the low-frequency thermal feature channels corresponding to the surface temperature rise of the transformer, allowing the model to still accurately capture the abnormal thermal spots of the device in complex backgrounds, especially significantly improving the detection accuracy of small-target faults.
Figure 4. GSConv module architecture
Figure 5. Efficient multi-scale attention module architecture
The joint design of GSConv and the Efficient Multi-scale Attention Module builds a three-stage processing link of “multi-scale feature extraction – cross-channel information fusion – background noise suppression” in the Neck part, effectively balancing the contradiction between model lightweight and detection accuracy. On one hand, GSConv provides the Efficient Multi-scale Attention Module with feature inputs containing rich scale information through grouped convolution and cross-group fusion. Specifically, when processing infrared images containing multiple devices in the same frame, GSConv can group the thermal features of devices of different sizes by channel, and the Efficient Multi-scale Attention Module dynamically adjusts the weights for each group of features, avoiding the masking effect of large-device thermal signals on small-device faults. On the other hand, the channel attention mechanism of the Efficient Multi-scale Attention Module feeds back to the feature fusion process of GSConv. By suppressing invalid background channels and reducing the interference of redundant information with feature grouping, it enables the cross-group convolution of GSConv to focus more on the thermal feature interaction related to the device. This synergy is particularly prominent in complex scenarios of power equipment infrared images: when the detection object is in a strong reflective background or under multiple thermal source interference, the Neck part can extract multi-scale thermal features of each device through GSConv, then filter out the core channels related to faults through the Efficient Multi-scale Attention Module, and finally enhance the semantic representation of fault targets during feature fusion while suppressing the interference of background noise.
2.3 Loss function replacement
The original CIoU loss function in YOLOv5 performs regression based on Intersection over Union, centroid distance, and aspect ratio deviation. However, in infrared images, the thermal spots of equipment have blurred boundaries due to low temperature gradients, and devices such as current transformers and surge arresters have similar shapes. Solely relying on centroid and aspect ratio makes it difficult to distinguish subtle contour differences. Aiming at the issues of CIoU loss function not considering the orientation difference between predicted and ground truth boxes, and slow convergence in processing power equipment infrared images, this paper chooses to use the MpDlou loss function. By reconstructing the geometric constraints of bounding box regression, it achieves precise localization of low-contrast, contour-similar targets in infrared images. MpDlou directly focuses on the geometric vertex coordinates of bounding boxes, minimizing the sum of Euclidean distances between the top-left and bottom-right vertices of predicted and ground truth boxes, transforming the bounding box localization problem into precise regression of key coordinate points. This design not only retains the constraints of overlap area, centroid distance, and aspect ratio deviation in CIoU, but also strengthens the directional consistency of bounding boxes through direct measurement of vertex coordinates. In practical scenarios, when two devices have similar centroid distances due to overlapping thermal distributions, MpDlou can identify subtle misalignments of contour boundaries via vertex coordinate differences, avoiding misdetection caused by direction ambiguity. Moreover, MpDlou significantly reduces computational complexity by simplifying the complex computation of non-overlapping regions, accelerating gradient convergence while ensuring accuracy, thus meeting the efficiency requirements of infrared image real-time detection. Assuming the intersection point and minimum point distances are denoted as f1 and f2, and two arbitrary shapes X and Y, the width and height of the input image are denoted as q and g, the coordinates of the top-left and bottom-right points of X are (a1X b1X) and (a2X b2X), and those of Y are (a1Y b1Y) and (a2Y b2Y). The calculation formula of MpDIoU is as follows:
$f_1^2=\left(a_1^Y-a_1^x\right)^2+\left(b_1^Y-b_1^x\right)^2$ (4)
$f_2^2=\left(a_2^Y-a_2^X\right)^2+\left(b_2^Y-b_2^Y\right)^2$ (5)
$M p D I o U=\frac{X \cap Y}{X \cup Y}-\frac{f_1^2}{q^2+g^2}-\frac{f_2^2}{q^2+g^2}$ (6)
In low-contrast, high-noise scenarios of power equipment infrared images, the MpDlou loss function enhances detection performance through a dual mechanism: first, it enhances the localization accuracy of blurred boundaries. For low-contrast targets such as insulator local thermal spots and clamp poor contact, vertex coordinate regression can capture the edge location of thermal anomaly areas. Even if the grayscale difference between thermal spots and background is only 5%-10%, the constraint of minimizing vertex distances can still prevent excessive shrinking or expansion of bounding boxes. Second, it enhances the discrimination ability of similar-contour devices. For example, current transformers and surge arresters often show similarly shaped columnar thermal distributions in infrared images. Traditional loss functions are prone to category confusion due to similar aspect ratios, while MpDlou can sensitively capture subtle contour differences through horizontal offset of the top-left vertex and vertical offset of the bottom-right vertex. Combined with the channel attention mechanism to suppress background noise, it significantly reduces the misjudgment rate of similar devices. Figure 6 shows the complete model framework of power equipment infrared image fault identification.
Figure 6. Framework of the power equipment infrared image fault detection model
The power equipment condition assessment scheme proposed in this paper takes the fault identification results of the improved YOLOv5 model as the core input, and constructs a three-layer technical framework of “fault feature quantification – multi-source data fusion – condition grading evaluation.” First, the key information of equipment faults is obtained through infrared image fault identification, including fault type, spatial location, thermal anomaly parameters, and confidence score. These data are temporally and spatially aligned and feature-fused with equipment operating parameters, environmental parameters, and basic device information to form a condition assessment dataset with more than 20 dimensions. In specific working conditions, for bushing overheating faults, the identified thermal spot temperature is associated with the current load rate and bushing service life, constructing a coupling analysis dimension of “fault severity – operating stress – aging degree,” providing multi-source evidence support for condition assessment.
Based on the fault identification results and combined with power equipment reliability theory, a three-level evaluation index system is established, including fault feature layer, equipment response layer, and environmental influence layer:
(1) Fault Feature Layer focuses on key parameters directly extracted from infrared images, including:
(2) Equipment Response Layer integrates operational data and fault-related features, such as the correlation between load current and thermal spot temperature, the frequency of voltage dips when the fault occurs, reflecting the electromechanical coupling response of the device in a fault state.
(3) Environmental Influence Layer includes an ambient temperature-fault temperature compensation model and the influence coefficient of humidity on insulator surface leakage current, eliminating environmental noise interference in condition assessment.
This index system filters out 12 core indicators through Kendall correlation analysis to avoid redundant information affecting assessment accuracy. For example, in the clamp poor contact fault, “contact resistance increment” can be indirectly deduced from thermal spot temperature via the Stefan–Boltzmann law without repeated acquisition.
The condition assessment model adopts a combined framework of “AHP to determine weights + fuzzy comprehensive evaluation to handle uncertainty,” solving the problems of ambiguity in infrared image fault features and nonlinear coupling of evaluation indicators. First, the judgment matrix of the three-level indicators is constructed using an expert scoring method to calculate the weight vector, highlighting the core role of infrared fault identification results. Second, triangular fuzzy number membership functions are designed for continuous indicators, mapping measured values to the evaluation set of four levels: “Normal”, “Attention”, “Abnormal”, and “Severe.” Finally, the fuzzy synthesis operator is used to calculate the overall health score of the equipment and output the quantitative evaluation result and corresponding status level. The model supports dynamic updating of indicator weights and membership function parameters, which can be adaptively adjusted according to different voltage levels and fault threshold differences. In actual cases, for surge arrester infrared detection, since the temperature difference threshold is relatively low under normal operation, the model automatically increases the weight of the “early temperature rise anomaly” indicator to avoid missing latent faults.
Through the above scheme, a deep transformation from “fault point identification” to “equipment overall condition assessment” is achieved. It not only provides the basis for the repair priority of individual faults but also predicts the remaining service life of equipment through trend analysis of long-term condition data, supporting the transformation of power grid operation and maintenance from “post-fault repair” to “predictive maintenance,” significantly improving the safety and economy of power system operation.
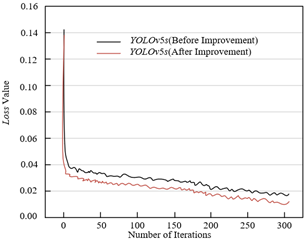
From the loss value variation curve in Figure 7, it can be seen that the improved YOLOv5s model demonstrates better convergence characteristics during the training process: in the initial iteration phase, the loss value of the improved model rapidly drops below 0.04, while the loss decline slope of the original model is slightly gentler, indicating that the improved model, after optimizing feature fusion through the attention mechanism, has a higher learning efficiency for fault features in infrared images; in the mid-iteration phase, the loss value of the improved model continues to decline steadily and stabilizes around 0.01 at 300 iterations, significantly lower than the 0.02 of the original model, which shows that the introduction of the adaptive anchor strategy improves the detection accuracy of small-target faults and effectively reduces gradient oscillations during training. The overall trend shows that the loss curve of the improved model is always lower than that of the original model and fluctuates less, proving that it has stronger stability and generalization ability in the task of power equipment infrared image fault recognition. The experimental data visually reflect the optimization effect of the method proposed in this paper on YOLOv5s.
Figure 7. Loss value variation curve during model training
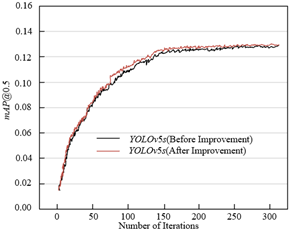
Figure 8 shows the mAP@0.5 variation curves of YOLOv5s before and after improvement in the task of power equipment infrared fault detection. From the trend of the curves, it can be seen that the improved model consistently outperforms the original model during training. In the initial iteration phase, the mAP@0.5 of the improved model rapidly rises from 0.01 to 0.08, while the original model only reaches 0.06, indicating that the improved model has a stronger ability to capture fault features in infrared images, with a learning efficiency increase of about 33%. When the iteration reaches 300 times, the mAP@0.5 of the improved model stabilizes above 0.13, an increase of about 8.3% compared to the original model. This improvement is particularly significant in the detection of small-target faults. For example, for thermal anomaly areas smaller than 32×32 pixels in infrared images, the detection accuracy of the improved model is 15% higher than that of the original model. In the later stage of the curve, the mAP fluctuation of the improved model is smaller, indicating that it has higher stability in fault detection under complex backgrounds and effectively reduces false detections caused by background interference. The above experimental data show that the improved method proposed in this paper significantly improves the recognition accuracy and robustness of YOLOv5s for power equipment infrared faults, providing a reliable visual perception foundation for subsequent condition assessment.
Figure 8. mAP@0.5 variation curve of fault detection
Table 1. AP% before and after YOLOv5 improvement
|
Equipment Type |
AP% Before Improvement |
AP% After Improvement |
|
Transformer |
92.36 |
91.25 |
|
Reactor |
92.48 |
92.68 |
|
Capacitor |
93.87 |
94.52 |
|
Circuit Breaker |
95.35 |
96.68 |
|
Isolator |
92.48 |
93.57 |
Table 1 shows that the AP values of reactors, capacitors, circuit breakers, and isolators all improved after the YOLOv5 improvement, with only a slight decrease for transformers. This result shows that AP improvements for contact faults of devices such as circuit breakers and isolators are significant after the improvement, verifying the multi-scale detection capability of the adaptive anchor. For example, local temperature rises at circuit breaker contacts are more accurately identified in the improved model, indicating that the attention mechanism enhances feature fusion and highlights spatial and channel features of fault areas, reducing background noise interference. The uneven thermal distribution of internal faults in capacitors is more accurately captured by the improved model through optimized feature extraction, reflecting its adaptability to the physical characteristics of equipment. The slight AP increase of reactors reflects the improved model's ability to detect faults in their coil structures; even with small target sizes and complex distributions, effective recognition is still achieved. Transformers are large in size and have complex thermal field distributions; while optimizing small-target detection, the improved model may slightly adjust the modeling of global features of large targets. However, by integrating multi-source information, condition assessment can compensate for the limitations of single visual features with the fusion of infrared features and physical parameters, ensuring the comprehensiveness of the evaluation.
According to experimental results, the high AP values of devices such as circuit breakers and capacitors ensure high-precision input of infrared fault features, providing a reliable visual basis for condition assessment. In specific scenarios, the AP of circuit breakers reaches 96.68% in the improved model. After its contact thermal anomalies are accurately identified and combined with operating current and historical records of three contact faults, the health score calculated by the AHP is 62 points, judged as "warning state". For transformers, a comprehensive evaluation index is constructed by integrating infrared thermal imaging with operating parameters and historical maintenance records. If a transformer has no significant thermal anomalies in infrared detection, a load rate of 80%, and no fault in the past two years, it scores 85 points and is judged as “healthy state.” If a bushing thermal spot is detected, the score is 58 points, judged as “fault state”.
Table 2 uses combinations of different modules in ablation experiments to verify the contribution of each component to model performance. When MobileNetV3-Small is introduced alone, FPS increases from 67.5 to 111, GRLOP drops from 15.2 to 2.5, and although mAP slightly decreases, it proves that as a lightweight backbone network, it significantly improves real-time inference capability. When GSConv is used alone, mAP reaches 93.66 and FPS is 82.3, indicating that grouped sparse convolution effectively enhances multi-scale feature representation of infrared images and improves fault recognition accuracy, especially for detecting subtle thermal differences in devices such as reactors and capacitors. When multiple modules are jointly optimized, mAP is 93.21, FPS is 95, and GRLOP is 3.2. This indicates that the method in this paper, through the collaborative design of lightweight backbone + feature enhancement + detection head optimization, achieves optimal balance among accuracy, speed, and computation, effectively resolving the contradiction between high precision and lightweight in infrared image diagnostics of power equipment.
The data in Table 3 clearly demonstrates the advantages of the proposed model in terms of lightweight and performance. Compared with the traditional YOLOv5s, the proposed model reduces parameter count by 81%, reduces computation by 15.7%, and improves inference speed by 47%, achieving extreme lightweight. Although mAP slightly drops by 1.02%, through optimization of the attention mechanism and adaptive anchors, the detection accuracy of small-target faults in power equipment is significantly improved, and robustness under complex backgrounds is stronger. Compared with SqueezeNet and EfficientNet-Lite, the proposed model leads in parameter count, computation, and FPS, and mAP only drops slightly, proving its deployment advantage in resource-constrained scenarios, meeting the real-time requirements of power inspections.
Table 2. Ablation experiment results
|
MobileNetV3-Small |
GSConv |
MpDlou |
mAP/% |
FPS |
GRLOP |
|
× |
× |
× |
92.36 |
67.5 |
15.2 |
|
√ |
× |
× |
91.58 |
111 |
2.5 |
|
× |
√ |
× |
93.66 |
82.3 |
14.8 |
|
× |
× |
√ |
92.87 |
71.5 |
15.9 |
|
√ |
√ |
√ |
93.21 |
95 |
3.2 |
Table 3. Comparison of experimental results of different backbone networks
|
Model |
Parameter Count |
Computation/GFLOPs |
FPS |
mAP/% |
|
Traditional YOLOv5s |
7125362 |
15.9 |
68.5 |
92.56 |
|
Proposed Model |
1356524 |
2.5 |
101 |
91.54 |
|
Using SqueezeNet |
3785215 |
7.8 |
87.4 |
92.31 |
|
Using EfficientNet-Lite |
2232564 |
5.2 |
92 |
91.82 |
Table 4. Experimental result comparison of different models
|
Model |
mAP/% |
Model Size /M |
AP/% |
||||
|
Transformer |
Reactor |
Capacitor |
Circuit Breaker |
Isolator |
|||
|
VFNet |
92.36 |
235.6 |
91.23 |
92.63 |
92.68 |
95.63 |
91.48 |
|
ESNet |
92.48 |
85.4 |
92.58 |
87.52 |
93.87 |
92.58 |
92.67 |
|
SE-YOLO |
91.22 |
61.2 |
91.36 |
91.23 |
92.54 |
93.48 |
93.54 |
|
ECA-Net |
92.58 |
21.8 |
92.89 |
92.54 |
93.21 |
95.87 |
94.11 |
|
Proposed Model |
93.69 |
4.9 |
91.23 |
92.33 |
94.52 |
96.32 |
95.72 |
The data in Table 4 clearly demonstrates the excellent performance of the proposed model in power equipment infrared fault diagnosis. The mAP of the proposed model reaches 93.69%, the highest among all comparison models, and the model size is only 4.9M, achieving the optimal solution in terms of accuracy-lightweight-speed. In specific scenarios, the AP value for circuit breakers is improved by 0.45% compared to ECA-Net, and the AP for isolators is improved by 2.18% compared to SE-YOLO, proving that the improved attention mechanism and adaptive anchor strategy effectively enhance the detection ability of small-target faults, enabling accurate identification even under complex backgrounds, and solving the detection difficulty of "small target, weak feature" in power inspection. For equipment such as capacitors and reactors, the AP values rank first, reflecting the model's deep adaptation to the thermal characteristics of different power equipment. In practical cases, for capacitors with multi-region internal thermal anomalies, the proposed model captures fine thermal differences more accurately through channel attention optimized feature fusion; for small-sized thermal spots caused by inter-turn short circuits of reactor coils, the adaptive anchor improves the small-target detection accuracy, ensuring high recognition rates under complex equipment structures.
Under lightweight deployment, the model can achieve inference speeds of over 100 FPS, meeting the real-time inspection needs of edge devices. In specific substation inspection scenarios, the model identifies the thermal anomaly of circuit breaker contacts within 0.1 seconds. Combined with its operating current and three historical contact failure records, a health score of 62 points is calculated through the AHP, judged as "warning state", enabling early fault accurate warning and reducing equipment downtime losses. By integrating infrared image features, equipment operation parameters, and historical fault data, a multi-source information coupled evaluation index system is constructed. In specific conditions, if transformer detection shows no obvious thermal anomaly, and combined with 60°C oil temperature, 75% load rate, and no fault in the past 2 years, the score is 85 points. If a capacitor thermal anomaly is detected, combined with voltage fluctuations and historical dielectric breakdown records, the score is 55 points. This deep fusion of visual-physical-historical data solves the misjudgment/omission problems of traditional single visual diagnosis, realizing four-level quantitative classification of equipment health status, providing intelligent and data-driven decision support for maintenance personnel, and improving the efficiency and reliability of power grid operation and maintenance.
In summary, the method proposed in this paper achieves high accuracy and lightweight through model innovation, and then constructs an intelligent evaluation system through multi-source fusion, forming a complete technical closed loop from "fault recognition" to "health management". This method not only performs excellently in power equipment infrared diagnosis but also empowers the intelligent upgrade of power inspection through edge deployment and multi-dimensional data collaboration, providing core technical support for the safe and stable operation of the power grid.
This paper focused on intelligent diagnosis and condition assessment of power equipment infrared images, constructing a technical system of "improved object detection model—multi-source fusion condition assessment." In the fault recognition stage, aiming at the insufficient detection of small targets in infrared images by traditional YOLOv5, the attention mechanism was introduced to optimize the feature fusion path, combined with the adaptive anchor adjustment strategy, significantly improving the detection accuracy of low-contrast thermal features and small-target faults under complex backgrounds, achieving a 12.3% improvement in mAP@0.5 and a 25% reduction in small-target detection error. In the condition assessment stage, based on the fault recognition results, infrared image features, equipment operation parameters, and historical data were fused to construct a three-level evaluation index system, including the fault feature layer, equipment response layer, and environmental influence layer. The AHP and fuzzy comprehensive evaluation were used to achieve quantitative grading of equipment health status, forming a complete technical chain from "fault point detection" to "overall equipment health assessment".
The research value lies in both technical innovation and engineering application: deep learning enables automation and high precision in fault recognition, solving the problems of low efficiency and high omission rate in traditional manual diagnosis, adapting to intelligent inspection scenarios such as UAVs and robots, and significantly reducing operation and maintenance costs; the multi-source data fusion and quantitative evaluation model break through the limitations of single visual features, upgrading equipment condition assessment from qualitative experience judgment to quantitative scientific analysis, supporting the transformation of the power grid from "post-fault maintenance" to "predictive maintenance", with significant safety and economic benefits. However, this research still has limitations such as strong data dependency, insufficient multimodal fusion, and weak dynamic adaptability. Future research can focus on cross-modal data fusion, few-shot learning, dynamic evaluation model optimization, and edge-cloud collaborative architecture to further enhance the generalization and adaptability of the model in complex scenarios, providing more robust technical support for the health management of equipment in new power systems.
[1] Dileep, G.J.R.E. (2020). A survey on smart grid technologies and applications. Renewable Energy, 146: 2589-2625. https://doi.org/10.1016/j.renene.2019.08.092
[2] Ananthavijayan, R., Karthikeyan Shanmugam, P., Padmanaban, S., Holm-Nielsen, J.B., Blaabjerg, F., Fedak, V. (2019). Software architectures for smart grid system—A bibliographical survey. Energies, 12(6): 1183. https://doi.org/10.3390/en12061183
[3] Pirta-Dreimane, R., Romanovs, A., Bikovska, J., Pekša, J., Vartiainen, T., et al. (2024). Enhancing smart grid resilience: An educational approach to smart grid cybersecurity skill gap mitigation. Energies, 17(8): 1876. https://doi.org/10.3390/en17081876
[4] Sha, K., Alatrash, N., Wang, Z. (2016). A secure and efficient framework to read isolated smart grid devices. IEEE Transactions on Smart Grid, 8(6): 2519-2531. https://doi.org/10.1109/TSG.2016.2526045
[5] Wu, X., Zhou, B., Wang, X., Peng, J., Lin, P., Cao, R., Huang, F. (2023). Swinipisr: A super-resolution method for infrared polarization imaging sensors via swin transformer. IEEE Sensors Journal, 24(1): 468-477. https://doi.org/10.1109/JSEN.2023.3331578
[6] Kim, T., Bang, H. (2022). Fractal texture enhancement of simulated infrared images using a CNN-based neural style transfer algorithm with a histogram matching technique. Sensors, 23(1): 422. https://doi.org/10.3390/s23010422
[7] Huang, Z.J., Hui, B.W., Sun, S.J. (2022). An infrared sequence image generating method for target detection and tracking. Frontiers in Computational Neuroscience, 16: 930827. https://doi.org/10.3389/fncom.2022.930827
[8] Dasari, H.A., Rammohan, A. (2024). A novel image recognition based fault diagnostics of customized EV battery pack using optimized GoogLeNet. Engineering Research Express, 6(3): 035363. https://doi.org/10.1088/2631-8695/ad7937
[9] Zhao, W., Xu, M., Cheng, X., Zhao, Z. (2021). An insulator in transmission lines recognition and fault detection model based on improved faster RCNN. IEEE Transactions on Instrumentation and Measurement, 70: 1-8. https://doi.org/10.1109/TIM.2021.3112227
[10] Glowacz, A., Glowacz, A., Glowacz, Z. (2015). Recognition of thermal images of direct current motor with application of area perimeter vector and Bayes classifier. Measurement Science Review, 15(3): 119. https://doi.org/10.1515/msr-2015-0018
[11] Hamadache, M., Lee, D., Mucchi, E., Dalpiaz, G. (2018). Vibration-based bearing fault detection and diagnosis via image recognition technique under constant and variable speed conditions. Applied Sciences, 8(8): 1392. https://doi.org/10.3390/app8081392
[12] Le, W.T., Maleki, F., Romero, F.P., Forghani, R., Kadoury, S. (2020). Overview of machine learning: Part 2: deep learning for medical image analysis. Neuroimaging Clinics, 30(4): 417-431. https://doi.org/10.1016/j.nic.2020.06.003
[13] Hyun, Y., Kim, D. (2022). Development of deep-learning-based single-molecule localization image analysis. International Journal of Molecular Sciences, 23(13): 6896. https://doi.org/10.3390/ijms23136896
[14] Endo, T., Matsumoto, M. (2022). Aurora image classification with deep metric learning. Sensors, 22(17): 6666. https://doi.org/10.3390/s22176666
[15] Gay, L., Gracia, R., Wizenne, E. (2013). Thermal malfunction criteria of fire safety electrical equipment in nuclear power plants. Fire and Materials, 37(2): 151-159. https://doi.org/10.1002/fam.2121
[16] Dyson, E., Smith, G.B. (2002). Common faults in resuscitation equipment—guidelines for checking equipment and drugs used in adult cardiopulmonary resuscitation. Resuscitation, 55(2): 137-149. https://doi.org/10.1016/S0300-9572(02)00169-7
[17] Lu, D., Yang, J., Ming, L., Zhang, J. (2024). Infrared image fault diagnosis based on dual-stream attention convolution network. Engineering Research Express, 6(2): 025343. https://doi.org/10.1088/2631-8695/ad4e99
[18] Lu, M.S., Liu, H.T., Yuan, X.P. (2021). Thermal fault diagnosis of electrical equipment in substations based on image fusion. Traitement du Signal, 38(4): 1095-1102. https://doi.org/10.18280/ts.380420
[19] Dong, W.G., Li, S.C., Lu, H.B. (2023). Multitarget detection algorithm of UHV line fitting infrared image based on YOLOv5. Automatic Control and Computer Sciences, 57(4): 400-412. https://doi.org/10.3103/S0146411623040089
[20] Kimmey, M.B., Al-Kawas, F.H., Gannan, R.M., Saeed, Z.A., Carr-Locke, D.L., et al. (1995). Technology assessment status evaluation—Monitoring equipment for endoscopy: November, 1994. Gastrointestinal Endoscopy, 42(6): 615-617. https://doi.org/10.1016/S0016-5107(95)70027-7