Yuting Feng*![]() | Duanduan Tang
| Duanduan Tang![]() | Junhua Shi
| Junhua Shi![]() | Boyuan Zhang
| Boyuan Zhang![]() | Zeyu Xia
| Zeyu Xia![]()
© 2025 The authors. This article is published by IIETA and is licensed under the CC BY 4.0 license (http://creativecommons.org/licenses/by/4.0/).
OPEN ACCESS
With the rapid development of information technology, complex networks are increasingly vulnerable to abnormal behaviors such as malicious attacks and data breaches due to their growing scale and structural complexity. Traditional detection methods often struggle in dynamic network environments due to insufficient utilization of temporal features and lack of protocol evolution analysis, resulting in suboptimal detection accuracy. Existing studies based on conventional machine learning typically ignore the temporal characteristics of network behaviors and the evolutionary nature of protocols. Similarly, image processing techniques alone fail to incorporate protocol-level information, while static protocol models cannot adapt to dynamically changing scenarios, leading to incomplete extraction of essential features of anomalous behaviors. To address these challenges, this paper proposes a novel detection method that integrates image processing with protocol evolution modeling. The main contributions are as follows: (1) A method for visual mapping of temporal network behaviors is designed, converting dynamic behaviors into interpretable image features; (2) A protocol evolution prediction model is constructed, combining time series analysis with machine learning techniques to capture the dynamics of protocol changes; (3) A multimodal behavior recognition model is developed, integrating image features with protocol evolution features to accurately detect anomalous behaviors. By leveraging cross-disciplinary techniques, this study overcomes the limitations of existing approaches in temporal feature utilization, dynamic protocol modeling, and multimodal data fusion. It offers a novel framework that supports both visual analysis and dynamic mechanism modeling, contributing to improved accuracy and robustness in detecting anomalous behaviors in complex networks.
complex networks, anomalous behavior detection, image processing, protocol evolution modeling, multimodal fusion
With the rapid development of information technology, complex networks, as an important carrier for information transmission, interaction, and storage [1-3], are widely applied in various fields such as social networking, finance, and communication [4-6]. As the scale of networks continues to expand and their structures become increasingly complex, abnormal behaviors such as malicious attacks, data leakage, and traffic anomalies frequently occur, posing serious threats to the security, stability, and reliability of networks [7-10]. Traditional network anomaly detection methods gradually expose problems such as low recognition accuracy and poor real-time performance when facing dynamically changing network environments and complex diverse abnormal behaviors [11, 12]. Image processing technology can transform network behavior data into intuitive image forms, which is convenient for mining hidden features and patterns behind the data [13, 14]; while protocol dynamic evolution modeling can effectively describe and analyze the dynamic changes of network protocols during operation [15, 16]. Therefore, studying complex network anomaly detection methods by combining image processing and protocol dynamic evolution modeling has important practical demand.
Accurate detection of abnormal behaviors in complex networks is crucial for ensuring network security, protecting user rights, and promoting the healthy development of networks. Through image processing technology, network temporal behaviors can be transformed into image features, providing a new perspective for intuitive analysis of abnormal behaviors; protocol dynamic evolution modeling can capture the evolution patterns of network protocols at different stages, which helps to deeply understand the internal mechanisms of network behaviors. The combination of the two can not only improve the accuracy and efficiency of complex network anomaly detection but also provide a more scientific basis for the formulation of network security protection strategies, effectively respond to increasingly complex network security threats, and has important theoretical and practical value.
At present, research on complex network anomaly detection has achieved certain results. Some scholars have used traditional machine learning methods, such as support vector machines, neural networks, etc. [17, 18], to classify and identify network behavior data, but these methods often ignore the temporal characteristics of network behaviors and the protocol dynamic evolution process, resulting in insufficient ability to detect dynamically changing abnormal behaviors. Some studies adopt a single image processing technique to visualize network traffic data [19, 20], but fail to sufficiently integrate protocol-level information, making the extraction of essential features of abnormal behaviors not deep enough. In addition, most existing protocol modeling methods focus on static protocol analysis, lacking effective modeling of the protocol dynamic evolution process, and are difficult to adapt to the dynamic changes of protocols in complex network environments.
This paper mainly conducts research in the following three aspects: first, visualization of network temporal behavior features, through designing a reasonable image mapping method, transforming network temporal behavior data into images with rich features, providing an intuitive visual representation for subsequent abnormal behavior analysis; second, protocol dynamic evolution prediction model, combining time series analysis and machine learning technology to construct a model that can accurately predict the trend of protocol dynamic evolution, providing support for early warning of abnormal behaviors; third, multimodal behavior detection under the background of complex networks, integrating image features and protocol dynamic evolution features to establish a multimodal detection model to achieve accurate detection of abnormal behaviors in complex networks. The research value of this paper lies in proposing a complex network anomaly detection method that combines image processing and protocol dynamic evolution modeling, which makes up for the deficiencies of existing methods in temporal feature utilization, protocol dynamic analysis, and multimodal fusion. By combining the image features of network behaviors with the protocol dynamic evolution features, it can more comprehensively describe the essential characteristics of network behaviors, improve the accuracy and robustness of anomaly detection, and provide new ideas and methods for the security protection of complex networks.
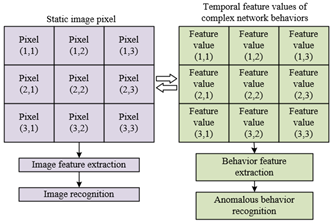
This paper, targeting the characteristics of complex network temporal behavior data such as high dimensionality, dynamic nature, and strong feature correlation, adopts the Fast Correlation-Based Filter with Maximal Information Coefficient (FCBF-MIC) method for feature selection and visualization expression. Specifically, the FCBF-MIC method is first used to analyze the correlation and redundancy of massive temporal behavior features, removing redundant features and retaining core features highly relevant to anomaly detection. This constructs an optimal feature set that includes temporal dynamic patterns and key behavior modes, solving the problems of computational complexity and information interference caused by high-dimensional data. On this basis, a suitable feature visualization mapping method is designed, which structurally arranges the filtered one-dimensional temporal feature sequences in temporal or spatial dimensions and transforms them into two-dimensional image matrices with local spatial correlation. This allows the temporal features, originally suitable for one-dimensional data, to be presented in image form, thereby overcoming the limitations of two-dimensional convolutional neural networks in extracting features from one-dimensional data. Through visual representation, the implicit associations between features are enhanced, providing more efficient and intuitive input information for subsequent deep feature extraction based on convolutional neural networks, enabling effective cross-modal transformation from temporal data to image features and laying the foundation for accurate identification of abnormal behaviors in complex networks.
2.1 FCBF-MIC two-stage feature selection algorithm
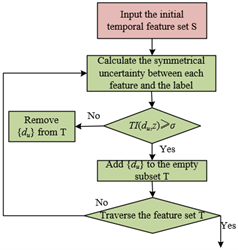
This paper uses the FCBF-MIC two-stage feature selection algorithm to select temporal behavior features in complex networks, optimizing and refining the feature set through staged filtering. The first stage focuses on correlation analysis, using symmetrical uncertainty TI as the measurement metric to calculate the correlation degree between each feature du in the temporal feature set S and the target class z. Features with TI(du,z)<σ are filtered out by setting a threshold σ. Assuming that the information entropy of feature du and label z are represented by G(du) and G(z), the calculation formula is as follows:
$T I\left(d_u, z\right)=2\left[\frac{M I C\left(d_u, z\right)}{G\left(d_u\right)+G(z)}\right]$ (1)
Through the above operation, redundant information with low contribution to anomaly detection can be removed, reducing the data scale for subsequent processing and avoiding interference of invalid features in the image mapping process caused by high-dimensional data. Periodic normal fluctuation features in network traffic or isolated parameters unrelated to protocols may be deleted first due to TI values below the threshold, thereby retaining the core temporal features highly correlated with abnormal behaviors to form an initial temporal feature subset T, providing a cleaner input data source for subsequent image mapping. Figure 1 shows the process of correlation analysis.
Figure 1. Correlation analysis process
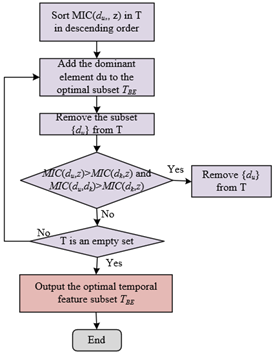
The second stage conducts redundancy analysis based on the MIC, by calculating the MIC(du, z) at different time components and the MIC(du, dk) between features to further remove redundant features and construct an optimal feature set. Specifically, the results of MIC(du, z) are first sorted in descending order to clarify the priority of feature relevance to the target class, and then approximate Markov blanket conditions are applied. When MIC(du, z) > MIC(dk, z) and MIC(du, dk) > MIC(dk, z), feature dk is determined to be a redundant feature and deleted. This process ensures that the retained features are not only highly relevant to abnormal behaviors but also have low mutual information overlap, thereby preserving independent and complementary dynamic features in the temporal data to the greatest extent. For example, in the temporal parameters of network protocol interactions, this step can remove duplicate features caused by protocol state transition rules and retain differentiated features that reflect key nodes of protocol evolution. The final optimal temporal feature subset TBE contains both the core dynamic patterns of temporal behavior and low redundancy feature independence, laying a foundation for mapping one-dimensional temporal features into two-dimensional image matrices. This allows the visualization process to more accurately capture the spatiotemporal correlation between features. Figure 2 shows the process of redundancy analysis.
Figure 2. Redundancy analysis process
2.2 Construction of temporal feature grayscale image
The core principle of constructing grayscale images of complex network temporal behavior features in this paper lies in transforming the one-dimensional temporal features filtered by the FCBF-MIC method into two-dimensional grayscale matrices containing spatiotemporal correlations through factor reconstruction and image enhancement techniques, so as to adapt to the feature extraction mechanism of two-dimensional convolutional neural networks. First, based on the optimal temporal feature subset TBE, the one-dimensional feature matrix Ds, which changes over time, is normalized to eliminate the influence of dimensional differences among different features and ensure the consistency of subsequent image reconstruction. Assuming that the column vector in Ds is denoted by a, the normalized data is denoted by a*, the maximum value in the input data is aMAX, and the minimum value is aMIN, the normalization process is given by the following formula:
$A^*=\frac{A-A_{M I N}}{A_{M A X}-A_{M I N}}$ (2)
On this basis, a structured reorganization of the one-dimensional feature sequence is performed using the factor reconstruction method: all factor sets J of a positive integer v are enumerated, and the optimal combination JBE with the smallest sum of factors is selected as the reconstruction dimension. The one-dimensional features are filled into a gj×ej two-dimensional matrix in time order, forming a quasi-square arrangement grayscale image. This reconstruction method not only retains the temporal sequence property of the features but also endows local spatial correlation to the feature space through the row-column structure of the matrix, transforming the originally independent one-dimensional features into a set of pixel points with spatial positional relationships on a two-dimensional plane. This provides a visual basis for the convolutional neural network to capture implicit correlations among features. The grayscale matrix reconstructed from Js is finally represented as:
$D_s^*=255 \times\left\{\begin{array}{ccc}d_{1(s)} & \cdots & d_{v_j(s)} \\ \vdots & \ddots & \vdots \\ d_{g_j(s)} & \cdots & d_{v(s)}\end{array}\right\}(v \leq l)$ (3)
To address the potential insufficiency in expressing feature correlations in the grayscale images after factor reconstruction, this paper further proposes the MIC-gamma image enhancement method. Traditional gamma transformation improves image contrast by adjusting a nonlinear curve but does not consider the actual correlation among temporal features. This paper introduces the MIC into the gamma transformation, quantifying the dependency among features through MIC values and dynamically adjusting the gamma coefficient, so that the grayscale values reflect not only the temporal variation of individual features but also the strength of correlation among different features in the spatiotemporal dimension. Specifically, for each pixel in the reconstructed grayscale matrix, the grayscale mapping curve is adaptively adjusted according to the MIC value between its corresponding feature and other features, enhancing grayscale differences in high-correlation regions and weakening the interference in low-correlation regions. Figure 3 shows the similarity between pixels and feature values. Assuming the matrix elements are represented by X, user-defined constants by ε and h, the grayscale image is represented as:
$F(X)=h \cdot\left(M I C\left(d_u, z\right) \cdot X\right)^{\varepsilon}$ (4)
The above enhancement method can more accurately portray the dynamic coupling relationships among features in complex network temporal behaviors, so that the grayscale image not only retains the original temporal information but also highlights key correlated features for anomaly detection, providing more discriminative input data for subsequent deep feature extraction based on two-dimensional convolution, thereby improving the performance of the complex network anomaly behavior recognition model.
Figure 3. Similarity between pixel and feature values
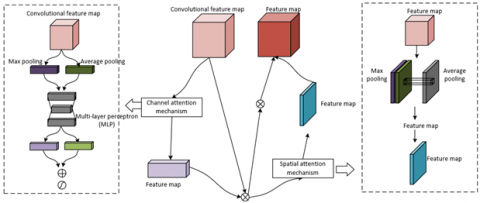
This paper constructs a Convolutional Block Attention Module – Convolutional Neural Network – Double Bidirectional Gated Recurrent Unit – Multi-Task Learning (CBAM-CNN-DBiGRU-MTL) network based on a multi-task learning framework as the protocol dynamic evolution prediction model. Among them, the CBAM-CNN module combines CNN and CBAM to achieve efficient extraction of spatiotemporal features and key information focus in the process of protocol dynamic evolution, meeting the research goal of the "protocol dynamic evolution prediction model" in capturing protocol temporal dependencies and feature importance.
This module first uses the multi-layer convolutional kernels of CNN to extract local spatial features of protocol interaction data, converting the protocol state sequence into feature maps with hierarchical semantics, capturing spatial associations and pattern features among protocol fields. On this basis, the CBAM attention mechanism is embedded: the channel attention sub-module calculates the importance weights of each feature channel, suppresses redundant channels unrelated to protocol evolution, and enhances key channels carrying dynamic evolution information. Meanwhile, the spatial attention sub-module focuses on the spatial positions in the feature map that reflect key interaction nodes of the protocol, forming an enhanced feature representation that fuses channel and spatial dimension attention. Figure 4 shows the schematic structure of CBAM. Specifically, let the feature map extracted by the 2D convolutional layer be D; the channel attention feature map is denoted by LZ(D), and the spatial attention feature map by LT(D'). The output feature map D'' is obtained by element-wise multiplication of LT(D') and D'. Assuming the Sigmoid function is represented by δ, the multi-layer perceptron weights by Q0 and Q1, the 7×7 convolution layer by d7×7, and element-wise multiplication by ⊗, the whole process is expressed as:
$\begin{aligned} & L_Z\left(D^{\prime}\right)=\delta(M L P(\operatorname{Avgpool}(D)+\operatorname{MAXpool}(D)))= \delta\left(Q_1\left(Q_0\left(D_{A V G}^Z\right)+Q_1\left(Q_0\left(D_{M A X}^Z\right)\right)\right)\right)\end{aligned}$ (5)
$\begin{aligned} & L_T\left(D^{\prime}\right)=\delta\left(d^{7 \times 7}\left(\left[\operatorname{MAXpool}\left(D^{\prime}\right) ; \operatorname{Avgpool}\left(D^{\prime \prime}\right)\right]\right)\right)= \delta\left(d^{7 \times 7}\left(\left[D_{M A X}^T ; D_{A V G}^T\right]\right)\right)\end{aligned}$ (6)
$D^{\prime \prime}=L_T\left(D^{\prime}\right) \otimes D^{\prime}$ (7)
Figure 4. Schematic diagram of CBAM structure
This enhanced feature representation mechanism, which fuses channel and spatial dimensional attention, enables the CBAM-CNN module to adaptively filter the core evolution features in protocol dynamic data, effectively highlighting key patterns of protocol state transitions and potential clues of abnormal behaviors, providing highly discriminative feature inputs for the subsequent DBiGRU module to capture long-term temporal dependencies of protocol evolution.
The DBiGRU module in the model serves as the core temporal feature processing unit of the protocol dynamic evolution prediction model. Its fundamental principle is to capture the forward and backward dependencies of temporal features in the protocol interaction process through a bidirectional gated recurrent mechanism and enhance the modeling ability for protocol dynamic evolution patterns under the multi-task learning framework. This module consists of forward and backward BiGRU network layers, which respectively start from the beginning and end of the protocol temporal data and perform bidirectional traversal on the enhanced feature sequences extracted by the CBAM-CNN module, so that the protocol state feature at each time step can integrate both past and future contextual information, effectively capturing the long-term dependencies and short-term fluctuation patterns of state transitions in protocol evolution. Through the adaptive adjustment of gate units, DBiGRU can dynamically filter historical information critical to protocol evolution prediction and suppress interference from irrelevant noise, such as enhancing memory weights of corresponding features at key time points of protocol version upgrades or abnormal interactions. Specifically, assuming the Sigmoid function is denoted as δ, the weight matrices of the update gate, reset gate, and candidate hidden state are represented by Qc, Qe, and Q, the computation formulas for each gate unit in the GRU are as follows:
$c_s=\delta\left(Q_c \cdot\left[g_{s-1}, a_s\right]\right)$ (8)
$e_s=\delta\left(Q_e \cdot\left[g_{s-1}, a_s\right]\right)$ (9)
$\widetilde{g}_s=\tanh \left(Q_z \cdot\left[e_s \cdot g_{s-1}, a_s\right]\right)$ (10)
$g_s=\left(1-c_s\right) \times g_{s-1}+c_s \times \widetilde{g}_s$ (11)
Assuming that at time step s, the outputs of the forward GRU network, the backward GRU network, and the bidirectional GRU network in the η-th hidden layer are denoted as xPOη,s, xREη,s, and xJOη,s respectively, and the number of hidden layers is n, then the outputs of each hidden layer of the DBiGRU network are obtained by combining the outputs of the forward and backward GRU neural networks, with the specific expression as:
$x_{\eta, s}^{J O}=\left[x_{\eta, s}^{P O}, x_{\eta, s}^{R E}\right] \eta \in[1, n]$ (12)
The CBAM-CNN-DBiGRU-MTL protocol dynamic evolution prediction model constructed in this paper is based on the core principle of integrating image-based feature representation and temporal dynamic modeling through a multi-task learning framework, aiming to deeply explore the evolution patterns of complex network protocols. The model uses the CBAM-CNN module as the front-end feature extractor. The temporally featured grayscale images that have been filtered by FCBF-MIC and transformed into image format are input into the model. The convolutional neural network is used to capture spatial feature patterns in protocol interactions, and the CBAM attention mechanism is used to adaptively enhance the feature expression of key protocol fields while suppressing the interference of redundant information. Then, the DBiGRU module performs bidirectional temporal modeling on the extracted spatial feature sequences. Through the gated recurrent unit, it captures the forward and backward dependencies of protocol state transitions, retaining the influence of historical interaction information on the current state while incorporating the constraints of future context on the current state, forming a temporally aware representation of the protocol evolution process. This design enables the model to process both the spatial correlation and temporal dynamics of protocol features simultaneously, which aligns with the actual characteristics of protocol operation in complex network environments. In this paper, three typical types of grayscale images of network abnormal behavior features are used as model inputs according to the spatial mapping patterns of temporal features in grayscale images, the visualization expression intensity of protocol dynamic features, and the semantic correlation characteristics of abnormal behaviors: temporal mutation-type grayscale image, protocol deviation-type grayscale image, and multi-modal association-type grayscale image. Figure 5 shows the complete framework of the protocol dynamic evolution prediction model.
Figure 5. Complete framework of protocol dynamic evolution prediction model
Under the multi-task learning framework, the model realizes multi-dimensional prediction of protocol evolution through the collaborative design of shared layers and task-specific layers. The shared layers are responsible for extracting the general feature representation of protocol interactions, which includes the basic rules and patterns of protocol operation. The task-specific layers set up independent fully connected networks for different prediction targets and adaptively adjust the shared features through task-specific parameters ϕi, so as to achieve accurate prediction of each sub-task. The model adopts a hard parameter sharing mechanism ϕtg, which forces different tasks to share low-level features during the learning process, thereby enhancing the ability to mine complex coupled information of the protocol, and alleviating the overfitting problem through the regularization effect among tasks, improving the generalization ability of the model. For example, when predicting the changes of HTTP protocol status codes, the shared layer can learn the general temporal patterns of the request-response cycle, while the task-specific layers respectively optimize the prediction parameters for normal state transitions and abnormal state jumps. Finally, through joint optimization of multiple tasks, a comprehensive and accurate modeling of protocol dynamic evolution is achieved. Assuming the weight coefficient is denoted by qi, and the loss function is denoted by $\hat{M}^i$(ϕtg,ϕi), defined as: 1/VΣVu=1M(di(au, ϕtg, ϕi), biu), then the loss function expression for multi-task learning is:
$M I N \sum_{i=1}^I q^i \hat{M}^i\left(\phi^{t g}, \phi^i\right)$ (13)
To realize the graph-structured fusion and deep analysis of image features and protocol dynamic features through hierarchical processing, this paper constructs a detection framework based on Graph Attention Network (GAT) to achieve multimodal behavior recognition under complex network background. Among them, the GAT layer maps multimodal inputs as node attributes in the graph structure, using the connections between nodes to represent the spatiotemporal correlation or protocol interaction logic between features. Through a multi-head attention mechanism, node vectors are iteratively updated to dynamically capture the key dependencies of different modal features within local neighborhoods, realizing precise extraction of fine-grained behavior features in multimodal data. Secondly, the Readout layer aggregates node-level features output by the GAT layer through pooling and other operations, generating graph-level representations containing fused multimodal information, integrating scattered node features into high-level semantics reflecting the global structure of network behaviors. Finally, the fully connected layer performs classification decisions based on the graph-level representation, combining the global correlation patterns and local detailed features of multimodal features to realize comprehensive discrimination of abnormal behaviors in complex networks. This framework unifies the spatial features visualized as images and temporal features of protocol dynamics through graph structures, and uses attention mechanisms to adaptively allocate weights of multimodal features, effectively solving the feature heterogeneity problem in cross-modal information fusion encountered by traditional methods.
Specifically, let the set of feature vectors of all l nodes in the graph be denoted as $\tilde{G}$={$\tilde{g}_1,\tilde{g}_2,...,\tilde{g}_l$}. The GAT layer takes $\tilde{G}$ and X as inputs, outputting a new set of node feature representations $\tilde{G}_u^{\prime}$={$\tilde{g}_1^{\prime},\tilde{g}_2^{\prime},...,\tilde{g}_V^{\prime}$}, where the set of all neighbor nodes of node u is denoted by Vu. The GAT layer takes the node feature vector set G generated by traffic conversion and adjacency matrix X as inputs. First, using the shared attention mechanism shown in the following formula, it computes the attention coefficient βuk between the center node and its neighbor nodes. That is, by applying a learnable weight matrix Q for linear transformation on node features, concatenating || the features of the center node u and neighbor node k, passing through a single-layer feedforward neural network x( ) and LeakyReLU activation function, generating asymmetric attention scores, and then normalizing by softmax to obtain the importance weights between nodes.
$\begin{aligned} & \beta_{u k}=\operatorname{softmax}\left(\operatorname{LeakyReLU}\left(a\left(\left[Q \tilde{g}_u \| Q \tilde{g}_k\right]\right)\right)\right), k \in V_u\end{aligned}$ (14)
The above process enables the model to adaptively focus on neighbor nodes that contribute highly to the current node feature update, suppressing interference from irrelevant or weakly related nodes, thus accurately capturing the local dependency relationships between multimodal features in the graph structure. For example, coupling the spatially adjacent features in temporal behavior grayscale images with the temporal correlations of protocol fields through node attention weights.
Further, the GAT layer employs the multi-head attention mechanism shown in the following formula to enhance the robustness and richness of feature extraction. By parallel computing node feature updates through J independent attention heads, each head generates an independent feature representation $\tilde{g}_j^{\prime}$ based on different parameter matrices Qj. The final node feature $\tilde{g}_u^{\prime}$ is aggregated by concatenation or averaging operations.
$\tilde{g}_u^{\prime}=\|_{j=1}^J \delta\left(\sum_{k \in V_u} \beta_{u k}^j Q^j \tilde{g}_k\right)$ (15)
The above processing allows the model to capture complex association patterns in multimodal data from multiple perspectives, such as simultaneously learning local texture structures of visualized features and state transition paths of protocol dynamic features, avoiding feature expression bias possibly caused by a single attention head. Additionally, the spatial domain characteristics of the GAT layer enable it to flexibly handle dynamically changing network communication structures by dynamically adjusting attention weights to adapt to the spatiotemporal heterogeneity of multimodal behaviors in complex networks. This is especially suitable for abnormal behavior scenarios with frequent traffic interactions and diverse protocol states, ensuring continuous and efficient extraction of cross-modal fused features during network topology dynamic evolution.
The Readout layer addresses the need for global feature aggregation in multimodal behavior recognition under complex networks, realizing high-level semantic modeling of traffic graphs through hierarchical feature fusion and cross-layer information concatenation. This layer takes as input the node feature matrices output by multiple GAT layers. First, it performs pooling operations on node representations generated by each GAT layer separately to obtain corresponding graph-level representation vectors, capturing graph structural features under different numbers of attention heads and different iteration depths. Assuming functions of average pooling, max pooling, and sum pooling are denoted as d(), the M-th GAT network is denoted by M, and the j-th attention computation by j, then:
$\widetilde{g}_H^M=d\left(\widetilde{g}_1^1, \widetilde{g}_2^2, \ldots, \widetilde{g}_V^j\right)$ (16)
Subsequently, the multi-layer pooling results are concatenated along the dimension by Concat operation to form the final graph-level representation vector containing multi-scale and multi-level semantic information:
$\tilde{g}_H=\left\lfloor\tilde{g}_H^1\left\|\tilde{g}_H^2\right\| \ldots \| \tilde{g}_H^M\right\rfloor$ (17)
The above process enables the Readout layer to preserve the detailed features and abstract semantics extracted by the GAT at different depths. The lower-level features retain pixel-level correlations of the visualized temporal features and fine-grained interaction patterns of protocol fields, while the higher-level features integrate cross-modal global behavior patterns, thereby fusing local details and global dependencies of multimodal data into a single vector.
In the detection framework constructed in this paper, the fully connected layer serves as the final decision unit for multimodal behavior recognition. Its core principle is to map the graph-level representation vector output by the Readout layer to classification probabilities of complex network behaviors through a combination of multilayer perceptron (MLP) and Softmax function, achieving semantic discrimination of multimodal fused features. This layer takes as input a global vector containing visualized temporal features, protocol dynamic features, and graph structure associations. First, it performs nonlinear mapping of high-dimensional features through the fully connected transformation of the MLP, capturing the complex interaction patterns of multimodal information in the abstract semantic space. For example, it integrates the pixel correlation features of abnormal regions in grayscale images with abnormal temporal patterns of protocol state transitions through cross-modal logical fusion, forming comprehensive discriminative clues for malicious or normal traffic. Subsequently, the Softmax function normalizes the unnormalized scores output by the MLP into probability distributions, generating predicted probability vectors for each behavior category, enabling the model to quantify the contribution of different modal features to the classification decision. Let the predicted label be denoted by $\hat{b}$, and the learnable weight parameters and biases in the MLP be denoted by Q and y, then:
$\hat{b}=\operatorname{softmax}\left(Q \widetilde{g}_H+y\right)$ (18)
For the binary classification task of encrypted malicious traffic detection, the fully connected layer uses the binary cross-entropy loss function as the optimization objective. It dynamically adjusts the learnable weights Q and biases y through backpropagation to minimize the distribution difference between the predicted label $\hat{b}$ and the true label b. This mechanism enables the fully connected layer to adaptively strengthen the weights of key discriminative information in multimodal features while suppressing interference from redundant or noisy features. For example, when processing encrypted traffic, the fully connected layer can focus on abnormal node connection patterns captured by the GAT layer and the global traffic temporal anomalies integrated by the Readout layer, transforming these cross-modal abnormal clues into high-confidence predictions of malicious traffic through nonlinear transformations. Ultimately, the fully connected layer acts as the "decision center" of the detection framework, converting the hierarchical abstract representation of multimodal features into precise behavior recognition results, achieving efficient classification of encrypted malicious and benign traffic in complex network environments. The objective function expression is:
$\operatorname{LOSS}=-(b \log \hat{b}+(1-b) \log (1-\hat{b}))$ (19)
From the ablation experiment results in Table 1, the complete model proposed in this paper performs best on all performance indicators: accuracy reaches 98.78%, precision 98.11%, recall 98.21%, and F1 score 98.24%, significantly higher than other ablation models, such as the MIC replacing model with accuracy 97.25%, the model without MIC-gamma enhancement with accuracy 96.32%, the CBAM replacing model with accuracy 98.41%, and the BiGRU replacing model with accuracy 98.23%. This result verifies the effectiveness of the research content in this paper: first, the network temporal behavior feature visualization effectively improves the discriminability of image features; second, the protocol dynamic evolution modeling enhances the ability to capture abnormal protocol state transitions; finally, multimodal behavior recognition achieves precise discrimination of complex network anomalies by integrating visual and semantic information. Experimental data shows that the method in this paper significantly improves the accuracy and robustness of anomaly behavior recognition through the collaborative design of image-based mapping, protocol dynamic prediction, and multimodal fusion, verifying the effectiveness of the technical route of "image processing + protocol dynamic modeling + multimodal fusion."
Table 1. Ablation experiment results
|
Model |
Accuracy (%) |
Precision (%) |
Recall (%) |
F1-measure (%) |
|
MIC replacing FCBF-MIC |
97.25 |
97.56 |
97.56 |
97.58 |
|
Without MIC-gamma image enhancement |
96.32 |
95.32 |
93.21 |
94.25 |
|
CBAM replacing CBAM-CNN module |
98.41 |
97.89 |
94.56 |
96.32 |
|
BiGRU replacing DBiGRU module |
98.23 |
98.31 |
98.23 |
98.41 |
|
Complete model |
98.78 |
98.11 |
98.21 |
98.24 |
From Figure 6, it can be seen that before image enhancement, the grayscale images of temporal features show low contrast between abnormal regions and normal regions, and the histogram distribution is relatively dispersed; the pixel values of abnormal features do not form significant clusters. After enhancement, the dark blocks in abnormal regions of the grayscale image are denser and boundaries are clearer; the frequency of high grayscale value samples in the histogram significantly increases, indicating that the MIC-gamma enhancement technique effectively strengthens the visual representation of abnormal features. Through image mapping and enhancement processing, the local high-contrast pixel clusters of network abnormal behaviors become easier for subsequent models to capture. The enhanced grayscale images not only improve the recognizability of abnormal features but also provide higher quality visual inputs for multimodal fusion. Combined with the performance decline in the ablation experiment model "without MIC-gamma enhancement," this further verifies the key role of image enhancement in feature extraction. By optimizing the pixel distribution of the grayscale image, it enhances the visual differences between abnormal and normal behaviors, laying the foundation for subsequent GAT layers to capture cross-modal associations among nodes.
1) Before image enhancement
2) After image enhancement
Figure 6. Grayscale images and histograms of network abnormal behavior temporal features before and after image enhancement
From the comparative experimental results in Table 2, it can be seen that this paper’s method demonstrates significant advantages in recognizing the three types of network abnormal behaviors: temporal mutation type, protocol deviation type, and multimodal correlation type. Specifically, for temporal mutation behavior, this method achieves accuracy (97.26%±0.35), precision (97.56%±0.38), recall (97.56%±0.58), and F1 score (97.56%±0.42) all higher than comparison models, indicating that the image mapping effectively captures abnormal patterns of local high-contrast pixel clusters; in protocol deviation behavior recognition, this method’s accuracy (97.88%±0.24) and F1 score (98.36%±0.28) significantly outperform DHHNN (96.87%±0.78, 96.57%±0.82), reflecting the protocol dynamic evolution model’s precise discrimination of global semantic anomalies; for multimodal correlation behavior, this method’s accuracy (98.69%±0.12) and F1 score (98.36%±0.22) far exceed APAN (97.25%±0.71, 97.56%±0.52), verifying the superiority of the multimodal fusion architecture in integrating cross-modal correlation “fingerprints.” Experimental data show that the method’s technical route of "image mapping enhancing visual feature recognition → protocol dynamic modeling capturing semantic anomaly trends → multimodal fusion realizing cross-modal information complementarity" successfully breaks through the limitations of single-modal features and achieves the current best performance in recognizing the three types of abnormal behaviors.
Table 2. Comparison of different network abnormal behavior recognition methods
|
Model |
Behavior Type |
Accuracy (%) |
Precision (%) |
Recall (%) |
F1-measure (%) |
|
DySAT |
Temporal Mutation |
95.26±1.23 |
95.12±1.18 |
95.21±1.58 |
95.36±1.69 |
|
Protocol Deviation |
96.54±1.28 |
96.32±1.32 |
96.32±0.97 |
96.69±1.14 |
|
|
Multimodal Correlation |
96.58±4.58 |
96.89±1.66 |
96.34±1.56 |
96.87±1.87 |
|
|
DHHNN |
Temporal Mutation |
96.32±1.18 |
95.36±1.03 |
95.68±1.07 |
95.36±1.17 |
|
Protocol Deviation |
96.87±0.78 |
96.36±0.85 |
96.36±0.78 |
96.57±0.82 |
|
|
Multimodal Correlation |
97.58±1.48 |
97.56±1.69 |
97.56±0.91 |
97.56±1.12 |
|
|
APAN |
Temporal Mutation |
96.32±0.92 |
96.35±0.44 |
96.32±0.71 |
96.36±0.38 |
|
Protocol Deviation |
96.32±0.68 |
96.12±0.62 |
96.34±0.55 |
96.34±0.72 |
|
|
Multimodal Correlation |
97.25±0.71 |
98.36±0.34 |
97.88±0.57 |
97.56±0.52 |
|
|
LA-DGNN |
Temporal Mutation |
94.25±1.58 |
93.58±0.98 |
94.56±1.68 |
94.56±1.28 |
|
Protocol Deviation |
94.23±1.52 |
94.56±1.89 |
94.56±1.55 |
94.58±1.69 |
|
|
Multimodal Correlation |
95.32±1.89 |
95.36±1.17 |
95.36±1.23 |
95.36±1.57 |
|
|
The Proposed Method |
Temporal Mutation |
97.26±0.35 |
97.56±0.38 |
97.56±0.58 |
97.56±0.42 |
|
Protocol Deviation |
97.88±0.24 |
97.32±0.11 |
97.58±0.33 |
98.36±0.28 |
|
|
Multimodal Correlation |
98.69±0.12 |
98.69±0.15 |
98.69±0.19 |
98.36±0.22 |
In summary, the effectiveness of this method is fully validated through comparative experiments with mainstream models. Its leading performance indicators directly reflect the innovation and practicality of the "image processing + protocol dynamic modeling + multimodal fusion" technical system in complex network abnormal behavior recognition, providing a more accurate and robust solution for network security detection.
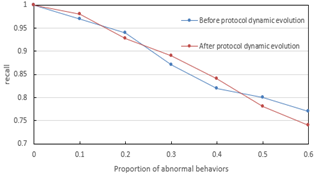
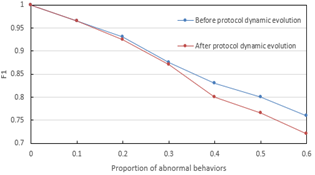
From Figure 7, it can be seen that under different abnormal behavior proportions, the model after protocol dynamic evolution significantly outperforms the model before evolution in accuracy, precision, recall, and F1 score. When the abnormal proportion is 10%, the accuracy after evolution approaches 1, while before evolution it is slightly lower; as the abnormal proportion increases to 60%, the F1 score after evolution still remains above 0.75, far exceeding the 0.7 before evolution. This indicates that the protocol dynamic evolution prediction model proposed in the second part of the paper effectively improves the early warning ability for abnormal behaviors by capturing the dynamic trend of protocol state transitions, enhancing the model's semantic anomaly discrimination capability. Meanwhile, combined with the image mapping in the first part and the multimodal fusion in the third part, the model achieves complementary cross-modal information: visual features capture local temporal mutations, protocol dynamic features identify global semantic deviations, and their synergy allows the model to maintain high robustness under fluctuations in abnormal proportions. Experimental data verify the superiority of the "image processing + protocol dynamic modeling + multimodal fusion" technical route. The model's lead in all performance indicators after protocol dynamic evolution directly reflects the method's precise recognition capability for complex network abnormal behaviors.
1) Accuracy
2) Precision
3) Recall
4) F1-measure
Figure 7. Network abnormal behavior recognition performance under different proportions of behaviors
The "complex network abnormal behavior recognition method combining image processing and protocol dynamic evolution modeling" proposed in this paper systematically solves the problems of insufficient utilization of temporal features, lack of protocol semantic analysis, and low multimodal fusion efficiency in complex network environments through the technical chain design of "network temporal behavior feature imaging — protocol dynamic evolution prediction — multimodal behavior recognition." This method breaks through the limitations of traditional single-modal recognition and constructs a trinity framework of "visual feature perception — protocol semantic understanding — multimodal reasoning," providing a solution with both theoretical innovation and engineering value for the network security field. Its core values are: 1) methodological innovation: for the first time deeply integrating image processing technology and protocol dynamic modeling, realizing hierarchical representation of abnormal behaviors through grayscale image classification, providing a new visualization paradigm for complex network feature analysis; 2) technical feasibility: designed FCBF-MIC feature selection, MIC-gamma image enhancement, and multitask learning mechanisms effectively balance model accuracy and computational efficiency, and experimental results demonstrate its feasibility for engineering deployment; 3) scenario universality: the three types of grayscale image classification systems cover a wide range of scenarios from single-feature mutations to multi-protocol coordinated attacks, providing a generalized framework for abnormal detection in security-sensitive fields such as industrial internet and financial networks.
Although this method performs excellently in multiple abnormal scenarios, there remain areas for improvement: 1) generalization in extreme abnormal scenarios: the current model’s recognition of very low-frequency abnormal behaviors relies on historical data features, with limitations in detecting completely unknown anomalies; 2) dynamic graph scale adaptability: when the number of network nodes dramatically increases, the computational complexity of the GAT layer significantly rises, requiring further optimization of sparse strategies for graph attention mechanisms; 3) deep mining of protocol semantics: existing protocol dynamic models have limited field parsing capability for encrypted traffic and lack effective modeling of encrypted content semantics. Future research can proceed in the following directions: 1) introducing contrastive learning or generative adversarial networks to build unsupervised anomaly representation learning models to enhance detection ability for unknown anomalies; 2) studying efficient GAT variants based on subgraph sampling or attention weight pruning to reduce computational costs in large-scale network scenarios; 3) combining natural language processing technology to semantically reconstruct encrypted traffic payloads, overcoming the limitations of encrypted content on protocol dynamic modeling.
In summary, this research provides a new technical path for complex network abnormal behavior recognition. Its three-category grayscale image classification system and multimodal fusion framework have significant scalability, and the related results can further promote the development of network security detection technology toward intelligence and precision.
[1] Shevchuk, R., Snarskii, A. (2012). Transforming a complex network to an acyclic one. Physica A: Statistical Mechanics and its Applications, 391(23): 6184-6189. https://doi.org/10.1016/j.physa.2012.07.030
[2] Shanker, O. (2010). Complex network dimension and path counts. Theoretical Computer Science, 411(26-28): 2454-2458. https://doi.org/10.1016/j.tcs.2010.02.013
[3] Soriano–Sánchez, A.G., Posadas–Castillo, C., Platas–Garza, M.A., Arellano–Delgado, A. (2018). Synchronization and FPGA realization of complex networks with fractional-order Liu chaotic oscillators. Applied Mathematics and Computation, 332: 250-262. https://doi.org/10.1016/j.amc.2018.03.057
[4] Lee, C. Y., Chong, H. Y., Liao, P.C., Wang, X. (2018). Critical review of social network analysis applications in complex project management. Journal of Management in Engineering, 34(2): 04017061. https://doi.org/10.1061/(ASCE)ME.1943-5479.0000579
[5] Li, H., Han, J., Wang, Y. (2013). A new method for modeling complex network topology of software systems. Applied Mathematics & Information Sciences, 7(3): 1225-1228.
[6] Gudkov, V., Montealegre, V. (2008). Analysis of networks using generalized mutual entropies. Physica A: Statistical Mechanics and its Applications, 387(11): 2620-2630. https://doi.org/10.1016/j.physa.2008.01.005
[7] Peng, C., Liu, M., Yuan, X.P., Zhang, L.X., Man, J.F. (2018). A new method for abnormal behavior propagation in networked software. Journal of Internet Technology, 19(2): 489-498. https://doi.org/10.3966/160792642018031902017
[8] Marir, N., Wang, H., Feng, G., Li, B., Jia, M. (2018). Distributed abnormal behavior detection approach based on deep belief network and ensemble SVM using spark. IEEE Access, 6: 59657-59671. https://doi.org/10.1109/ACCESS.2018.2875045
[9] DeAlmeida, J.M., Pontes, C.F., DaSilva, L.A., Both, C.B., Gondim, J.J., Ralha, C.G., Marotta, M.A. (2021). Abnormal behavior detection based on traffic pattern categorization in mobile networks. IEEE Transactions on Network and Service Management, 18(4): 4213-4224. https://doi.org/10.1109/TNSM.2021.3125019
[10] Liu, H., Liu, Y., Li, B., Qi, Z. (2022). Ship abnormal behavior detection method based on optimized GRU network. Journal of Marine Science and Engineering, 10(2): 249. https://doi.org/10.3390/jmse10020249
[11] Rong, J., Hao, H., Xu, W. (2024). Big data intelligent tourism management platform design based on abnormal behavior identification. Intelligent Systems with Applications, 21: 200312. https://doi.org/10.1016/j.iswa.2023.200312
[12] Lotfi, A., Langensiepen, C., Mahmoud, S.M., Akhlaghinia, M.J. (2012). Smart homes for the elderly dementia sufferers: Identification and prediction of abnormal behaviour. Journal of Ambient Intelligence and Humanized Computing, 3: 205-218. https://doi.org/10.1007/s12652-010-0043-x
[13] Topol, B., Stasko, J.T., Sunderam, V. (1998). Pvanim: A tool for visualization in network computing environments. Concurrency: Practice and Experience, 10(14): 1197-1222. https://doi.org/ 10.1002/(SICI)1096-9128(19981210)10:143.0.CO;2-O
[14] Rameshwari, R., Chapadgaonkar, S.S., Prasad, T.V. (2019). A robust algorithm for visualization of protein interaction network. Iranian Journal of Science and Technology, Transactions A: Science, 43: 1411-1416. https://doi.org/10.1007/s40995-018-0632-7
[15] Ghosh, N., Prasad, T., Banerjee, I. (2019). Differential evolution and mobile sink based on-demand clustering protocol for wireless sensor network. Wireless Personal Communications, 109(3): 1875-1895. https://doi.org/10.1007/s11277-019-06657-8
[16] Smail, O., Soltane, K., Mekkaoui, A. (2025). DERP: Differential Evolution Based Routing Protocol for Wireless Body Area Networks. Journal of Information Science & Engineering, 41(3): 613-625. https://doi.org/10.6688/JISE.202505_41(3).0006
[17] Zeng, J.J., Chao, H.C., Wei, J. (2025). Abnormal behavior detection based on DS evidence theory for air-ground integrated vehicular networks. IEEE Internet of Things Journal. 12(9): 11347-11355. https://doi.org/10.1109/JIOT.2025.3549773
[18] Yu, J., Chen, Z., Zhu, Y., Chen, Y., Kong, L., Li, M. (2016). Fine-grained abnormal driving behaviors detection and identification with smartphones. IEEE Transactions on Mobile Computing, 16(8): 2198-2212. https://doi.org/10.1109/TMC.2016.2618873
[19] Sivaroopan, N., Bandara, D., Madarasingha, C., Jourjon, G., Jayasumana, A.P., Thilakarathna, K. (2024). Netdiffus: Network traffic generation by diffusion models through time-series imaging. Computer Networks, 251: 110616. https://doi.org/10.1016/j.comnet.2024.110616
[20] Ma, Y., Li, Z., Xue, H., Chang, J. (2024). A balanced supervised contrastive learning-based method for encrypted network traffic classification. Computers & Security, 145: 104023. https://doi.org/10.1016/j.cose.2024.104023