Esra Ekinci*![]() | Kaan Kahraman
| Kaan Kahraman![]() | Murat Oturakci
| Murat Oturakci![]()
© 2025 The authors. This article is published by IIETA and is licensed under the CC BY 4.0 license (http://creativecommons.org/licenses/by/4.0/).
OPEN ACCESS
Driver drowsiness is one of the main causes of serious traffic accidents and a significant risk factor, especially for long journeys and heavy vehicle drivers. To prevent drowsiness-related accidents, it is of great importance to develop accurate and reliable systems for the detection. This study makes an innovative contribution by proposing a hybrid system that uses both physiological data (ECG) and in-vehicle data (CAN-Bus) to detect driver drowsiness. Aim is to provide higher accuracy detection by combining two different data sources. ECG and CAN-Bus data were collected from real drivers under various environmental and traffic conditions, and these data were analyzed using machine learning algorithms. A three-class drowsiness detection model was developed and this model classified drivers into low, medium and high drowsiness levels. The results obtained showed that the model was successful in drowsiness detection with an accuracy rate of 85%. This rate offers a significant improvement compared to previous studies based on only ECG data. Developed system is designed for real-world driving environments and has the potential for industrial implementation, offering an impactful solution to increase driver safety and prevent drowsiness-related accidents.
driver drowsiness, machine learning, ECG, CAN-Bus, driver safety
Turkey road network frequently faces with severe traffic accidents, resulting in thousands of fatalities, injuries, and material damage annually. According to TSI 2022 – Road Traffic Accident Statistics [1], a total of 1,232,957 traffic accidents occurred, of which 235,176 led to deaths or injuries. These accidents resulted with 288,696 injuries and 5,229 deaths (the death toll includes those who passed away from their injuries within 30 days following the incident). These alarming statistics once again highlight significant issues related to traffic safety. Based on TSI 2022 – Road Traffic Accident Statistics [1], it was reported that driver errors caused 87% of such accidents in 2022. Although no specific study has been conducted for Turkey, it is generally known that drowsiness while driving contributes to 3% to over 30% of accidents [2]. According to data from the National Highway Traffic Safety Administration (NHTSA) in the United States, drowsiness is reported as the most common critical cause among non-performance-related faults, which account for 7% (±1.0%) of driver-related accidents [3]. Therefore, it is crucial to examine accidents caused by driver drowsiness and discuss the solutions developed to address these issues.
Drowsiness can be simply defined as the tendency to fall asleep. Sleep is generally divided into three phases: wakefulness, non-rapid eye movement (NREM) sleep, and rapid eye movement (REM) sleep. The NREM phase can be further subdivided into three stages such as: Transition from wakefulness to sleep; Light sleep and Deep sleep. According to Sahayadhas et al. [4], NREM sleep is the first stage that is commonly referred to be "driver drowsiness." According to reports of the National Highway Traffic Safety Administration (NHTSA) in the United States, drowsiness in the drivers can lead to slowed reaction time; reduced attention and decreased brain processing capacity [5]. Therefore, it has become essential to monitor drivers during their journeys to prevent accidents caused by driver drowsiness.
The topic of driver drowsiness has gained significant attention in academic literature. A bibliometric analysis of publications from 1998 to 2023 indicates that a substantial portion of this research is related to computer science disciplines, reflecting the growing interest in sensor technologies, data mining, deep learning, and facial recognition, especially after 2010 [6].
In the literature on driver drowsiness studies, the measurement methods developed for driver monitoring are categorized into three groups as vehicle-based, behavioral and physiological measurements [4, 7-13]. In vehicle-based measurements, driver drowsiness is assessed through various metrics during driving, such as lane position deviations, steering wheel movement, driving speed, accelerator pedal pressing, and vehicle yaw angle [14, 15]. These studies can be conducted using data collected from real drivers or through driving simulators. However, studies using simulators may provide misleading results as they do not fully replicate real-life conditions. For instance, when driving in bad weather or on poorly maintained roads, a driver may deviate from their lane more frequently. Similarly, a vehicle driven over rough terrain may exhibit greater variance in steering wheel movements than a simulator. As a result, it can be argued that the findings from simulator research may not accurately represent driving situations in real life and could therefore lead to inaccurate conclusions [10]. Behavioral measurements mostly rely on facial recognition technologies. Although the measurements obtained from these methods are generally reliable, the accuracy of results can vary depending on the quality of the equipment used and specific characteristics of the driver. For instance, results can be misleading when typical real-world variables like the use of sunglasses or masks, facial hair, and race-specific facial features may lead to misleading results. Eye closure analysis [13, 16, 17], Blink rate [18], Yawning analysis [19], and Facial expression analysis [11, 13, 20, 21], are frequently employed in research utilizing behavioral measurements. The physiological measurements used to assess drowsiness are most commonly based on the Electroencephalography (EEG) [22], Electrocardiography (ECG) [23], Electrooculogram (EOG) [24], Electromyogram (EMG) [25], Galvanic Skin Response (GSR) [26], and Skin Temperature [27].
Drivers' degrees of drowsiness can be accurately assessed using physiological measures. It is crucial to take into account the high cost of the tools needed for these measurements, how challenging it is to utilize them in everyday tasks, and the possibility of inaccurate data resulting from external factors.
Hybrid approaches that incorporate behavioral, physiological, and vehicle-based measures are also observed in the literature. In particular, several researches have combined ambient factors, EEG, and drowsiness detection with driver monitoring using a camera while gathering vehicle-based measures [28, 29]. However, there are currently numerous more studies on this topic due to recent developments in sensor and large data analysis techniques. Despite this, there are still gaps in the literature regarding hybrid studies. On the other hand, errors that may occur in each method can be mitigated by hybrid methods that combine multiple approaches [10]. Therefore, the primary motivation of this study is to create a highly reliable drowsiness measurement system that can be easily applied to real-life drivers and makes use of various parameters derived from the vehicle.
The research questions for this study are:
Research Question 1: Is it possible to quickly and accurately collect physiological data from drivers during driving?
Research Question 2: Can a drowsiness measurement be proposed that simultaneously considers both physiological data and vehicle-based measurements of drivers?
Research Question 3: Besides the parameters identified in previous studies on vehicle-based measurements, are there other parameters that influence driver drowsiness?
Regarding Research Question 1, physiological data will be collected through ECG data from drivers. ECG measures the bioelectrical activity of the heart. The ECG signal is the result of very low-level electrical voltages generated on the body's surface due to the depolarization of heart muscles during heartbeats. There are specific names for the waves and parameters observed in an ECG output, such as Q, R, S, T, QT, ST, RR, and QRS [30]. However, for fatigue detection, HRV (Heart Rate Variability) derived from ECG data should be considered. HRV measures the variation in time intervals between heartbeats, which reflects the regulation of the sympathetic and parasympathetic nervous systems (PSNS) and has been used in previous studies to detect fatigue [31]. HRV characteristics are examined by looking at the series of peak points of the R wave and the intervals between the RR waves. Physiological measurements will be conducted by extracting HRV values from the gathered ECG data in order to answer this research question.
To precisely determine the degree of driver drowsiness, gathering data from both physiological and vehicle-based sources while driving is the main goal in addressing Research Question 2. The study intends to use advanced classification algorithms to combine data from two different sources in order to create a system that more accurately models and predicts driver drowsiness. Because electrocardiogram (ECG) data is readily available and dependable, it will be used for physiological measures. Concurrently, information regarding to the vehicle will be gathered through the use of CAN-Bus (Controller Area Network - Bus), a communication standard found in vehicles that enables instantaneous communication between different electrical parts, including the engine, brakes, and sensors. The integration of vital vehicle components is guaranteed by CAN-Bus, which improves overall performance and safety. The present study seeks to close the current gap in the literature by utilizing a hybrid methodology for both data gathering and analysis.
To address Research Question 3, the research will collaborate with an automotive company to gather CAN-Bus data from actual drivers, which will be used to create new drowsiness detection parameters. Machine learning techniques will be employed to examine this data with the aim to find factors that exhibit a significant association with driver drowsiness.
The originality of this study lies in its potential to address gaps in the literature and contribute to driving safety. It provides a practical and applicable solution in real-life circumstances via rendering it straightforward to collect drivers' physiological data while minimizing error rates. The accuracy of techniques for identifying driver drowsiness will also be improved by the inclusion of additional parameters and the enrichment of vehicle-based measurements. Road safety will be significantly improved as a result of the development of more effective accident prevention strategies.
This study is being carried out using real-time data gathered from a broad set of drivers in a variety of environmental situations in partnership with the R&D center of a leading automotive company in Turkey. The focus of this study is on real-time data collecting from real drivers, which distinguishes it apart from previous studies in the literature that frequently use data from driving simulators. The study intends to yield more significant and accurate findings by including drivers from a variety of age groups and collecting data in a range of environmental circumstances. Consequently, the assessment outcomes are anticipated to provide more practical and effective solutions for real-world applications. Furthermore, the alert algorithm developed in this study will detect drowsiness—categorized into three classes—by analyzing specific parameters in CAN-Bus data, triggering appropriate warning systems. The findings of this study will be directly applied by the partnering R&D center to enhance driver safety technologies.
To identify the gap in the literature regarding driver drowsiness detection based on ECG values, the most recent articles from the Web of Science database, published between 2020 and 2024, have been thoroughly examined (Table 1). The results of the studies examined from the WOS database and presented in detail are assessed in the discussion section with the findings obtained from this study.
In the first part of the study, driver drowsiness and measurement methods were explained, and research questions were determined. Then, previous studies related to the research questions were reviewed and the gap in the literature was revealed. In the second part of the study, data characteristics and methods were included. The third part included the results of the study, and the fourth part included the discussion. The last part of the study consisted of the conclusion.
Table 1. Literature regarding driver drowsiness detection using ECG values
|
Author |
Data |
Measure Type |
Performance |
Aim |
||
|
Vehicle |
Behavioral |
Physiological |
|
|
||
|
Chang et al. [32] |
Simulated driving with 21 individuals |
|
States of the eyes (blinking, closing, opening) Head Movements (vertical, horizontal, and rotating) |
ECG |
97.97% |
Detecting driver drowsiness using ECG |
|
Tjolleng and Jung [33] |
Simulated driving with 67 individuals |
|
|
ECG |
training accuracy at 99 ± 0.8% and testing accuracy at 95 ± 3.7% |
Using ECG signal to identify user having cognitive overload or drowsiness |
|
Sukumar et al. [34] |
Simulated driving with 13 individuals |
|
Steering wheel sensors Accelerometer for head movements |
ECG; EMG; GSR |
97.30% |
Detection of driver stress level and drowsiness |
|
Arefnezhad, et al. [35] |
Simulated driving with 92 individuals |
|
Video recordings to analyze yawning, long blinks, and head nodding |
ECG |
77% and 79% in the manual and automated modes |
Detecting driver drowsiness using ECG |
|
Esteves et al. [36] |
Simulated driving with 13 individuals |
Dynamic signals such as acceleration and braking, are obtained directly from the simulator |
Face video |
ECG |
|
Advancing the state-of-the-art in driver drowsiness monitoring |
|
Ebrahimian et al. [37] |
Simulated driving with 30 individuals |
|
|
ECG, Respiration |
three-level and five-level classifications of drowsiness can be achieved with 91 and 67% accuracy |
Multi-level classification of drowsiness with three and five levels and proposing a method applicable for industrial use |
|
Murugan et al. [38] |
Simulated driving with 10 individuals |
|
|
ECG |
normal–drowsy, normal–visual inattention, normal–fatigue and normal–cognitive inattention is 100%, 93.1%, 96.6% and 96.6% respectively. 58.3% for five-class detection |
Detection of driver hypovigilance (drowsi- ness, fatigue, visual inattention and cognitive inattention) using physiological signals from ECG |
|
Babusiak et al. [39] |
|
|
|
ECG Oximeter Photoplethysmography |
|
Development of a platform on steering wheel in detecting specific cardiovascular diseases (especially atrial fibrillation) and drowsiness |
|
Perkins et al. [40] |
DROZY database containing data of 14 individuals |
|
Video recordings of drivers' faces and behavior |
ECG; EEG; EMG; EOG |
93.10% |
Development of a hybrid model to detect driver drowsiness |
|
Fujiwara et al. [41] |
Simulated driving with 20 individuals |
|
|
ECG; EEG; EOG |
89% |
Detecting driver drowsiness using ECG (R-R Interval) |
|
Kundinger et al. [42] |
Simulated driving with 30 individuals |
|
Face video |
Heart rate using wrist band ECG |
97.37% in user dependent tests, 78.94% in user independent tests |
Detecting driver drowsiness using wrist-worn wearable device |
|
Wolkow et al. [43] |
59 heavy vehicle drivers |
In vehicle monitoring system: harsh braking and harsh acceleration events collected |
|
Heart rate using wrist band |
|
Detecting driver drowsiness using wrist-worn wearable device and warning drivers to prevent harsh brakes and accelerations |
|
Muramatsu and Sasaki [44] |
|
|
|
ECG: using conductive electrodes on steering wheel, capacitive electrodes on seat |
|
Detecting driver drowsiness using the conductive/capacitive hybrid ECG R peak measurement system |
|
Linschmann et al. [45] |
Simulated driving with 20 individuals |
|
|
Capacitive ECG using portable cushion (heart and respiratory rates) |
|
Developing a portable cushion to monitor driver's vital signs |
|
Seok et al [46] |
Experiment with 11 individuals (press a push-button switch when a stimulus (3 × 3 mm black square) appeared on the screen) |
|
|
ECG; EEG |
>90% |
Detecting low vigilance using ECG & EEG |
|
Du et al. [47] |
Simulated driving with 50individuals |
|
|
ECG using palm and chest |
85.32% - 96.49% |
Detecting driving fatigue by measuring ECG through intelligent steering wheel |
|
Sedik et al. [48] |
DROZY database containing data of 14 individuals |
|
Video recordings of drivers' faces and behavior |
ECG; EEG; EMG; EOG |
96% |
Development of a model to detect driver drowsiness based on ECG, EEG, EMG and EOG |
|
Yang et al. [49] |
797 data (single subject) |
|
|
BCG signal (similar to ECG); EEG |
Heart rate accuracy: 88.49%, Respiratory rate accuracy: 88.37% using BCG |
Development of a Non-Contact Biosignal Measurement Method for Monitoring Drivers’ Heart Rates similar to ECG |
|
Devarajan et al. [50] |
|
Sensors for detecting vehicle parameters (steering wheel angle (SWA) sensor, grip force sensor, radar sensor, IR sensor) |
Face video |
ECG; EEG |
|
Developing a hybrid system enabling driver, vehicle and road monitoring |
2.1 Data characteristics
In this study, a comprehensive dataset comprising 10 hours of data collected from both drivers and their vehicles was meticulously assembled to classify and assess driver fatigue levels. The dataset includes signals from ECG readings from drivers and CAN-Bus communication signals from the vehicles. The data was gathered from drivers of different genders and age groups. Drivers between the ages of 18 and 45, of different genders, were asked to use their vehicles for various lengths of time depending on their preferences during the data collection process. There were no restrictions on the duration of vehicle use; drivers were free to drive as much as they wished while recordings were collected. The characteristics of the drivers are detailed in Table 2.
Table 2. Driver characteristics
|
Driver # |
Gender |
Duration of Drive (min) |
Age |
|
Driver_1 |
Male |
120 |
38 |
|
Driver_2 |
Male |
130 |
28 |
|
Driver_3 |
Male |
130 |
29 |
|
Driver_4 |
Male |
25 |
25 |
|
Driver_5 |
Female |
25 |
43 |
|
Driver_6 |
Male |
25 |
44 |
|
Driver_7 |
Female |
40 |
41 |
|
Driver_8 |
Female |
45 |
35 |
|
Driver_9 |
Female |
60 |
34 |
Different types of machine learning algorithms, such as Random Forest, XGBoost, Decision Trees, K-Nearest Neighbors (KNN), and Support Vector Machines (SVM), were used and compared. The machine learning algorithms utilize ECG data that is simultaneously collected from the drivers and signals from the test vehicles as their dependent and independent variables, respectively. These signals include the following: steering angle, steering speed, steering torque, throttle gradient, engine torque, vehicle speed, throttle position, throttle on/off status, brake application status, and sudden braking responses. The CANalyzer software is used to process the signals that have been gathered. The names and brief descriptions of the signals read from the vehicle's CAN-Bus communication network are presented in detail in Table 3.
Table 3. Signal characteristics
|
Signal Name |
Description |
|
Steering Angle |
It indicates the steering wheel angle. (Counterclockwise is positive) |
|
Steering Speed |
It indicates the steering wheel speed. (Counterclockwise is positive) |
|
Steering Column Torque |
It detects the torque force applied by the driver to the steering wheel from the Electric Power Steering module |
|
Engine Torque |
It indicates the engine torque |
|
GasPedal Action |
It indicates whether the driver is pressing the accelerator pedal. It takes a value of 0 or 1(0 is Not_Pressed, 1 is Pressed) |
|
GasPedal Gradient |
It indicates the rate of change of the accelerator pedal position over time, measured in percentage per second (%/s) |
|
Engine Speed |
It indicates the engine speed (RPM) |
|
Gas Pedal Position |
It indicates the positions of the accelerator pedal at the moment the driver presses it. (From 0% to 100%) |
|
Transmission Status |
It indicates whether the transmission is in neutral or not |
|
BrakePedal Switch Status |
It provides information on whether the brake pedal is pressed or not. The signal takes a value of 1 when the pedal is not pressed and 0 when it is pressed |
|
ABS Active Status |
A signal that controls whether the ABS system is activated or not |
|
Brake Intervention Status |
Brake responses other than those from the driver, such as ACC (Adaptive Cruise Control), ESC (Electronic Stability Control), and ASR (Acceleration Slip Regulation) |
|
Emergency Braking System Status |
It indicates whether the emergency braking system is activated or not |
|
ESC Active Status |
A signal that checks whether the ESC (Electronic Stability Control) system is activated or not |
|
Vehicle Speed |
It indicates the vehicle speed |
|
Lateral Acceleration |
It represents the lateral acceleration of the vehicle (X-axis, Figure 1(a)) |
|
Longitude Acceleration |
A signal that shows the forward-backward acceleration (Y-axis, Figure 1(a)) |
|
Z Acceleration |
It represents the vehicle’s acceleration along the Z-axis. The rollover sensor checks the vehicle’s rollover status and other related conditions (Figure 1(a)) |
|
Steering Angle |
It indicates the steering wheel angle (Counterclockwise is positive) |
Figure 1. Coordinate systems of a vehicle and data collection equipment
2.2 Method and data collection
The simultaneous collection of ECG data and CAN-Bus signals was carried out by using the blue PiraT Mini device, as shown in Figure 1(b). The blue PiraT Mini allows for the simultaneous reading of both analog data and CAN data. The ECG data from the drivers was collected using the MaM Sense ECG module, as shown in Figure 1(c).
Figure 2 illustrates an electrocardiogram (ECG) module-based system for tracking a driver's physiological condition. Electrodes positioned on the chest allow the ECG module, which is powered by a 9V battery, to record the electrical activity of the heart. The "blue PiraT Mini" processing unit receives the data gathered by the ECG module alongside process the ECG signals. The processed data can track the driver's health and affect how the vehicle operates. For example, if the driver's heart activity suggests they are distressed or sleepy, the car issues an alert or implements control mechanisms.
Figure 2. Diagram of the ECG module and blue PiraT Mini
The number of classes for the dependent variable "driver drowsiness" is required to be determined considering the main objective of this study is to measure driver drowsiness based on ECG and CAN-Bus data. Hence, to identify the class types of the algorithms and analyze the ECG data, machine learning algorithms, Kubios Software, and MATLAB programs were utilized.
The Amplitude-Based Technique (ABT) was utilized to identify the R waves of the electrocardiogram (ECG) signal. The R waves have significance because they form a part of the QRS complex, which is crucial to comprehending cardiac rhythms [51]. The ABT method seeks for ECG signal intervals where the amplitude is higher than the preset threshold. These intervals are thus assumed to be likely QRS complexes, representing the electrical activity associated with the ventricles' depolarization throughout each heartbeat. The three primary deflections that comprise the QRS complex are the Q, R, and S waves [51]. The most prominent of them is the R wave, which is necessary for a precise assessment of heart rate. The method then concentrates on figuring out each complex's peak after recognizing the QRS complexes. The R peak, which is the QRS complex's maximum amplitude point, is a crucial signal for more investigation. Accurate R peak detection is essential for assessing heart rate variability and locating potential arrhythmias [51]. For this study, the R-R interval distances were computed using a sample dataset. Calculated R-R intervals, which quantify the intervals between consecutive R-wave peaks in ECG signals, are included in the data along with corresponding values that represent the measurement or uncertainty for each interval. To illustrate the precision or error in the measurements, the R-R intervals, for instance, range from 0.28 to 23.19 seconds, and the associated values, from 0.51 to 1.50.
Once the R-R interval distances were established, the data were processed using Kubios software for HRV (Heart Rate Variability) analysis. The HRV analysis program Kubios was utilized to evaluate the variability in the heartbeat intervals. This analysis has to be carefully considered in order to identify the classes that were used in the machine learning phase of the study. The classes were classified as 0, 1, and 2 based on the calculation of the PNS (Parasympathetic Nervous System) and SNS (Sympathetic Nervous System) index in the frequency domain, which was acquired from the R-R interval values analyzed using Kubios software.
The estimated signal's power frequency distribution (low frequency (LF), high frequency (HF), and LF/HF) is known to have an impact on the estimation of frequency-domain characteristics. When under stress, the heart rate (HR) is lowered by the parasympathetic (vagus) nervous system and elevated by the sympathetic nervous system [52]. In this instance, increased parasympathetic activity is associated with higher PNS index values, indicating better autonomic function and a more relaxed state [53]. However, other studies have explored the idea that a high LF/HF ratio denotes sympathetic dominance, which may be associated with fatigue [54].
The LF/HF ratios were computed every three minutes using standard HRV analysis techniques. To accelerate the classification process and prevent the creation of an excessive number of categories, the resulting SNS index values were rounded to the nearest integer (e.g., 2.55 rounded to 3; 4.37 to 4).
Although drowsiness is typically associated with declining vigilance and cognitive performance, physiological studies have shown that sympathetic nervous system (SNS) activity may increase during the early or intermediate stages of drowsiness. This phenomenon is interpreted as a compensatory arousal response, where the body attempts to maintain wakefulness despite increasing fatigue [54]. According to the Kubios HRV documentation, elevated SNS index values reflect heightened sympathetic tone, often linked to mental effort, stress, or alertness [Kubios HRV Blog, 2023, https://www.kubios.com/blog/hrv-ans-function/].
Based on this understanding, we categorized SNS index values of 0–1 as “not drowsy,” 2 as “slightly drowsy,” and ≥3 as “drowsy,” reflecting a progressive increase in physiological strain as drowsiness intensifies. These categories are presented in Table 4.
Table 4. SNS index categories
|
Rounded Stress Value Index |
Class |
|
0 and 1 |
0 (Not drowsy) |
|
2 |
1 (Slightly drowsy) |
|
3,4, and 5 |
2 (Drowsy) |
In addition, CAN-Bus signal data were recorded at 500-millisecond intervals. To synchronize the physiological labeling with vehicular data, the 3-minute LF/HF-based SNS classifications were mapped onto the corresponding CAN-Bus samples. This alignment allowed for the integration of objective drowsiness labels with high-resolution vehicular data for use in machine learning models.
Following the pre-defined classes described in Table 4, the study used conventional machine learning algorithms, such as XGBoost, K-Nearest Neighbor (K-NN), Decision Tree, Support Vector Machine (SVM), and Random Forest, to detect driver drowsiness.
XGBoost Algorithm: Extreme Gradient Boosting, or XGBoost, is a model that was initially put forth by Tianqi Chen and Carlos Guestrin in 2011. Many researchers have since followed up on this framework by continuously optimizing and improving it [55]. The model is an approach to learning that is derived from Boosting Tree models. Only the first derivative information is used in the conventional Boosting Tree models. Because the residual of the previous n-1 trees is used for training the nth tree, distributed training is challenging to implement. XGBoost automatically capitalizes on of the CPU's multithreading capacity and expands the loss function by a factor of two in order to perform parallel computing. Moreover, XGBoost uses multiple methods to avoid overfitting [56].
K-NN (K-Nearest Neighbor) Algorithm: A simple yet effective machine learning approach is K-Nearest Neighbor (K-NN) for classification and regression applications. The basic principle of k-NN is to classify or predict a data point by using the majority vote or average of its k nearest neighbors in the feature space. It operates on the tenet that comparable instances usually have equivalent output values or belong to the same class, according to the study by Cover and Hart [57]. The K-NN algorithm consists of several significant steps [58]. The initial stage of the dataset preprocessing entails scaling features, filling in missing values, and encoding categorical variables. Following that, initializing the option k specifies how many of the closest neighbors are to be taken into account. Each individual point in the training dataset and every new data point are measured using a selected metric, like the Manhattan or Euclidean distance. The majority class label can be found among the k nearest neighbors based on these distances. In cases of ties, a tie-breaking rule is applied. The majority class label is obtained by the new data point, and all the data points in the test dataset go through this process.
Decision Tree Algorithm: Decision trees divide the feature space into discrete regions and apply class labels or regression values to these regions. They are widely used in machine learning for both regression and classification applications. The first step in the procedure is to form the tree, in which each internal node represents a feature, the branches stand for judgments made using that feature, and the leaf nodes represent the final class labels or regression results [59]. Models are fitted at each leaf in the regression process in order to predict continuous values. After that, the tree is optimized and pruned to improve generalization and decrease overfitting. As demonstrated by ensemble techniques like Random Forests, it is possible to mix many trees for better performance and produce a more robust prediction model [60].
SVM (Support Vector Machine) Algorithm: Support Vector Machine (SVM) is a robust supervised learning technique that divides data points into distinct classes for classification problems by identifying the optimal hyperplane in the feature space [61]. To maximize the margin between classes, the algorithm first initializes the parameters and then chooses two Lagrange multipliers. Next, in order to more effectively separate the classes, it computes the error and kernel values for these multipliers, updates them in light of the computed values, and modifies the bias term. A convergence check is part of the process to see if the optimization requirements are satisfied. Once convergence is attained, this iterative process is repeated to produce the final hyperplane, which maximizes the margin and minimizes classification errors [62].
Random Forest Algorithm: The Random Forest algorithm, as detailed by Breiman [63], involves several key steps to build a robust ensemble model. First, using a technique called bootstrap sampling, N samples are chosen at random from the dataset using replacement. A decision tree is built for each of these samples. A random subset of all the features in the feature set is selected at each node of the tree, and the node is split according to the feature that provides the best split criterion, like information gain or Gini impurity. To create a diverse forest of trees, this decision tree building process is repeated several times. To make predictions, the algorithm aggregates the outputs from all the individual trees: for classification tasks, it employs majority voting to determine the class with the highest number of votes, while for regression tasks, it calculates the average of the predictions from all the trees. This ensemble approach enhances the model's accuracy and reduces overfitting compared to a single decision tree [63].
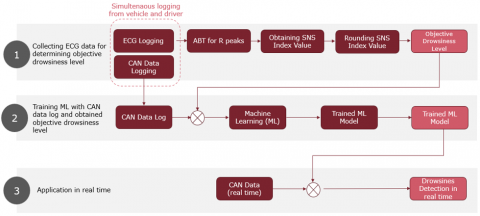
Figure 3 illustrates the three-phase structure of the proposed model: (1) data collection, (2) model training, and (3) real-time application. In the first phase, simultaneous ECG and CAN-Bus data are collected. The ECG signals are processed using the ABT (Automatic Beat Tracking) algorithm to extract R peaks. These peaks are used to compute the SNS (Sympathetic Nervous System) index, a physiological marker associated with alertness and drowsiness. The SNS index is then rounded and used to derive an objective drowsiness level, which serves as the target label for supervised machine learning. In the second phase, the CAN-Bus data is synchronized with the labeled drowsiness levels, and several machine learning models are trained to predict drowsiness based solely on vehicular signals. Finally, in the third phase, the trained model is applied in real time using only CAN-Bus data, making the system fully deployable without the need for physiological sensors in actual driving scenarios.
Figure 3. The proposed approach
This study used a variety of machine learning models to conduct a classification analysis on a dataset gathered for a driver fatigue detection system. XGBoost, K-Nearest Neighbor (K-NN), Decision Tree, Support Vector Machine (SVM), and Random Forest were among the models that have been tested to the test. The performance of each model was assessed and contrasted with the others based on the best possible parameter combinations.
XGBoost Algorithm Results: Various parameter combinations are used in the application of the XGBoost algorithm. These parameters are the number of estimators, learning rate, maximum depth, subsample, and colsample_bytree (which controls the proportion of features used for each tree). The optimal results were obtained with 450 estimators, a learning rate of 0.01, a maximum depth of 8, and a subsample and colsample_bytree both set to 0.9, yielding a training accuracy of 0.8077, a validation accuracy of 0.7836, and a cross-validation mean score of 0.7846.
Results indicate that the model's performance for Class 0 performs the best when compared to the other classes. Only 390 instances of Class 0 were misclassified out of 13,928 instances that were correctly classified. The high recall (97%) and precision (79%) values support this, yielding an F1 score of 87%. This suggests that the model is highly proficient in identifying and accurately categorizing Class 0. The model's performance for Class 1 was notably poor with 3,173 instances misclassified compared to 1,411 correctly classified. The primary issue was confusion with 2,721 instances of Class 0 and 452 instances of Class 2, leading to a recall of 31%, precision of 82%, and a weak F1-score of 45%. Class 2 also demonstrated moderate performance, with 1,704 correct and 1,205 incorrect classifications. The F1-score for Class 2 was 64%, with a recall of 59% and precision of 71%, affected by confusion with 1,026 instances of Class 0 and 179 instances of Class 1. Overall, the model's macro-average precision was 77%, recall 62%, and F1-score 65%, indicating notable limitations, particularly with Class 1.
Despite an overall accuracy of 78%, the weighted average F1-score fell to 75% due to classification errors in Class 1 and Class 2.
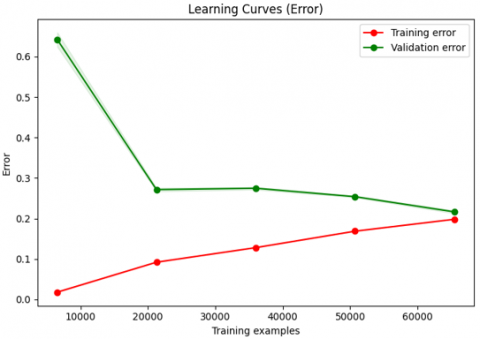
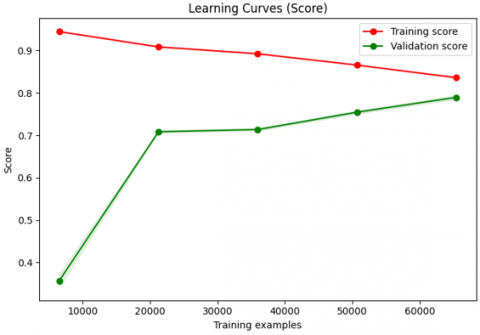
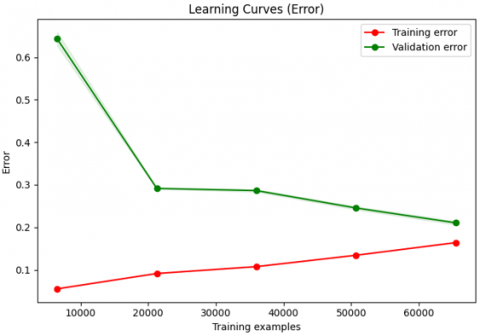
The learning curves for the XGBoost model are depicted in Figure 4, where the "Learning Curves (Score)" graph indicates a slight decline in training performance over time, despite the initial high performance. The model's successful adaptation to the training data is indicated by the training score, which stays high but gradually drops. On the other hand, with more data, the validation score increases dramatically from roughly 35% to about 80%, indicating improved generalization abilities. The "Learning Curves (Error)" graph illustrates how, as more data is added, the validation error rapidly drops, indicating improved model performance and generalization, while the training error stays low with a slight increase.
Figure 4. XGBoost learning curves
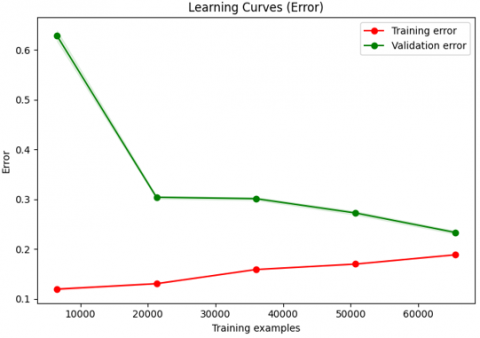
Figure 5. KNN learning curves
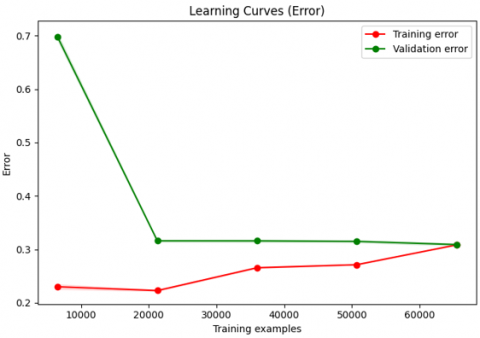
Figure 6. Decision tree learning curves
Figure 7. SVM learning curves
Figure 8. Random forest learning curves
K-NN (K-Nearest Neighbor) Algorithm Results: A variety of parameter combinations, such as the number of neighbors, distance metric, p value, and weights, are used to assess the KNN algorithm's results. For instance, the model obtained some of the best results when it was trained with uniform weights and the Manhattan distance metric with five neighbors. Its accuracy values were 0.7556, 0.7556 for validation, 0.8343 for training, and 0.7661 for cross-validation.
According to the results, the model performed well in classifying Class 0, with high precision (0.79), recall (0.92), and an F1-score (0.85). However, due primarily to significant confusion with Class 0, its performance for Class 1 was noticeably worse, with low recall (0.36), F1-score (0.46), and precision (0.63). Class 2 performed moderately, with an F1-score of 0.60, a recall of 0.57, and a precision of 0.64. With a precision of 0.69, recall of 0.62, and an F1-score of 0.64 overall, the macro-average metrics showed satisfactory results for Class 0 but difficulties with Class 1 and Class 2.
The model's learning curves are shown in Figure 5. The "Learning Curves (Score)" graph indicates that training performance is high at first (about 90%), but it declines as the dataset grows, possibly due to overfitting. On the other hand, the validation score indicates improved generalization; it begins low (about 40%) but gets better and stabilizes at about 80% with additional data. The "Learning Curves (Error)" graph illustrates how the validation error starts out high (about 65%) but dramatically decreases to about 20% as the dataset grows, while the training error stays low and only slightly increases with more data. These patterns demonstrate how the model performs best on training data at first and gets better at generalizing to validation data as the volume of data increases.
Decision Tree Algorithm Results: The Decision Tree algorithm's output is assessed using various splitters, criteria, and hyperparameter configurations. For instance, the model achieved among the highest scores of 0.911, 0.773, and 0.7834 for the cross-validation mean score and training accuracy when using the Gini criterion with a maximum depth of 18, a minimum samples split of 9, and no restrictions on min samples leaf and max features.
With 13,050 accurate classifications and only 1,268 incorrect classifications on Class 0, the model performs well, yielding high precision (0.80), recall (0.93), and an F1-score of 0.86. Class 1 performs worse, with 2,084 accurate classifications but over 2,500 incorrect classifications, including 2,060 instances incorrectly classified as Class 0. Low recall (0.40), precision (0.67), and an F1-score of 0.50 result from this, indicating difficulties in correctly identifying Class 1. With 1,744 correct and 1,165 misclassified cases for Class 2, the model's performance is average; it produces a precision of 0.65, a recall of 0.58, and an F1-score of 0.61. This suggests that Class 2 is recognized more strongly than Class 1 but not as strongly as Class 0.
The model's learning curves are displayed in Figure 6, which also shows the model's consistent performance during cross-validation and training. As more samples were added, the model's training performance only slightly decreased to about 80%, as shown by the "Score" graph, indicating stable training success. After starting low at 30%, the validation score quickly increased to over 75%, indicating strong generalization and little overfitting. These results are further supported by the "Error" graph, which shows that while validation error initially started out high and eventually dropped to about 20% with additional data, training error remained low and only slightly increased. The model's strong generalization ability is highlighted by the narrow difference between training and validation errors.
SVM Algorithm Results: The results of the SVM algorithm are assessed with various gamma settings, C values, and kernel types. For instance, the model achieved the best performance among the tested configurations with the RBF kernel, C value of 2, and gamma set to scale, resulting in a training accuracy of 0.7189, validation accuracy of 0.7153, and cross-validation accuracy of 0.6581.
Model performance demonstrates remarkable performance in classifying Class 0 with 14,306 accurate classifications and only 12 incorrect classifications. Consequently, the F1-score is 0.82 and the recall is perfect at 1.00; however, the precision for Class 0 is only 0.69. On the other hand, the model does not work well for Class 1 or Class 2. Class 1 only has 403 correct classifications, a recall of 0.09, an F1-score of 0.15, and a precision of 0.56. Class 2 presents comparable problems, with 271 accurate classifications, a precision of 0.73, a recall of 0.09, and an F1-score of 0.17, demonstrating challenges in class distinction. Overall, there is minor class differentiation as evidenced by the macro-average precision, recall, and F1-score of 0.66, 0.39, and 0.38, respectively. The weighted average values indicate an overall accuracy of 0.69, but the model's performance on Class 1 and Class 2 has lowered the F1-score to 0.59.
It is evident from looking at the "Score" graph on the left side of Figure 7 that while the model performs better on the training set, its performance on the validation set is still lower than its training score. The validation score first rises quickly before decreasing at the same 70% level, while the training score stays stable at around 70%. The model fits the training data well, but it does not perform as well on the validation data, as shown by the difference in scores between training and validation. This implies that the model's ability to generalize beyond the validation data may be restricted.
Random Forest Algorithm Results: The number of estimators, max depth, min samples split, min samples leaf, and max features are among the parameter configurations for which the Random Forest algorithm results are evaluated. For instance, the model achieved some of the highest performance metrics in the dataset, including training accuracy of 0.9725, validation accuracy of 0.8346, and cross-validation mean score of 0.8427, with 350 estimators, max depth of 20, min samples split of 4, min samples leaf of 2, and max features set to sqrt.
The Random Forest model performs exceptionally well in classifying Class 0, with 13,896 correct classifications and only 422 misclassifications. This leads to a robust F1-score of 0.88, high recall (0.97), and high precision (0.81). Class 1's F1-score is 0.53, but despite having a high precision of 0.86, its recall is significantly lower at 0.39, suggesting that misclassifications occur frequently. With Class 2, the model exhibits superior performance, demonstrating a balanced recognition ability with an F1-score of 0.68, recall of 0.65, and precision of 0.73. The F1-score, recall, and macro-average precision are 0.80, 0.67, and 0.70, respectively, indicating areas that require improvement, especially for Class 1. With precision at 0.81, recall at 0.80, and an F1-score of 0.78, the weighted averages indicate acceptable overall performance. This is indicative of the model's high accuracy but poor performance for Class 1.
The Random Forest model performs exceptionally well on the training set, as shown in Figure 8. As more data is added, the model stabilizes at about 85%, indicating effective training data fitting. The model starts with a training score of about 95%. The validation score, which starts out low at roughly 30% and rises quickly to about 80%, indicates strong generalization. Figure 8's "Learning Curves (Error)" graph illustrates how validation error falls from a peak of 60% to a stable range of 20–25%, while training error stays low at 10%. These patterns suggest that there is little overfitting and good overall performance in the model, which fits the training data well and generalizes well with a small difference between training and validation scores.
In this study, five machine learning algorithms (Random Forest, XGBoost, k-Nearest Neighbors, Support Vector Machine, and Decision Tree) were chosen due to their complementary strengths and proven success in related driver state classification tasks [64]. Random Forest and XGBoost are ensemble tree-based methods that handle noisy, high-dimensional data effectively and capture complex non-linear feature interactions, often yielding high accuracy in physiological signal classification [65]. SVM is included for its robust performance on smaller datasets and in high-dimensional feature spaces, which has made it a popular choice in ECG-based fatigue/drowsiness detection [35]. KNN offers a simple, instance-based learning approach that serves as a strong baseline and performs well in recognizing patterns based on feature proximity; it has likewise been employed in driver monitoring studies alongside other classifiers [64]. Lastly, a standalone Decision Tree provides an interpretable model for drowsiness classification, as it can model non-linear decision boundaries and offer insight into feature importance – a property leveraged in prior driver drowsiness detection studies [64]. The selection of these algorithms is consistent with the literature, where such classifiers are commonly applied to vehicular and physiological signal classification problems for driver state monitoring [35, 64].
Results of the machine learning algorithms—XGBoost, K-Nearest Neighbors (KNN), Decision Tree, Support Vector Machine (SVM), and Random Forest—are compared in the Table 5 based on several performance metrics, including recall, precision, training accuracy, validation accuracy, and F1-score. In terms of robustness and balanced performance on unseen data, Random Forest demonstrates the highest training accuracy (0.8508) and validation accuracy (0.8042), along with strong precision (0.81), recall (0.80), and F1-score (0.78). In comparison to Random Forest, the Decision Tree algorithm performs better in terms of precision (0.75), recall (0.77), and validation accuracy (0.8143). However, its training accuracy (0.7687) is lower. When compared to Random Forest, KNN exhibits the highest validation accuracy (0.8049), but it has a lower training accuracy (0.7544), slightly lower precision, and recall. XGBoost exhibits a training accuracy that is lower than the best-performing models, but it still shows a respectable validation accuracy (0.7836) with balanced precision and recall. In comparison to the other models, the SVM model exhibits the lowest training (0.6894) and validation accuracies (0.6867), but it also has the lowest precision (0.67), recall (0.69), and F1-score (0.59), indicating that it has difficulty generalizing. This comparison shows that while Random Forest consistently outperforms KNN and Decision Tree in terms of validation performance, SVM might need more tweaking or adjusting to achieve better results.
To better understand which vehicle parameters were most influential in the detection of driver drowsiness, we conducted a feature importance analysis using the Random Forest classifier. Figure 9 displays the top CAN-Bus signals ranked by their relative contribution to the model’s classification performance.
The most influential signals were:
Engine Speed
Vehicle Speed
Engine Torque
These signals reflect changes in engine performance and speed control, which are closely associated with the driver’s level of alertness. A decrease in engine speed or torque, for example, may indicate delayed reactions or reduced control effort, which are signs of drowsiness.
Other highly ranked signals include:
Steering Angle: Represents the rotation angle of the steering wheel; deviations in steering precision may reflect fatigue.
Gas Pedal Position: The position of the accelerator pedal at the time of pressing; irregular or reduced usage may indicate reduced engagement.
Lateral and Longitudinal Acceleration: Represent side-to-side and forward-backward motion; reduced variability may indicate decreased driving activity.
Steering Column Torque: Measures the torque applied by the driver to the steering wheel; lower torque fluctuations may be associated with reduced steering corrections due to fatigue.
These signals collectively provide insight into how the driver interacts with the vehicle under varying levels of alertness. Particularly, parameters like Steering Angle and Steering Column Torque reflect real-time steering control effort, making them valuable indicators in drowsiness detection.
As seen in Table 1, the studies on ECG in the Web of Science (WoS) database [6] have been examined in detail. In most of the studies in the literature, ECG is generally not used in a hybrid way with vehicle measurement data, but rather integrated with behavioral measurements. In these studies, it is seen that face recognition and ECG data are combined and used for drowsiness detection. The combined use of ECG and face recognition methods has achieved remarkably high success rates in drowsiness detection. For instance, Chang et al. [32] achieved a 97.97% accuracy rate by combining AHP and machine learning techniques. Sukumar et al. [34] achieved a 97.30% accuracy rate. However, it is known that the face recognition method has some disadvantages, such as racial characteristics in the facial structure, the use of glasses or masks, etc. may prevent face recognition technology from always providing promising results. In addition, these studies in the literature generally classify drowsiness as either “drowsiness” or “non-drowsiness” rather than dividing it into different classes as in this study. Therefore, it is likely that these studies will reach high accuracy values.
Additionally, many studies in the literature have actually focused on developing state-of-the-art driver drowsiness monitoring systems. For example, Linschmann et al. [45] designed a portable cushion to measure ECG. Wolkow et al. [43] tried to use a wristband for heart rate measurement. Muramatsu and Sasaki [44] measured ECG with conductive electrodes placed on the steering wheel and capacitive electrodes on the seat. Most of these studies are research aimed at improving ECG measurement technologies rather than measuring drowsiness performance and aimed to increase the accuracy of ECG measurements.
In our study, by examining both ECG and CAN-Bus data, an integrated measurement classification was performed, unlike a system based only on ECG. In this way, drowsiness detection was attempted without the need for ECG data, based only on CAN-Bus data, and the classification performances were analyzed. In some studies, as in our study, drowsiness was measured by dividing it into different classes. For instance, utilizing ECG and respiratory data, Ebrahimian et al. [37] achieved 91% performance in three-class and 67% in five-class drowsiness detection. However, in our study, 85% performance was achieved in three-class drowsiness detection with more parameters using both ECG and CAN-Bus data. In addition, this system has a more suitable structure for industrial usage. Murugan et al. [38] used only ECG data to obtain 58.3% performance in five-class drowsiness detection. These findings demonstrate that, by utilizing an integrated strategy and additional characteristics, our study yields more comprehensive results.
Table 5. Comparison of performance metrics of algorithms
|
Algorithm |
Training Accuracy |
Validation Accuracy |
Precision |
Recall |
F1 Measure |
|
XGBoost |
0.8077 |
0.7836 |
0.78 |
0.78 |
0.75 |
|
KNN |
0.8049 |
0.7544 |
0.74 |
0.76 |
0.74 |
|
Decision tree |
0.8143 |
0.7687 |
0.75 |
0.77 |
0.75 |
|
SVM |
0.6894 |
0.6867 |
0.67 |
0.69 |
0.59 |
|
Random Forest |
0.8508 |
0.8042 |
0.81 |
0.8 |
0.78 |
Figure 9. Feature importances in drowsiness detection using random forest classifier
In contrast to existing approaches that either use physiological measurements or data from the vehicle, this study offers a more thorough and precise method of detecting driver drowsiness by combining both ECG data and CAN-Bus signals. Utilizing machine learning methods, particularly classification algorithms, the study was able to classify driver fatigue into three different categories. The system's 85% accuracy rate represented a substantial advance over previous research that relied solely on ECG data, where accuracy rates were frequently lower, typically less than 70% in the case of multi-class drowsiness detection. This indicates how well the hybrid technique works to improve drowsiness detection performance, which makes it more useful for driving in actual situations.
The methodology included gathering physiological and vehicle-related components in real-time under a range of traffic and environmental circumstances from several drivers. Heart rate variability (HRV), a crucial indication of tiredness, was obtained via ECG measures, while critical vehicle metrics like speed, steering wheel tilt, and braking pressure were obtained from CAN-Bus data. The study revealed that merging physiological and vehicle-based factors results in a more robust system capable of providing prompt and reliable drowsiness detection by incorporating these combined data sources into machine learning models. By enhancing detection accuracy and providing up opportunities for practical applications in vehicle safety systems, this approach delivers a substantial contribution to the development of intelligent driver monitoring technology.
The data collected within the scope of this study were collected from the participants at different times and were not collected under equal conditions due to traffic density. Although 10 hours of data collection time seems sufficient in the literature, it is thought that this period should be extended in order to increase the performance of the study and to generalize it. In addition, although the results obtained from the traditional machine learning applications used in this study are good results when compared to the literature, it is possible to obtain better results. This can be achieved by trying heuristic/metaheuristic hybrid methods.
One notable limitation of this study is the imbalance between drowsiness classes in the dataset, particularly the lower number of samples labeled as “slightly drowsy” (Class 1). This imbalance likely contributed to reduced classification performance in this category. While collapsing the three classes into a binary structure (“drowsy” vs. “not drowsy”) might have improved overall model accuracy, the three-class framework was deliberately chosen to explore the detection of early-stage fatigue. Identifying partial drowsiness is considered critical for preventive driver safety interventions. Future work will aim to address this imbalance through targeted data collection and synthetic augmentation strategies.
In line with these limitations, it is planned to collect more data in future studies and re-evaluate these data with hybrid methods. In future phases of this project, the proposed model will be tested in real vehicle environments using embedded computing platforms such as NVIDIA AGX Orin. Additional data will be collected from a more diverse group of drivers across different age ranges. Integration with ADAS systems and real-time evaluation under natural driving conditions will allow for more comprehensive performance assessment and validation of the model’s practical utility.
Furthermore, future work will focus on optimizing the model for embedded platforms by addressing real-time inference constraints, processing power, memory limitations, and cost-effectiveness to ensure reliable deployment in production vehicles.
[1] TSI. (2022). Road Traffic Accident Statistics. https://www.tuik.gov.tr/.
[2] Saleem, S. (2022). Risk assessment of road traffic accidents related to sleepiness during driving: A systematic review. Eastern Mediterranean Health Journal, 28(9): 695-700. https://doi.org/10.26719/emhj.22.055
[3] Singh, S. (2018). Critical reasons for crashes investigated in the National Motor Vehicle Crash Causation Survey. Traffic Safety Facts-Crash Stats. http://www-nrd.nhtsa.dot.gov/Pubs/812115.pdf.
[4] Sahayadhas, A., Sundaraj, K., Murugappan, M. (2012). Detecting driver drowsiness based on sensors: A review. Sensors, 12(12): 16937-16953. https://doi.org/10.3390/s121216937
[5] NHTSA. (1998). Drowsy Driving and Automobile Crashes. National Center on Sleep Disorder Research and the National Highway Traffic Safety Administration, Howe, USA. https://www.nhtsa.gov/sites/nhtsa.gov/files/808707.pdf.
[6] Guo, F., Zhou, Y., Wang, X., Li, W., Cai, J. (2024). Literature review of driving fatigue research based on bibliometric analysis. Journal of Traffic and Transportation Engineering (English Edition), 11(6): 1401-1409. https://doi.org/10.1016/j.jtte.2024.03.005
[7] Ngxande, M., Tapamo, J.R., Burke, M. (2017). Driver drowsiness detection using behavioral measures and machine learning techniques: A review of state-of-art techniques. In 2017 Pattern Recognition Association of South Africa and Robotics and Mechatronics (PRASA-RobMech), Bloemfontein, South Africa, pp. 156-161. https://doi.org/10.1109/RoboMech.2017.8261140
[8] Chowdhury, A., Shankaran, R., Kavakli, M., Haque, M.M. (2018). Sensor applications and physiological features in drivers’ drowsiness detection: A review. IEEE Sensors Journal, 18(8): 3055-3067. https://doi.org/10.1109/JSEN.2018.2807245
[9] Stancin, I., Cifrek, M., Jovic, A. (2021). A review of EEG signal features and their application in driver drowsiness detection systems. Sensors, 21(11): 3786. https://doi.org/10.3390/s21113786
[10] Albadawi, Y., Takruri, M., Awad, M. (2022). A review of recent developments in driver drowsiness detection systems. Sensors, 22(5): 2069. https://doi.org/10.3390/s22052069
[11] Albadawi, Y., AlRedhaei, A., Takruri, M. (2023). Real-time machine learning-based driver drowsiness detection using visual features. Journal of Imaging, 9(5): 91. https://doi.org/10.3390/jimaging9050091
[12] El-Nabi, S.A., El-Shafai, W., El-Rabaie, E.S.M., Ramadan, K.F., Abd El-Samie, F.E., Mohsen, S. (2024). Machine learning and deep learning techniques for driver fatigue and drowsiness detection: A review. Multimedia Tools and Applications, 83(3): 9441-9477. https://doi.org/10.1007/s11042-023-15054-0
[13] Singh, J., Kanojia, R., Singh, R., Bansal, R., Bansal, S. (2023). Driver drowsiness detection system: An approach by machine learning application. arXiv preprint arXiv:2303.06310. https://doi.org/10.48550/arXiv.2303.06310
[14] Liu, C.C., Hosking, S.G., Lenné, M.G. (2009). Predicting driver drowsiness using vehicle measures: Recent insights and future challenges. Journal of Safety Research, 40(4): 239-245. https://doi.org/10.1016/j.jsr.2009.04.005
[15] Forsman, P.M., Vila, B.J., Short, R.A., Mott, C.G., Van Dongen, H.P. (2013). Efficient driver drowsiness detection at moderate levels of drowsiness. Accident Analysis & Prevention, 50: 341-350. https://doi.org/10.1016/j.aap.2012.05.005
[16] Soukupová, T., Čech, J. (2016). Eye-blink detection using facial landmarks. Czech Technical University in Prague, Bachelor’s Thesis. https://dspace.cvut.cz/bitstream/handle/10467/64839/F3-DP-2016-Soukupova-Tereza-SOUKUPOVA_DP_2016.pdf.
[17] Knipling, R., Rau, P. (1998). PERCLOS: A valid psychophysiological measure of alertness as assessed by psychomotor vigilance. Federal Highway Administration (FHWA), Office of Motor Carrier. https://rosap.ntl.bts.gov/view/dot/113/dot_113_DS1.pdf.
[18] Pan, G., Sun, L., Wu, Z., Lao, S. (2007). Eyeblink-based anti-spoofing in face recognition from a generic webcamera. In 2007 IEEE 11th International Conference on Computer Vision, pp. 1-8. https://doi.org/10.1109/ICCV.2007.4409068
[19] Zainal, M.S.B., Khan, I., Abdullah, H. (2014). Research article efficient drowsiness detection by facial features monitoring. Research Journal of Applied Sciences, Engineering and Technology, 7(11): 2376-2380. https://doi.org/10.19026/rjaset.7.539
[20] Nakamura, T., Maejima, A., Morishima, S. (2013). Detection of driver's drowsy facial expression. In 2013 2nd IAPR Asian Conference on Pattern Recognition, Naha, Japan, pp. 749-753. https://doi.org/10.1109/ACPR.2013.176
[21] Choi, I.H., Jeong, C.H., Kim, Y.G. (2016). Tracking a driver’s face against extreme head poses and inference of drowsiness using a hidden Markov model. Applied Sciences, 6(5): 137. https://doi.org/10.3390/app6050137
[22] Santamaria, J., Chiappa, K.H. (1987). The EEG of drowsiness in normal adults. Journal of Clinical Neurophysiology, 4(4): 327-382. https://doi.org/10.1097/00004691-198710000-00002
[23] Sun, Y., Yu, X., Berilla, J., Liu, Z., Wu, G. (2011). An in-vehicle physiological signal monitoring system for driver fatigue detection. In 3rd International Conference on Road Safety and Simulation, Indianapolis Indiana, United States. http://onlinepubs.trb.org/onlinepubs/conferences/2011/RSS/1/Sun,Y.pdf.
[24] Thorslund, B. (2004). Electrooculogram analysis and development of a system for defining stages of drowsiness. https://www.diva-portal.org/smash/get/diva2:673960/FULLTEXT01.pdf.
[25] Balasubramanian, V., Adalarasu, K. (2007). EMG-based analysis of change in muscle activity during simulated driving. Journal of Bodywork and Movement Therapies, 11(2): 151-158. https://doi.org/10.1016/j.jbmt.2006.12.005
[26] Ezhumali, M., Ramaniam, V. (2015). Designing for advance identification of inevitable drowsiness using galvanic skin response. In Proceedings of the 11th IRF International Conference, Bengaluru, India, pp. 84–87. https://www.digitalxplore.org/up_proc/pdf/126-142406473056-59.pdf.
[27] Ren, S. (2015). On psycho-physiological player-centric game experiences. Doctoral dissertation, UNSW Sydney. https://doi.org/10.26190/unsworks/17388
[28] Saito, Y., Itoh, M., Inagaki, T. (2016). Driver assistance system with a dual control scheme: Effectiveness of identifying driver drowsiness and preventing lane departure accidents. IEEE Transactions on Human-Machine Systems, 46(5): 660-671. https://doi.org/10.1109/THMS.2016.2549032
[29] Barua, S., Ahmed, M.U., Ahlström, C., Begum, S. (2019). Automatic driver sleepiness detection using EEG, EOG and contextual information. Expert Systems with Applications, 115: 121-135. https://doi.org/10.1016/j.eswa.2018.07.054
[30] Butkevičiūtė, E., Michalkovič, A., Bikulčienė, L. (2022). ECG signal features classification for the mental fatigue recognition. Mathematics, 10(18): 3395. https://doi.org/10.3390/math10183395
[31] Huang, S., Li, J., Zhang, P., Zhang, W. (2018). Detection of mental fatigue state with wearable ECG devices. International Journal of Medical Informatics, 119: 39-46. https://doi.org/10.1016/j.ijmedinf.2018.08.010
[32] Chang, T.C., Wu, M.H., Kim, P.Z., Yu, M.H. (2021). Smart driver drowsiness detection model based on analytic hierarchy process. Sens Mater, 33: 485-497. https://doi.org/10.18494/SAM.2021.3034
[33] Tjolleng, A., Jung, K. (2024). Harnessing electrocardiography signals for driver state classification using multi-layered neural networks. International Journal of Automotive Technology, 26: 327-339. https://doi.org/10.1007/s12239-024-00109-4
[34] Sukumar, N., Sivashankar, B., Sumathi, P., Maurya, O.P. (2024). Physiological and physical sensors for stress level, drowsiness detection, and behaviour analysis. IEEE Transactions on Consumer Electronics, 70(1): 656-668. https://doi.org/10.1109/TCE.2024.3366988
[35] Arefnezhad, S., Eichberger, A., Frühwirth, M., Kaufmann, C., Moser, M., Koglbauer, I.V. (2022). Driver monitoring of automated vehicles by classification of driver drowsiness using a deep convolutional neural network trained by scalograms of ECG signals. Energies, 15(2): 480. https://doi.org/10.3390/en15020480
[36] Esteves, T., Pinto, J.R., Ferreira, P.M., Costa, P.A., Rodrigues, L.A., Antunes, I., Lopes, G., Gamito, P., Abrantes, A.J., Jorge, P.M., Lourenço, A., Sequeira, A.F., Cardoso, J.S., Rebelo, A. (2021). AUTOMOTIVE: A case study on AUTOmatic multiMOdal drowsiness detecTIon for smart VEhicles. IEEE Access, 9: 153678-153700. https://doi.org/10.1109/ACCESS.2021.3128016
[37] Ebrahimian, S., Nahvi, A., Tashakori, M., Salmanzadeh, H., Mohseni, O., Leppänen, T. (2022). Multi-level classification of driver drowsiness by simultaneous analysis of ECG and respiration signals using deep neural networks. International Journal of Environmental Research and Public Health, 19(17): 10736. https://doi.org/10.3390/ijerph191710736
[38] Murugan, S., Selvaraj, J., Sahayadhas, A. (2020). Detection and analysis: Driver state with electrocardiogram (ECG). Physical and Engineering Sciences in Medicine, 43(2): 525-537. https://doi.org/10.1007/s13246-020-00853-8
[39] Babusiak, B., Hajducik, A., Medvecky, S., Lukac, M., Klarak, J. (2021). Design of smart steering wheel for unobtrusive health and drowsiness monitoring. Sensors, 21(16): 5285. https://doi.org/10.3390/s21165285
[40] Perkins, E., Sitaula, C., Burke, M., Manousakis, J., Anderson, C., Marzbanrad, F. (2023). Investigating physiological and behavioural sensing modalities towards drowsiness detection. IEEE Sensors Journal, 23(23): 29513-29524. https://doi.org/10.1109/JSEN.2023.3326434
[41] Fujiwara, K., Iwamoto, H., Hori, K., Kano, M. (2023). Driver drowsiness detection using RR interval of electrocardiogram and self-attention autoencoder. IEEE Transactions on Intelligent Vehicles, 9(1): 2956-2965. https://doi.org/10.1109/TIV.2023.3308575
[42] Kundinger, T., Sofra, N., Riener, A. (2020). Assessment of the potential of wrist-worn wearable sensors for driver drowsiness detection. Sensors, 20(4): 1029. https://doi.org/10.3390/s20041029
[43] Wolkow, A.P., Rajaratnam, S.M., Wilkinson, V., Shee, D., Baker, A., Lillington, T., Roest, P., Marx, B., Chew, C., Tucker, A. and Haque, S. (2020). The impact of heart rate-based drowsiness monitoring on adverse driving events in heavy vehicle drivers under naturalistic conditions. Sleep Health, 6(3): 366-373. https://doi.org/10.1016/j.sleh.2020.03.005
[44] Muramatsu, D., Sasaki, K. (2021). Noise reduction using a triple-layer electrode in conductive/capacitive hybrid electrocardiogram measurement. Sensors and Materials, 33(12): 4105-4111. https://doi.org/10.18494/SAM.2021.3591
[45] Linschmann, O., Uguz, D.U., Romanski, B., Baarlink, I., Gunaratne, P., Leonhardt, S., Walter, M., Lueken, M. (2023). A portable multi-modal cushion for continuous monitoring of a driver’s vital signs. Sensors, 23(8): 4002. https://doi.org/10.3390/s23084002
[46] Seok, W., Yeo, M., You, J., Lee, H., Cho, T., Hwang, B., Park, C. (2020). Optimal feature search for vigilance estimation using deep reinforcement learning. Electronics, 9(1): 142. https://doi.org/10.3390/electronics9010142
[47] Du, G., Wang, H., Su, K., Wang, X., Teng, S., Liu, P.X. (2022). Non-interference driving fatigue detection system based on intelligent steering wheel. IEEE Transactions on Instrumentation and Measurement, 71: 1-11. https://doi.org/10.1109/TIM.2022.3214265
[48] Sedik, A., Marey, M., Mostafa, H. (2023). WFT-Fati-Dec: Enhanced fatigue detection AI system based on wavelet denoising and fourier transform. Applied Sciences, 13(5): 2785. https://doi.org/10.3390/app13052785
[49] Yang, C., Ku, G., Jung, J., Choi, J., Kim, K. (2023). A Study of BCG signal-based sleep classification technology through ensemble running signal processing and piezoelectric sensor surface material change. Journal of Electrical Engineering & Technology, 18(5): 3881-3886. https://doi.org/10.1007/s42835-023-01468-1
[50] Devarajan, G.G., Kumaran, U., Chandran, G., Mahapatra, R.P., Alkhayyat, A. (2024). Next generation imaging methodology: An intelligent transportation system for consumer industry. IEEE Transactions on Consumer Electronics, 70(1): 3680-3687. https://doi.org/10.1109/TCE.2024.3372906
[51] Sufi, F., Fang, Q., Cosic, I. (2007). ECG RR peak detection on mobile phones. In 2007 29th Annual International Conference of the IEEE Engineering in Medicine and Biology Society, pp. 3697-3700. https://doi.org/10.1109/IEMBS.2007.4353134
[52] Chen, S., Xu, K., Zheng, X., Li, J., Fan, B., Yao, X., Li, Z. (2020). Linear and nonlinear analyses of normal and fatigue heart rate variability signals for miners in high-altitude and cold areas. Computer Methods and Programs in Biomedicine, 196: 105667. https://doi.org/10.1016/j.cmpb.2020.105667
[53] Berntson, G.G., Thomas Bigger Jr, J., Eckberg, D.L., Grossman, P., Kaufmann, P.G., Malik, M., Nagaraja, H.N., Porges, S.W., Saul, J.P., Stone, P.H., Van Der Molen, M.W. (1997). Heart rate variability: Origins, methods, and interpretive caveats. Psychophysiology, 34(6): 623-648. https://doi.org/10.1111/j.1469-8986.1997.tb02140.x
[54] Freitas, A., Almeida, R., Gonçalves, H., Conceição, G., Freitas, A. (2024). Monitoring fatigue and drowsiness in motor vehicle occupants using electrocardiogram and heart rate− a systematic review. Transportation Research Part F: Traffic Psychology and Behaviour, 103: 586-607. https://doi.org/10.1016/j.trf.2024.05.008
[55] Chen, T., Guestrin, C. (2016). XGBoost: A scalable tree boosting system. In Proceedings of the 22nd ACM Sigkdd International Conference on Knowledge Discovery and Data Mining, New York, United States, pp. 785–794. https://doi.org/10.1145/2939672.293978
[56] Li, W., Yin, Y., Quan, X., Zhang, H. (2019). Gene expression value prediction based on XGBoost algorithm. Frontiers in Genetics, 10: 1077. https://doi.org/10.3389/fgene.2019.01077
[57] Cover, T., Hart, P. (1967). Nearest neighbor pattern classification. IEEE Transactions on Information Theory, 13(1): 21-27. https://doi.org/10.1109/TIT.1967.1053964
[58] Han, J., Pei, J., Tong, H. (2022). Data mining: Concepts and techniques. Morgan Kaufmann.
[59] Quinlan, J.R. (1986). Induction of decision trees. Machine Learning, 1: 81-106. https://doi.org/10.1007/BF00116251
[60] Han, J.W., Kamber, M., Pei, J. (2012). Data Mining: Concepts and Techniques. A Volume in the Morgan Kaufmann Series in Data Management Systems. https://doi.org/10.1016/C2009-0-61819-5
[61] Cortes, C., Vapnik, V. (1995). Support-vector networks. Machine Learning, 20: 273-297. https://doi.org/10.1007/BF00994018
[62] Platt, J.C. (1999). Fast training of support vector machines using sequential minimal optimization. Advances in Kernel Methods, 185-208.
[63] Breiman, L. (2001). Random forests. Machine Learning, 45: 5-32. https://doi.org/10.1023/A:1010933404324
[64] Saleem, A.A., Siddiqui, H.U.R., Raza, M.A., Rustam, F., Dudley, S., Ashraf, I. (2023). A systematic review of physiological signals based driver drowsiness detection systems. Cognitive Neurodynamics, 17(5): 1229-1259. https://doi.org/10.1007/s11571-022-09898-9
[65] Kim, S.H., Son, H.W., Lee, T.M., Baek, H.J. (2025). Drunk driver detection using multiple non-invasive biosignals. Sensors, 25(5): 1281. https://doi.org/10.3390/s25051281