Jikai Huang![]()
© 2025 The author. This article is published by IIETA and is licensed under the CC BY 4.0 license (http://creativecommons.org/licenses/by/4.0/).
OPEN ACCESS
With the rapid growth of e-commerce, the logistics industry is facing increasing demands for automated packaging inspection. The quality of packaging directly affects supply chain efficiency and customer satisfaction. Traditional manual inspection methods can no longer meet the modern logistics industry's requirements for high efficiency and precision. In recent years, deep learning and computer vision technologies have achieved remarkable progress in industrial inspection, emerging as powerful tools for enhancing automated packaging inspection. While existing studies have primarily focused on the application of machine learning algorithms, they still face limitations in accuracy and adaptability under complex logistics conditions. To address these challenges, this paper proposes a novel logistics packaging inspection method based on a two-dimensional flow model. By integrating deep learning and computer vision techniques, the method incorporates a probabilistic distribution transformation module, a global feature extraction module, and a multi-scale feature fusion module to improve detection accuracy and robustness. This approach offers a new perspective for logistics packaging inspection and contributes to the advancement of intelligent logistics systems.
logistics packaging inspection, automation, deep learning, computer vision, two-dimensional flow model, multi-scale feature fusion
With the rapid development of e-commerce, the demand in the logistics industry continues to grow [1, 2], which promotes the rapid development of logistics packaging automation technology [3]. As a key link in commodity distribution, the quality and efficiency of logistics packaging directly affect the operational efficiency of the supply chain and the shopping experience of consumers [4, 5]. Traditional manual inspection methods are inadequate when facing large-scale and high-frequency logistics packaging and are easily affected by human factors [6-9]. Therefore, developing an efficient and automated logistics packaging inspection technology has become an urgent and important issue. In recent years, the application of deep learning and computer vision technology in industrial inspection has shown great potential, especially in image recognition and processing, which provides a new technical path for logistics packaging automation inspection.
Relevant studies show that logistics packaging automation inspection not only helps to improve the stability of packaging quality but also reduces labor costs and improves production efficiency [10-12]. In addition, with the increase of logistics demand, the accuracy and real-time performance of logistics packaging inspection play a decisive role in the competitiveness of enterprises and the efficiency of the supply chain [13]. Therefore, using deep learning and computer vision technology for automated logistics packaging inspection not only has significant economic significance but also can further promote the intelligent and automated process of the logistics industry. Through efficient and accurate inspection technology, better product quality control can be achieved to ensure a good experience for consumers when receiving goods.
Although some progress has been made in automated inspection, the existing methods still have some obvious shortcomings and deficiencies. Most of the existing studies rely on traditional machine learning algorithms such as Support Vector Machine (SVM) [14] and Random Forest (RF) [15], which often perform poorly when dealing with complex and high-dimensional image data, and lack real-time and high-precision detection capabilities. In addition, many studies have not deeply explored how to ensure the robustness and adaptability of the detection model in complex logistics environments. There are certain limitations when the model processes images of different packaging materials and under different environments [16-19]. Therefore, the existing detection methods fail to fully utilize the advantages of deep learning technology when facing diversified and complex practical applications.
This paper aims to propose a new method for automated logistics packaging inspection based on deep learning and computer vision, and to explore its application possibility in practical scenarios by constructing an inspection framework based on a two-dimensional flow model. Firstly, the paper analyzes the basic idea of using the two-dimensional flow model for automated logistics packaging inspection and discusses the advantages of the model in complex scenarios. Secondly, the paper introduces the key modules of the model in detail, including the probabilistic distribution transformation module, the global feature extraction module, and the multi-scale feature fusion module. Through the design of these innovative modules, the paper hopes to solve the problems of accuracy and robustness in diversified packaging inspection. The research results not only help to improve the efficiency and accuracy of logistics packaging inspection technology but also provide valuable theoretical support and technical reference for the intelligent development of the logistics industry.
During the production and transportation processes, logistics packaging is affected by various factors, such as different packaging forms, materials, packaging defects, etc., which make the packaging inspection task highly complex. Traditional inspection methods often rely on local features for recognition, making it difficult to handle packaging anomaly problems under complex backgrounds. The two-dimensional flow model can well preserve the spatial position information of the image and has strong modeling capabilities for object relationships in packaging images, thereby enabling the flow model to effectively detect anomalies in packaging. By maintaining the spatial structure of the image, the two-dimensional flow model can not only accurately capture local features of objects but also perform anomaly detection at a global level, fully utilizing the importance of spatial information in inspection tasks.
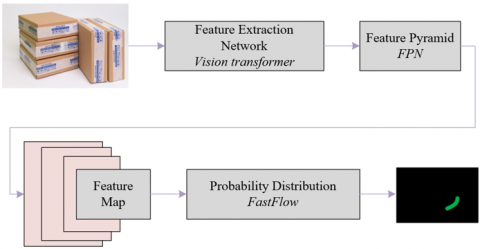
The basic idea of applying the two-dimensional flow model to the logistics packaging automation inspection scenario in this paper is to enhance the expressive power of the model by combining deep learning technology. Specifically, by using Vision Transformer (ViT) as the feature extractor, the model can provide global perception, integrating global information and local details in the image, thereby better understanding the context and details of packaging images. This is especially crucial for detecting small-sized targets and subtle anomalies. At the same time, the combination with the improved Feature Pyramid Network (FPN) further enhances the fusion capability of multi-scale features, particularly improving the detection accuracy of small-scale targets when dealing with packaging objects of different sizes. Finally, by combining the two-dimensional flow model with these deep learning modules, the model can better maintain the spatial structure information of the image and improve the detection ability of packaging anomalies in complex scenarios. Figure 1 shows the structure diagram of the logistics packaging automation inspection model.
Figure 1. Structure diagram of logistics packaging automation inspection model
In logistics packaging automation inspection, image data is the most direct source of input. Specifically, the model input usually comes from high-resolution packaging images. These images are captured by high-definition cameras on the industrial production line and contain detailed information on the packaging surface and its defects, such as damage, unclear labels, printing errors, wrinkles, etc. In these images, abnormal defects often exhibit small target characteristics, so the model needs to effectively extract and fuse features at different scales to ensure the capture of these minor defects. In this application scenario, the diversity and complexity of image data require the model to have strong feature extraction capabilities, be able to identify different types of defects, and have good robustness to environmental noise or irregular backgrounds. The input of the two-dimensional flow model also includes multiple feature channels in the image, such as color channels, texture channels, and depth information. For packaging images, color and texture are important features for judging packaging quality. Through multi-channel input, the model can simultaneously focus on color inconsistencies on the packaging surface, defects in patterns, and anomalies in texture. Depth information helps extract richer spatial features among packaging objects with different heights or angles. In some complex packaging image scenarios, it may be necessary to consider factors such as image perspective distortion and lighting changes. At this time, depth information can effectively help the model perform spatial positioning and correction, thereby improving the accuracy of defect detection.
3.1 Probability distribution transformation module
The traditional application of normalized flow usually focuses on unsupervised anomaly detection tasks, and it may encounter accuracy issues in some tasks. Although traditional DifferNet can handle low-dimensional data distributions and perform anomaly detection, it "flattens" the output of the feature extractor, making it difficult to precisely locate anomalies. This shortcoming is particularly prominent in logistics packaging inspection, as packaging images typically contain rich local details and complex spatial relationships, which the smoothing process of normalized flow cannot effectively capture. In contrast, the two-dimensional normalized flow model offers significant advantages for automatic logistics packaging inspection. The two-dimensional normalized flow performs affine transformations on segmented input data using Real NVP’s masking technique, enabling reversible transformation of data distribution while retaining the spatial structure and local details of images. This method allows effective preservation of spatial information in images, making it more suitable for anomaly localization tasks in logistics packaging inspection. In logistics packaging inspection, factors such as the size, shape, material, and possible defects of packaging form a complex data distribution. The two-dimensional normalized flow can better retain this multi-level information through parallel transformations and efficient processes, ensuring that the detection model can accurately locate abnormal areas when facing complex and diverse packaging data. Moreover, the reversibility and efficiency of the two-dimensional normalized flow model allow it to perform real-time processing in practical applications, meeting the logistics industry's needs for efficient and rapid anomaly detection.
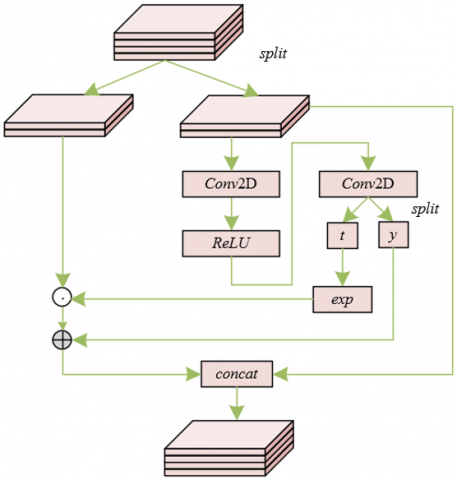
Figure 2. Structure of the affine coupling layer in the reversible transformation module of the two-dimensional normalized flow model
In the scenario of automatic logistics packaging inspection, the architecture of the two-dimensional normalized flow model's reversible transformation module includes affine coupling layers, channel permutation layers, and Actnorm layers. Among them, the channel permutation layer introduces reversible 1×1 convolution to replace the traditional reverse permutation method, which is crucial for multi-level and multi-scale feature fusion in logistics packaging inspection. In packaging images, the morphology of objects, background complexity, and packaging defects often manifest as subtle spatial structural differences. The channel permutation layer initializes its weight matrix using a randomly rotated matrix, thereby reducing the demand for computational resources while optimizing feature representation based on the premise of maintaining model reversibility. For diverse packaging types and materials in logistics packaging inspection, the channel permutation layer can effectively perform spatial information transformation and feature reconstruction, thus ensuring that the model can handle complex image structures, improve the ability to capture local details, and ensure the accuracy and stability of detection. Mapping the normal feature a to the standard Gaussian distribution space OC(c) is expressed as:
$O_C(c)=\frac{1}{\sqrt{2 \tau}} \exp \left(-\frac{c^2}{2}\right)$ (1)
The Actnorm layer plays an important role in the two-dimensional normalized flow model. As a preprocessing operation for input data, it helps improve the model's training effectiveness and stability. In automatic logistics packaging inspection tasks, packaging images usually have different brightness, contrast, and noise levels, making feature extraction from images more challenging. The Actnorm layer applies scaling and offset parameters to each channel, realizing an affine transformation of activations, thereby ensuring that each channel's subsequent processing has zero mean and unit variance. This operation not only helps to solve the bias problem between different data batches but also accelerates the convergence speed of the model and enhances the stability of the training process. For complex logistics packaging images, the Actnorm layer can balance the influence of different scales and feature channels, ensuring that the network can perform robust learning under various input conditions, thereby improving the model's performance in anomaly detection and localization tasks.
In the application scenario of automatic logistics packaging inspection, the affine coupling layer is the core module of the two-dimensional normalized flow model that implements reversible transformation. Through a series of precise operations, it can efficiently process complex packaging images while retaining spatial information and local features of the images. The specific architecture is shown in Figure 2. The following are the five specific transformation steps of the affine coupling layer and their applications in automatic logistics packaging inspection:
(1) Channel Splitting: The first step of the affine coupling layer is to split the input feature map along the channel dimension into two parts. The input feature map a is split into a1:z and az+1:f, where z represents the first z channels, and f represents the remaining channels from z+1 to the total number of channels. This splitting process is critical for processing packaging images, which often contain multiple levels of features, such as background and foreground information. By splitting the channels, the affine coupling layer can independently process different feature layers, ensuring efficient modeling of both detailed and global information, which leads to more effective feature fusion in subsequent steps.
(2) Calculation of Mean and Standard Deviation: After channel splitting, the affine coupling layer calculates the mean ω and standard deviation δ of the input feature map a along the spatial dimension. By statistically analyzing the spatial distribution of the input image, the model can capture important global information. In logistics packaging inspection, variations in lighting and shadows in images may cause spatial feature differences. Calculating mean and standard deviation helps normalize image data, eliminate unnecessary effects, and improve the stability of subsequent processing. Assuming that the height and width of the feature map are represented by G and Q, and a very small constant is represented by γ, the calculation formulas are:
$\omega_u=\frac{1}{G \times Q} \sum_{g=1}^G \sum_{q=1}^Q a_{u, g, q}$ (2)
$\delta_u=\sqrt{\frac{1}{G \times Q} \sum_{g=1}^G \sum_{q=1}^A\left(a_{u, g, q}-\omega_u\right)^2+\gamma}$ (3)
(3) Learning Affine Transformation Parameters: The affine coupling layer uses a two-dimensional convolutional layer to learn the affine transformation parameters tu and yu, and performs affine transformation on the split a1:z using these parameters. In this way, the affine coupling layer can adjust the features of different areas in the image, making the data distribution more in line with model requirements and optimizing its representation capability. In automatic logistics packaging inspection, local features such as package surface, labels, and defects need to undergo precise transformations to be effectively recognized. Learning affine transformation parameters helps the model better process these local details, thereby improving detection accuracy. Assuming the learnable parameters are tu and yu, and the normalized output au is represented by yu, the calculation formula is:
$b_u=t_u \cdot \frac{a_u-\omega_u}{\delta_u}+y_u$ (4)
(4) Channel Merging: In logistics packaging detection applications, inspection of packaging images relies not only on a part of the features but also on a comprehensive understanding of all types of information in the image. After affine transformation, a1:z and az+1:f are merged into a new output feature map a^, ensuring that the features after affine transformation are fully integrated with the original features, thereby retaining both local and global information of the image. The merged feature map provides a richer feature representation, helping the detection model more accurately identify and locate anomalies in packaging.
$\hat{a}=\left[b_1, b_2, \ldots, b_z, a_{z+1}, a_{z+2}, \ldots, a_f\right]$ (5)
(5) Backpropagation to Compute Gradients: Finally, the affine coupling layer performs backpropagation to compute the model gradients, thereby optimizing the model parameters. In the task of automatic logistics packaging inspection, the model aims to maximize the description capability for normal samples while minimizing the misidentification of abnormal samples. Through gradient descent algorithms, the model continuously optimizes its parameters to minimize the loss function MH(ϕ), thereby improving model accuracy and effectiveness. In practical applications, gradient optimization not only allows the model to achieve better fitting results on the training set but also provides more robust anomaly detection capabilities when facing complex packaging images. By computing gradients through backpropagation, the model can gradually adjust parameters to ensure high efficiency and accuracy in logistics packaging detection scenarios. Assuming the output of the two-dimensional normalized flow is cu, the Jacobian matrix between the output q and the input of the two-dimensional normalized flow is Ku, and the number of normal samples is V, the expression is:
$M_H(\varphi)=-\log O_A(a)=\left[\frac{1}{V} \sum_{u=1}^V \frac{\left\|c_u\right\|_2^2}{2}-\log \left|D E T\left(K_u\right)\right|\right]$ (6)
In the application scenario of automatic logistics packaging inspection, the two-dimensional flow model, through its bidirectional reversible characteristics, can effectively implement transformation and generation of image features. In the forward process, the model receives feature maps from the packaging image feature extractor. These feature maps may contain information such as the shape, identification, print quality, and surface texture of the packaging. The two-dimensional flow model transforms the distribution of these original feature maps into a Gaussian distribution in a two-dimensional space. This process improves the efficiency of subsequent processing by simplifying image features into a probability distribution that conforms to Gaussian distribution. The advantage of this transformation lies in its ability to eliminate noise and unnecessary complexity in packaging images, allowing the model to focus more on key information such as defects, damage, or unclear labels. In the reverse process, the two-dimensional flow model samples from the Gaussian distribution and generates corresponding packaging image features based on these samples. For automatic logistics packaging inspection, the generated features can reproduce the original packaging information in images, and even simulate possible image noise or interference by adding noise. In this process, by visualizing the generated feature tensors, it is possible to clearly observe how the model captures and highlights abnormal areas in the image. For example, when damage, deformation, or printing errors appear in packaging images, these anomalies can be clearly displayed in the feature visualization images.
3.2 Global feature extraction module
Although traditional convolutional neural networks (CNNs) perform excellently in image classification tasks, their performance is often limited when dealing with high-dimensional and complex image data, especially when the features in the image have long-distance dependencies. This limitation mainly comes from the local receptive field of CNNs. Therefore, this paper introduces ViT as the feature extraction module into the model. In logistics packaging images, defects, printing errors, or damage may be distributed in different parts of the image. ViT, through its global feature modeling capability, effectively improves the detection ability of these defects, enabling the detection model to more accurately identify various anomalies in packaging. In addition, in automated detection of logistics packaging, the diversity and complexity of image data require the model to have strong generalization ability. Compared with CNNs, the structure of ViT has more advantages in processing large-scale datasets because it integrates information globally through the self-attention mechanism, reduces the number of model parameters, and avoids the risk of overfitting.
ViT first divides the input image into multiple image patches of the same size and performs dimensionality reduction and linear transformation on these patches to generate a series of f-dimensional vectors. This patch-based processing method allows the model to capture more detailed information in local regions, while the linear transformation helps simplify the expression of image features. Each image patch is also added with position encoding information to retain its positional information in the original image, which is crucial for packaging images. For example, printing errors or defects in packaging images may appear in different locations, and position encoding ensures that the model correctly understands the spatial relationships between different parts. Finally, these processed image patches form a two-dimensional matrix, which is fed into the Transformer encoder for processing. This process can effectively capture complex features in the image and enhance the model's understanding of image content.
The multi-head self-attention mechanism of the Transformer further enhances the performance of ViT in automated detection of logistics packaging. By dividing the input two-dimensional matrix into multiple subspaces, the model can capture the interrelationships between different regions of the image in different subspaces, thereby identifying subtle differences in packaging images. In the multi-head self-attention structure, the calculation process of the query matrix, key matrix, and value matrix ensures that the model can effectively perform weighted combinations of the features of each image patch, and then extract richer and more diverse feature representations. This mechanism is very effective for complex features in packaging images, especially when there are various printing quality issues, physical damage, or unclear labels on the packaging surface. ViT can capture long-distance dependencies between different parts through multi-head self-attention, improving detection accuracy and robustness. Specifically, l attention heads are used to divide the query matrix, key matrix, and value matrix into l parts by columns to obtain Wu, Ju, and Nu, and then project them into different linear subspaces to perform multi-head self-attention transformation. Assuming that the output feature maps of all attention heads are represented by Pu, Pu is concatenated. The specific calculation formulas are as follows:
$j=f / l$ (7)
$P^u=\operatorname{softmax}\left(\frac{W^u\left(J^u\right)^S}{\sqrt{j}}\right) N^u, u \in[1, l]$ (8)
$P=\operatorname{cancat}\left(\left\{P^1, \ldots, P^u, \ldots, P^l\right\}\right)$ (9)
3.3 Multi-scale feature fusion module
In the scenario of automated detection of logistics packaging, the anomalies of packaging images often appear as subtle damages, scratches, color differences, or irregular shapes and other small-object features. These small objects occupy a relatively small proportion in the image and may exist in a more complex background or with noise. Therefore, how to effectively capture these detailed features and accurately locate them during anomaly detection is a challenging task. To improve the detection accuracy for these small-object anomalies, the two-dimensional stream model proposed in this paper adopts an optimized FPN structure for multi-scale feature fusion. This strategy can make full use of features at different levels, thereby enhancing the model's ability to recognize small-sized defects.
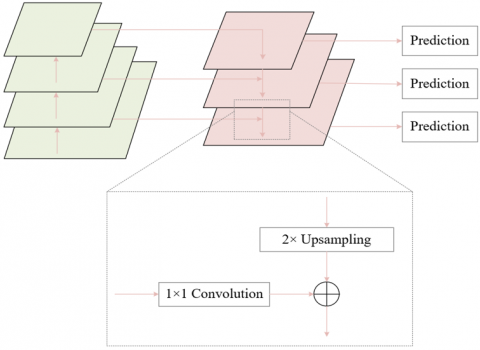
Figure 3. Principle of FPN network structure
The multi-scale feature fusion mechanism of FPN has special significance in automated detection of logistics packaging. Defects in packaging images often present as low-resolution details and high-resolution background information. Although traditional deep networks can effectively capture global semantic information, they gradually lose the details of local features, resulting in low detection accuracy for small-sized defects. The structure principle is shown in Figure 3. By introducing FPN, shallow detailed information and deep global semantic information can be effectively fused to form a complementary effect. The FPN structure extracts features through convolution from the bottom to the top, and transfers the semantic information of high-level features to the bottom layer through the upsampling process. At the same time, the lateral connections are used to enhance the fusion effect of the feature maps, enabling the model to utilize the high resolution and weak semantic information of the low-level features and the low resolution and strong semantic information of the high-level features. In the detection of logistics packaging images, FPN helps the model to capture both the subtle local defects and the global packaging structure information on multi-level feature maps, thereby improving the recognition accuracy of small-object anomalies in complex environments.
Assuming that the feature matrices of different levels in the FPN structure are represented by ax and ay, and the fused feature matrix is represented by b. In the above process, the spatial feature fusion calculation formula is as follows:
$M a^x+a^y=b$ (10)
The mathematical expression of the additive fusion function is:
$b_{u, k, f}^{S U M}=S U M\left\{a_{u, k, f}^x, a_{u, k, f}^y\right\}$ (11)
Specifically for the two-dimensional flow model based on the ViT model, the optimized version of the FPN can further enhance the multi-scale processing capability of image features. The specific architecture is shown in Figure 4. The ViT model itself has already captured global features through its multi-head self-attention mechanism, while the FPN introduces multi-scale fusion to better combine feature maps at various levels, thereby improving the comprehensiveness and accuracy of feature extraction. In logistics packaging automated detection, defects on the package may appear in any area of the image. Therefore, extracting features at different scales and performing effective fusion are essential for improving the detection rate of small target anomalies. Through the optimized FPN structure, the model can perform fusion on feature maps at multiple scales, which not only strengthens the localization ability of small surface defects on packages, but also improves the overall performance of the model, making the automatic detection of packaging defects more accurate and efficient.
Figure 4. Improved FPN structure diagram
According to the data in Table 1, in the packaging damage dataset, after incorporating the two-dimensional flow model, the AUCROC of the validation set increased from 0.945 to 0.951, and the AUCROC of the test set remained at 0.985; AUCPR, Acc, and F1 indicators also showed different degrees of improvement after incorporating the model. In the packaging deformation dataset, multiple indicators of the validation and test sets were improved after incorporating the model, such as the AUCROC of the validation set increasing from 0.923 to 0.929. The packaging leakage dataset showed the same trend, with all indicators exhibiting an upward trend after incorporating the model, for example, the AUCPR of the validation set increased from 0.853 to 0.874. This indicates that in different types of logistics packaging detection datasets, the key evaluation indicators all showed positive changes after incorporating the two-dimensional flow model. Based on the above experimental results, it can be concluded that the proposed logistics packaging automation detection framework based on the two-dimensional flow model demonstrates significant advantages in practical detection tasks. The model can effectively improve the performance of logistics packaging automation detection in different scenarios such as damage, deformation, and leakage. The improvements in multiple evaluation indicators indicate its positive contribution to detection accuracy, reliability, and other aspects, verifying the feasibility and effectiveness of introducing the two-dimensional flow model in practical applications of logistics packaging automation detection.
Table 1. Analysis of the impact of incorporating the two-dimensional flow model on logistics packaging automation detection results
|
|
Validation Set |
Test Set |
||
|
|
w/o |
w/ |
w/o |
w/ |
|
Packaging damage dataset |
||||
|
AUCROC |
0.945 |
0.951 |
0.985 |
0.985 |
|
AUCPR |
0.974 |
0.976 |
0.993 |
0.992 |
|
Acc |
0.882 |
0.912 |
0.974 |
0.974 |
|
F1 |
0.813 |
0.823 |
0.956 |
0.953 |
|
Packaging Deformation Dataset |
||||
|
AUCROC |
0.923 |
0.923 |
0.874 |
0.912 |
|
AUCPR |
0.924 |
0.914 |
0.889 |
0.921 |
|
Acc |
0.826 |
0.832 |
0.782 |
0.823 |
|
F1 |
0.851 |
0.865 |
0.836 |
0.846 |
|
Packaging Leakage Dataset |
||||
|
AUCROC |
0.754 |
0.765 |
0.745 |
0.765 |
|
AUCPR |
0.853 |
0.874 |
0.851 |
0.865 |
|
Acc |
0.621 |
0.662 |
0.632 |
0.651 |
|
F1 |
0.548 |
0.653 |
0.645 |
0.652 |
Table 2. Pixel-level detection results of different methods on the validation set
|
|
AUCROC |
AUCPR |
P |
R |
F1 |
IoU |
|
YOLO |
0.936 |
0.421 |
0.387 |
0.512 |
0.432 |
0.287 |
|
Faster R - CNN |
0.954 |
0.456 |
0.452 |
0.552 |
0.512 |
0.332 |
|
SSD |
0.932 |
0.235 |
0.223 |
0.523 |
0.318 |
0.165 |
|
RetinaNet |
0.978 |
0.536 |
0.574 |
0.524 |
0.526 |
0.358 |
|
PSPNet |
0.921 |
0.754 |
0.856 |
0.623 |
0.724 |
0.569 |
|
EfficientDet |
0.915 |
0.723 |
0.823 |
0.648 |
0.726 |
0.564 |
|
CenterNet |
0.926 |
0.746 |
0.884 |
0.623 |
0.728 |
0.554 |
|
Proposed Method |
0.962 |
0.845 |
0.865 |
0.728 |
0.779 |
0.638 |
From the pixel-level detection results of different methods on the validation set in Table 2, the indicators of various object detection methods show differences. For the AUCROC indicator, RetinaNet reaches 0.978, showing outstanding performance, and the method proposed in this paper achieves 0.962, which is also at a high level; in terms of the AUCPR indicator, PSPNet reaches 0.754, and the method proposed in this paper achieves 0.845. For the P (Precision), R (Recall), F1, and IoU indicators, different methods also have their respective strengths. The method proposed in this paper achieves 0.865 in P, 0.728 in R, 0.779 in F1, and 0.638 in IoU, showing certain performance in all these indicators. Comprehensively analyzing the data of various indicators, it can be seen that the new logistics packaging automation detection method proposed in this paper has strong competitiveness in pixel-level detection on the validation set. Although it does not reach the highest value in the AUCROC indicator, it performs well in multiple key indicators such as AUCPR, P, R, F1, and IoU, indicating that the method has obvious advantages in detection accuracy, completeness, and overall performance, verifying its effectiveness and superiority in pixel-level detection for logistics packaging automation.
Observing the pixel-level detection results of different methods on the test set in Table 3, the indicators of various methods show significant differences. In terms of the AUCROC indicator, PSPNet reaches 0.978, EfficientDet is 0.976, and the method proposed in this paper is 0.963, which is at a high level. Regarding the AUCPR indicator, the method in this paper achieves 0.712, higher than most of the comparison methods. For the Precision (P), the method in this paper reaches 0.756, leading other methods; the Recall (R) is 0.556, F1 is 0.635, and IoU is 0.465, also showing certain performance in these indicators. From the overall perspective of the test set indicators, the logistics packaging automation detection method based on deep learning and computer vision, which constructs a two-dimensional flow model, demonstrates good performance. Although it does not rank first in the AUCROC indicator, it shows significant advantages in key indicators such as AUCPR and Precision, indicating that the method stands out in terms of accuracy and overall performance in logistics packaging detection, and can effectively achieve pixel-level detection of logistics packaging.
Table 3. Pixel-level detection results of different methods on the test set
|
|
AUCROC |
AUCPR |
P |
R |
F1 |
IoU |
|
YOLO |
0.952 |
0.135 |
0.135 |
0.432 |
0.221 |
0.115 |
|
Faster R - CNN |
0.954 |
0.248 |
0.238 |
0.526 |
0.326 |
0.189 |
|
SSD |
0.945 |
0.126 |
0.118 |
0.468 |
0.215 |
0.123 |
|
RetinaNet |
0.942 |
0.235 |
0.256 |
0.445 |
0.315 |
0.187 |
|
PSPNet |
0.978 |
0.559 |
0.654 |
0.389 |
0.489 |
0.345 |
|
EfficientDet |
0.976 |
0.624 |
0.748 |
0.487 |
0.586 |
0.412 |
|
CenterNet |
0.962 |
0.629 |
0.689 |
0.475 |
0.562 |
0.389 |
|
Proposed Method |
0.963 |
0.712 |
0.756 |
0.556 |
0.635 |
0.465 |
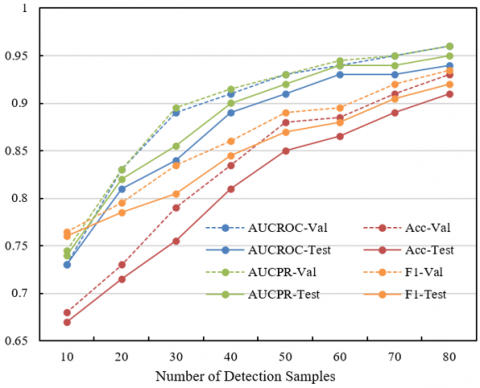
Figure 5. Influence of different numbers of detection samples on the performance of the proposed method in damaged packaging detection
From the line chart shown in Figure 5, as the number of samples increases from 10 to 80, different performance indicators show different trends. The AUCROC-Test and AUCROC-Val indicators are relatively stable overall, always maintaining at a high level. Although there are small fluctuations during the increase in the number of samples, they basically stay above 0.95. The Acc-Test and Acc-Val indicators are also relatively stable; Acc-Test remains close to 1 during the sample number variation process, while Acc-Val fluctuates around 0.9. The F1-Test and F1-Val indicators fluctuate greatly in the early stage, with F1-Val at a low value when the sample number is 20, and then gradually increases. F1-Test shows an overall upward trend as the number of samples increases. The AUCPR-Val and AUCPR-Test indicators are relatively stable, always maintaining at a high level. From the performance of various indicators, it can be concluded that the logistics packaging automation detection method based on the two-dimensional flow model proposed in this paper has good robustness to changes in the number of samples in damaged packaging detection. Most of the key performance indicators, such as AUCROC, Acc, and AUCPR, can maintain a high level when the number of samples changes, indicating that the detection performance of the method will not be seriously affected by certain fluctuations in sample size. Although the F1 indicator fluctuates greatly in the early stage, it gradually becomes stable and increases with the increase of sample number, indicating that appropriately increasing the number of samples helps to improve the comprehensive performance of this method in damaged packaging detection.
Figure 6. The effect of different detection sample sizes on the performance of the proposed method for deformation-type packaging detection
Figure 7. The effect of different detection sample sizes on the performance of the proposed method for leakage-type packaging detection
From the data in Figure 6, it can be seen that as the sample size increases from 10 to 80, various performance metrics show an upward trend. The AUCROC-Val and AUCROC-Test indicators steadily increase, gradually rising from lower initial values to nearly 0.95 and 0.9 respectively. The Acc-Val and Acc-Test indicators also continue to improve, with Acc-Test eventually approaching 0.9 and Acc-Val reaching a relatively high level. The AUCPR-Val and AUCPR-Test indicators show a clear upward trend, eventually approaching 0.95. The F1-Val and F1-Test indicators also continue to rise, with F1-Test increasing from about 0.75 to around 0.85, and F1-Val increasing from slightly above 0.7 to above 0.8. Overall, the increase in sample size has a significant promoting effect on the performance improvement of the proposed logistics packaging automated detection method based on the 2D flow model in deformation-type packaging detection. As the number of samples increases, key performance indicators such as AUCROC, Acc, AUCPR, and F1 continue to improve, indicating that the method can effectively utilize more samples for learning and detection. In handling deformation-type packaging detection tasks, having a sufficient number of samples enables its performance to be fully utilized.
According to Figure 7, in leakage-type packaging detection, as the sample size increases from 10 to 80, the changes in different performance metrics vary. The AUCROC-Val and AUCROC-Test indicators show an overall upward trend, with AUCROC-Test gradually increasing from about 0.7 to nearly 0.8. The AUCPR-Val and AUCPR-Test indicators remain relatively stable, maintaining a high level around 0.8–0.85. The Acc-Val and Acc-Test indicators fluctuate significantly, with Acc-Test reaching a peak when the sample size is 30 and then declining, and Acc-Val also experiencing obvious fluctuations. The F1-Val and F1-Test indicators also fluctuate, with F1-Test reaching a higher value when the sample size is 30, then decreasing and gradually rising again. In general, the change in sample size has a certain impact on the performance of the proposed logistics packaging automated detection method based on the 2D flow model in leakage-type packaging detection. Although the AUCROC and AUCPR indicators are relatively stable and show an increasing trend, the Acc and F1 indicators fluctuate significantly, indicating that the increase in sample size does not always lead to stable performance improvement for this method in handling leakage-type packaging detection. However, within a certain range of sample sizes, some key indicators can still be improved, suggesting that the detection framework has certain application potential in leakage-type packaging detection.
The research content of this paper revolves around “logistics packaging automated detection technology based on deep learning and computer vision,” aiming to propose an innovative method to improve the efficiency and accuracy of automated detection in logistics packaging. The study constructed a detection framework based on a two-dimensional flow model and explored in depth the application advantages of this framework in complex scenarios. Firstly, the paper analyzed the basic principles of using the two-dimensional flow model for logistics packaging automated detection, emphasizing the unique advantages of this method in handling complex backgrounds and variable environments. Then, the study introduced several key modules in the framework in detail, including the probability distribution transformation module, the global feature extraction module, and the multi-scale feature fusion module. Among them, the probability distribution transformation module aimed to handle variations in packaging shapes and sizes, thereby improving the adaptability of detection; the global feature extraction module effectively extracted global information from images, enhancing the recognition ability of the model; and the multi-scale feature fusion module further improved the detection accuracy of packaging objects by combining features at different scales.
Through experimental validation, the proposed logistics packaging automated detection framework showed better performance than traditional methods in various complex scenarios, specifically in detection speed and accuracy. In addition, the model also demonstrated good adaptability in real-time detection and processing capabilities, fully proving the broad application potential of deep learning and computer vision technologies in the logistics industry. Therefore, this study not only provided a new idea and technical solution for logistics packaging automated detection, but also has important theoretical value and application prospects. The research results show that the integration of deep learning and computer vision technologies can effectively improve the detection efficiency of logistics packaging, helping enterprises reduce labor costs and improve operational efficiency.
However, this study also has certain limitations. Firstly, the research is conducted under specific environments, so the generalization ability of the model still needs to be further validated in more real-world scenarios. In addition, for extremely complex scenes, the model’s performance may be affected and needs further optimization. In future research directions, it is suggested to focus on further optimization and improvement of the model to enhance its performance in complex scenarios. It is also possible to explore the integration of other sensor data with visual data to enhance the detection capability of the model. Moreover, improving the computational efficiency of the model to meet the higher requirements of real-time detection application scenarios is another important direction for future research. In summary, this study provides an important theoretical and practical foundation for the automated detection of logistics packaging, and future research will further promote the continuous development of this field.
[1] Ibrahim, M.D., Pereira, M.A., Caldas, P. (2024). Efficiency analysis of the innovation-driven sustainable logistics industry. Socio-Economic Planning Sciences, 96: 102050. https://doi.org/10.1016/j.seps.2024.102050
[2] Eryuruk, S.H., Kalaoglu, F., Baskak, M. (2011). Logistics as a competitive strategy analysis of the clothing industry in terms of logistics. Fibres & Textiles in Eastern Europe, 84(1): 12-17.
[3] Tappeiner, W., Wieser, H., Obkircher, R., Pigneter, J., Roth, J., Ausserhofer, D. (2024). Nursing home staff’s experiences with the implementation of an automated blister packaging system for solid, orally ingestible drugs: A qualitative study in Northern Italy. BMJ Open, 14(12): e091616. https://doi.org/10.1136/bmjopen-2024-091616
[4] Wang, J., Zhang, X., Wang, X., Huang, H., Hu, J., Lin, W. (2022). A data-driven packaging efficiency optimization method for a low carbon system in agri-products cold chain. Sustainability, 14(2): 858. https://doi.org/10.3390/su14020858
[5] Pålsson, H., Hellström, D. (2016). Packaging logistics in supply chain practice–current state, trade-offs and improvement potential. International Journal of Logistics Research and Applications, 19(5): 351-368. https://doi.org/10.1080/13675567.2015.1115472
[6] Loske, D., Mangiaracina, R., Regattieri, A., Klumpp, M. (2025). The impact of product packaging characteristics on order picking performance in grocery retailing. Journal of Business Logistics, 46(1): e12400. https://doi.org/10.1111/jbl.12400
[7] Stine, K. (2024). The logistics of labor and life at signetics. IEEE Annals of the History of Computing, 46(2): 52-64. https://doi.org/10.1109/MAHC.2024.3379939
[8] Karabegović, I., Karabegović, E., Mahmić, M., Husak, E. (2015). The application of service robots for logistics in manufacturing processes. Advances in Production Engineering & Management, 10(4): 185-194. https://doi.org/10.14743/apem2015.4.201
[9] Barrera, M.M.M., Cruz-Mejia, O. (2014). Reverse logistics of recovery and recycling of non-returnable beverage containers in the brewery industry: A “profitable visit” algorithm. International Journal of Physical Distribution & Logistics Management, 44(7): 577-596. https://doi.org/10.1108/ijpdlm-08-2012-0258
[10] Fan, L., Schneider, A., Joumaa, M. (2023). A new automated model validation tool for financial institutions. Journal of Risk Model Validation, 17(3): 59-85.
[11] Prisacaru, A., Gromala, P., Han, B., Zhang, G.Q. (2021). Degradation estimation and prediction of electronic packages using data-driven approach. IEEE Transactions on Industrial Electronics, 69(3): 2996-3006. https://doi.org/10.1109/TIE.2021.3068681
[12] Khamis, A., Abdul, F., Dsouza, S., Sulaiman, F., Farooqi, M., Al Awadi, F., Bayoumi, R. (2024). Risk of microvascular complications in newly diagnosed type 2 diabetes patients using automated machine learning prediction models. Journal of Clinical Medicine, 13(23): 7422. https://doi.org/10.3390/jcm13237422
[13] Tiye, K., Gudeta, T. (2018). Logistics management information system performance for program drugs in public health facilities of East Wollega Zone, Oromia regional state, Ethiopia. BMC Medical Informatics and Decision Making, 18: 1-13. https://doi.org/10.1186/s12911-018-0720-9
[14] Niewiadomski, R., Mancini, M., Varni, G., Volpe, G., Camurri, A. (2015). Automated laughter detection from full-body movements. IEEE Transactions on Human-Machine Systems, 46(1): 113-123. https://doi.org/10.1109/THMS.2015.2480843
[15] Tomlinson, D.R., Biscombe, K., True, J., Hosking, J., Streeter, A.J. (2021). Identification of deliberate catheter motion at the left atrial posterior wall during pulmonary vein isolation: Validity of respiratory motion adjustment. Journal of Cardiovascular Electrophysiology, 32(4): 994-1004. https://doi.org/10.1111/jce.14945
[16] Abdelmaksoud, A.M., Balomenos, G.P., Becker, T.C. (2021). Parameterized logistic models for bridge inspection and maintenance scheduling. Journal of Bridge Engineering, 26(10): 04021072. https://doi.org/10.1061/(ASCE)BE.1943-5592.0001774
[17] Zhang, Y., Zhou, Y., Li, H., Hao, H., Chen, W., Zhan, W. (2022). The navigation system of a logistics inspection robot based on multi-sensor fusion in a complex storage environment. Sensors, 22(20): 7794. https://doi.org/10.3390/s22207794
[18] Ito, K., Mizutani, S., Nakagawa, T. (2020). Optimal inspection models with minimal repair. Reliability Engineering & System Safety, 201: 106946. https://doi.org/10.1016/j.ress.2020.106946
[19] Rahbari, A., Mahdi Nasiri, M., Jolai, F., Konur, D. (2024). Integrated forward and reverse cross-docking with vehicle routing and scheduling under the uncertainty of inspection results: A genetic-mathematic algorithm. Transportation Research Record, 2678(9): 169-195. https://doi.org/10.1177/03611981231225431