Betül Ağaoğlu*![]() | İman Askerzade
| İman Askerzade![]() | Gazi Erkan Bostanci
| Gazi Erkan Bostanci![]() | İhsan Tolga Medeni
| İhsan Tolga Medeni![]()
© 2025 The authors. This article is published by IIETA and is licensed under the CC BY 4.0 license (http://creativecommons.org/licenses/by/4.0/).
OPEN ACCESS
Energy represents economic growth and social welfare for modern societies. Fossil fuels are of great importance in energy production. Seismic images formed by the reflection of sound waves sent underground are used to locate fossil fuels such as oil, natural gas and coal. The presence of salt domes in seismic images gives clues for fossil fuels. Experts manually interpret seismic images to identify reserve areas. Expert knowledge, experience and time are needed in this process. As a result of these knowledge and experience being affected by special circumstances, drilling operations carried out in areas that are incorrectly estimated can cost companies or countries in terms of time and cost. There are artificial intelligence studies in the interpretation of seismic images where the results are more successful than classical methods. In our study, based on the UNet architecture, which is one of the deep learning methods, various modules have been added for performance improvement. Concurrent Spatial and Channel Squeeze & Excitation (SCSE), Atrous Spatial Pyramid Pooling (ASPP) and Hypercolumn modules were added, and their performance was investigated both individually and collectively. By adding modules, it is aimed to increase the performance of our model and contribute to the field. Before designing the system, pre-processing was applied on the data. Modules were added to the UNet architecture, and the results were evaluated with accuracy, IoU, F1 and mAP scores. The statistical significance of the obtained results was measured by Mc Nemar and Cohen's Kappa tests. As a result of the study, our UNet-based model improved the performance of the ASPP module alone the most, and the best performance was achieved when all modules were used together.
artificial intelligence, deep learning, hypercolumn, seismic data, UNet
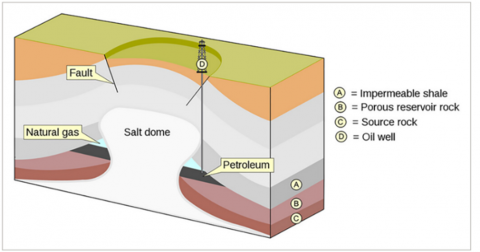
The economic growth and social welfare of modern societies depends on energy. Energy is required for production in industry, agriculture, technology and other sectors [1]. Energy is an essential resource for the economic production of countries or societies and the regular functioning of daily life. Energy not only ensures the continuation of daily life but is also defined as a critical resource for sustaining economic development and growth [2]. Approximately 80% of the materials used for energy in the world are provided from fossil fuels [3]. In the BP Energy Outlook Report (2022), 33% of the materials used for energy in the world are oil, 24% natural gas and 27% coal. In the field of the critical role of energy in the development of societies, fossil fuels have been one of the most important sources of energy production throughout history. Since the industrial revolution, they have been used as an indispensable fuel for both economic growth and technological development, especially oil. Therefore, the ability to own and sustainably utilize fossil fuel resources has become one of the most important factors determining the economic and political power of countries. Especially during the industrial revolution, the discovery and extraction of fossil fuels contributed to many countries becoming global economic and industrial powers. According to the International Energy Agency, headquartered in France, the use of fossil fuels to meet energy needs will take the first place by 2035. With the discovery of new reservoirs, only 80% of the demand will be met. According to the results of the research, the dependence of countries on fossil fuels to meet their energy needs is an important condition for their economic strength. In determining the location of fossil fuels, the data obtained by seismic imaging of the earth are analyzed. Geophone machines that send sound waves and visualize their reflection are used to obtain these data. Experts interpret the seismic images and locate the fuel reserves [4]. With the information provided by seismic data, it is very important for the country's economy to locate, extract and process fossil fuels. With the correct determination of the location of fossil fuels and their extraction and processing, their contribution to the country's economy is great. The analysis of seismic data is carried out by experts in determining the underground locations of fossil fuels such as oil, natural gas and coal. The presence of salt deposits gives clues to experts in the detection of these fossil fuels [5, 6]. There are valuable fossil fuels in the lower parts of the structures called salt domes [7]. Therefore, salt domes guide experts in the detection of oil and natural gas fields [8]. When performing seismic imaging, the speed of reflection of the sound wave from salt (4.5 km/s) is greater than from other structures. Due to this difference in reflection velocity, distinguishable boundary lines are formed in the imaging. These details reflected in seismic images are used to detect salt areas. The location of salt domes can also be used to detect oil and natural gas deposits [9]. Salt domes and the fossil fuels under them are shown in Figure 1.
Figure 1. Salt dome oil and gas traps [10]
Seismic imaging is used to determine the location of fossil fuels underground and to get information about how deep they are located. By interpreting the information obtained with this imaging process, it is determined where drilling operations should take place. Drilling operations are costly and time consuming. In order for these operations to be carried out correctly and effectively, experts are required to interpret seismic images. Experts use their knowledge and experience in interpreting seismic images. As a result of these knowledge and experience being affected by special circumstances, drilling operations carried out in areas that are incorrectly predicted can cost companies or countries in terms of time and cost. This situation also causes environmental pollution due to the carbon emission of the machines operated unnecessarily during the drilling process. As a result of unnecessary operations, it leads to the formation of a significant carbon footprint [11]. In the process of locating fossil fuels, there are artificial intelligence studies in which the results are more successful than classical methods in the interpretation of seismic images. Artificial intelligence performs operations such as prediction, classification and segmentation by learning with data. Deep learning method, one of the artificial intelligence methods, uses complex and large data. It works similar to the human brain and can learn and analyze information in its layered structure. With these layered structures, it increases its performance for the result by learning a feature of the data at each layer transition. The deeper the number of layers, the deeper the learning becomes. Seismic images contain complex data due to their structure. Deep learning methods using seismic images can make accurate predictions by making deep analyzes with its multi-layered structure [10, 12]. The importance of seismic images in the detection of fossil fuel areas such as oil and natural gas, which are highly utilized in energy production, has increased even more with the inclusion of deep learning methods in the process. Among deep learning methods, especially the UNet architecture has achieved high segmentation success on seismic images [13]. The UNet architecture, one of the deep learning methods, has achieved high success by first working on biomedical images. In seismic images, such as biomedical images, it is very important to interpret large and complex images accurately, quickly and correctly. Fast and accurate data processing by experts using these methods supports all processes in the detection of fossil fuel areas. Thus, the errors to be made with this process will be minimized [14]. Compared to other layered deep learning architectures, the UNet architecture can produce high accuracy by training with fewer data sets. In order to improve the results of the system, additional modules can be used to increase the performance of the system [15]. Additional modules used in the UNet architecture enhance the meaning to be derived from the data by assigning different levels of importance to different parts of complex images. The modules selectively focus on important areas in the data. In the architecture created with the SCSE (Concurrent Spatial and Channel Squeeze & Excitation) module, it identifies the areas to be focused on spatially and channel-based on the images and enables the model to focus on them. Thus, the success of the segmentation performed by the model increases [16]. The Atrous Spatial Pyramid Pooling (ASPP) module processes the feature maps obtained. These feature maps are provided by the Atrous convolution layer with different expansion rates. Thus, it helps to accurately segment objects and details at different scales on our images [17]. With the Hypercolumn structure, it ensures that the intrinsic features obtained in the previous layers are delivered to the last layer as a vector. Thus, it realizes more accurate results by taking spatial location information [18]. By integrating these modules into the UNet architecture, the model can capture fine details and learn large-scale structures. The segmentation performance obtained as a result of the system can increase significantly. In addition, the precision and sensitivity of the model created on complex data such as seismic images can be increased. With the additional modules added to the models, the generalization capability of the system can be increased, and it can be more robust against overfitting [19].
Our hypotheses that we hope to observe as a result of our study.
SCSE, ASPP and Hypercolumn modules will improve the performance of the system when integrated individually. We also hypothesize that the system created by adding all modules together will provide the highest accuracy and generalization performance by combining the improvements provided by each module individually.
As a result of our study, we aim to realize a higher performance model by obtaining the performance results of the modules added to our system both individually and together on the UNet model. In general, in our study, the UNet model was designed to detect fossil fuel reserves and segment salt domes using seismic images. SCSE, ASPP and Hypercolumn modules were added to the system to increase the performance results of the model. The results were evaluated with different metrics. These metrics are accuracy, IoU, F1 and mAP. Mc Nemar and Cohen's Kappa tests were used to see the significance levels of the obtained metrics. The rest of the paper is organized as follows:
Section 2 shows how artificial intelligence methods using seismic data have been applied in the literature. Section 3 describes the material and methodology of the study, including the pre-processing steps applied to the images in the dataset and a detailed review of the modules to be added to the system. Section 4 presents the results. Section 5 presents the results of the effect of the modules on the system we have created its place in the literature and information about future work.
Seismic imaging and analysis have long been used to locate fossil fuels [20]. In classical methods, in the discovery of resources such as oil and natural gas, the images must first be interpreted and positioned by experts. This process is both time consuming and prone to misinterpretation. Artificial intelligence methods are used in seismic image analysis to minimize these problems [5]. The study by Zhang et al. [21] focuses on the classification of subsurface rock types as sand and shale using seismic data. The study was applied on 3720 samples from 13 wells in China. Convolutional neural network (CNN) and deep neural network (DNN) architectures from deep learning methods were applied. The effect of continuous wavelet transforms (CWT), a signal preprocessing approach, on these architectures was investigated. As a result of the study, the CWT-CNN model obtained the highest F1 value with 85.9 among CNN, DNN, CWT-CNN, CWT-DNN models. With this study, it is understood that not only artificial intelligence methods but also models that can be added to the system can increase the result performances in seismic analysis processes. High success rates have been achieved in many studies using salt fields in the detection of fossil fuel areas. In this study, a CNN-based model was designed for salt/sediment detection from seismic data. In the model, exponential linear units (ELU) activation function, lovasz-softmax loss function, stratified K-fold cross validation features were selected, and the sensitivity of the system was investigated. As a result of the system, it is stated that CNN, one of the deep learning architectures, is successful in analyzing and classifying seismic data [22]. In a study aiming to detect salt in seismic images, the performance of the images was investigated using the edge prediction branch. Hypercolumn, SCSE, edge prediction branch was added to a deep learning-based model to improve performance. The results were evaluated with IoU and mAP. The system was run with learning rate 0.01 and epoch value 100. As a result, the mAP value was obtained as 87.39. In the results of the system, first of all, high sensitivity on edge detection is indicated [23]. The contribution of deep learning in analyzing seismic images is increasing. In another study on salt area detection, transfer learning methods were used. The system was designed using the pre-trained ResNeSt model. In addition, SCSE and OCNet-block were added to the system to increase its sensitivity. The performance results of the system were measured with IoU and mAP metrics. 87.32 mAP value was obtained in the system run with 160 epochs. As a result, it is stated that the results are suitable for analyzing complex data such as seismic data [5]. Detection of salt areas in studies on seismic images has been studied many times in the literature. In the study by Milosavljević [8], one of these studies is on salt area detection using deep learning methods from seismic images. In their system, UNet, ReSNet and DenseNet architectures were influenced. The training set was divided into 80/20 training and validation. Adam was chosen as the optimizer and binary crossentropy as the loss function. The result values were interpreted with accuracy and IoU. As a result of the study, it was stated that the model obtained high accuracy compared to many other models. Bodapati et al. [24] also conducted a study on salt detection from seismic data. UNet, one of the deep learning architectures, was used. Resizing and normalization operations were applied to the images as preprocessing. The system was designed by choosing learning rate 0.01 and loss function binary cross entropy. The result of the study was evaluated with the IoU metric. In the system run with 200 epochs, the IoU value was obtained as 85.60. The studies show that deep learning methods have achieved fast and successful results with seismic data integration. In a study by Li et al. [25] applied inversion and multiple distillation methods to the UNet architecture and evaluated its performance. The aim of the study is to realize salt area detection in seismic images with the highest accuracy. In the results obtained, 95% accuracy was achieved. Bochu et al. [26] study aims to identify salt segments in ground seismic images using deep learning techniques. In the study, a UNet based model is implemented and data augmentation techniques are used to ensure accurate identification of salt segments in seismic images. Various transformations are applied to augment the dataset, solving the problem of limited labeled data. Within the scope of the methodology, the Adam optimization algorithm and the cross-entropy loss function were used during model training to provide a more efficient learning process. In order to achieve a higher accuracy, hyperparameter optimization was performed in the study. An accuracy of 93% was achieved in the performance of the model. It is concluded that artificial intelligence methods used in salt area detection have a positive effect on the process. Challenges encountered when working with seismic images include low generalization, incomplete labeling, and task-specific models. In order to overcome these obstacles, Sheng et al. [27] created a transformer-based seismic foundation model (SFM). It is aimed to make precise evaluations with the designed system. By multiplying the seismic images with data duplication methods, the system was enabled to work with more images. Thus, a more precise and detailed segmentation was realized. During the operation of the system, different optimization techniques were used, and the performance results were observed. It has contributed to the literature by reaching higher IoU values compared to traditional artificial intelligence methods. In another study, squeeze-extraction pyramid network (Se-FPN) was designed for salt area detection. The aim is to design a system that can work with information at different scales. For this, Feature Pyramid Networks (FPN) architecture was utilized. In this way, the useful parts of the images are highlighted, and the background parts are suppressed. SeNet was used as the backbone in the system. At the end of the system, information from different multi-scales was combined with the hypercolumn module. As a result of the study, the IoU value of 86 was obtained and the system proved to be very successful in salt detection [28]. The study by Chung et al. [29] used a deep learning model for salt dome detection. The prominent element in this study is the separation of images from noise by performing data cleaning in the data preprocessing stage. In artificial intelligence models, the introduction of clean data into the system directly affects the system performance. Noise in seismic images can cause the system to misinterpret the data during the training phase. In this study, Kullback-Leibler (KL) divergence algorithm is used to filter the noise data. System performance is evaluated with IoU and Dice metrics. The results of the study show that noise removal improves the accuracy of the system. In addition, such preprocessing steps contribute to the accuracy of the system. Zhou et al. [15] designed a system with seismic images generated in the Gulf of Mexico. The system is a UNet-based model created with a layered structure. They included some modules to improve the performance of the model. These modules are SCSE, FPA (feature pyramid attention) and AG (attention gate). The aim is to emphasize the important areas in the images and draw other areas to the background. Thus, while training the model, it will draw attention to important information areas. As a result of the study, it is stated that the modules used increase the performance of the system and high accuracy is achieved.
The aim of this study is to create a modern solution by adding modules to the deep learning model we have designed in order to increase its performance in detecting reserve areas. The modules we added are SCSE, ASPP and hypercolumn modules, which are frequently used especially in complex and small data sets. Although UNet and its derivatives have been widely used in seismic image processing in the literature, the detailed examination of the results and the use of these modules together is limited in the literature. In addition to the individual effects of these modules, the performance effect of the system created together is also investigated. The aim of using the modules together is to eliminate the deficiencies that occur when used separately. In this way, performance improvements are provided especially for small, precise and complex segmentation operations such as the detection of salt domes. In addition, the created system has a wide application potential not only in seismic images but also in precise segmentation studies such as medical images and satellite images. In this respect, measuring its usability in different areas forms a basis for future studies. As a result of this integration, we have proven the success of the modules in our system. The use of the three modules together has increased both the sensitivity and accuracy of the system. In addition, by analyzing the seismic image, it has contributed to the literature in the field of reserve management and energy production in the detection of fossil fuel areas.
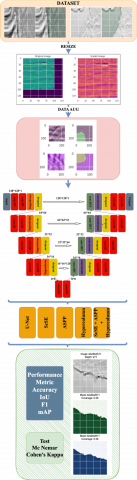
In our study, we developed a customized UNet for detecting salt domes from seismic images, which is an important criterion for detecting fossil fuel areas. To improve the performance of our system, various attention mechanisms and advanced modules have been added to our system. SCSE, ASPP and hypercolumn modules were added to our system. Thus, our system has improved its performance by obtaining both spatial and multilayer feature representations from images. The system and procedures developed for salt dome detection are shown in Figure 2.
Figure 2. System diagram
3.1 Dataset
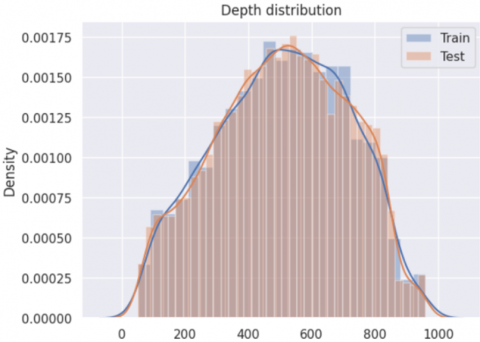
The dataset was shared by TGS-NOPEC Geophysical Company (TGS) through a contest on kaggle (https://www.kaggle.com/). The dataset consists of 101*101 seismic images. The TGS Salt Identification Challenge dataset is a dataset prepared for the segmentation of underground salt bodies in seismic images, obtained from many areas of the earth's surface. It was developed to accurately analyze the complex and heterogeneous structure of underground salt formations. The data consists of 2D image slices of a 3D view of the Earth's interior. 4000 labeled images are provided as training data, and each image contains mask images in binary format indicating regions with and without salt bodies. There are 18000 seismic images with png extension as test data. In the dataset, depth information is shared in feet, but the exact location of these depth values on the image is not specified. The depth information of the images is shown in Figure 3.
Figure 3. The depth information of the images
In Figure 3, the graph shows the depth distribution for the training and test datasets. The graph is constructed with a histogram and accompanying density curves comparing the distribution of depths (z) in both datasets. It can be seen that the z-values of the training and test data range from 0 to 1000 and both datasets show a similar distribution. Both distributions are symmetric, almost bell curve shaped, with average depth values concentrated at 500. This shows that the training and test datasets are homogeneous in terms of depth and the model has the chance to learn and test samples at different depth levels.
3.2 Image pre-processing
3.2.1 Re-size
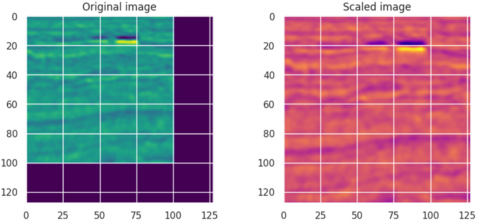
In our study, the dimensions of the original images are 101×101 pixels, and they have been resized to 128×128 pixels so that our system can use the data effectively and work in harmony with our model. The resized images allow more detail and information to be processed. The resizing was done for ease of processing and to optimize memory requirements in system processing. Example images for the original and rescaled images are shown in Figure 4.
Figure 4. Sample resized image
In the studies conducted, image size increase operations in deep learning systems have been stated as an important step to increase image quality [30]. It also defined the possibility of processing more details and better interpretation of information on images. Thus, it is aimed to increase the limited performance and learning capacity of the model. By making it compatible with the layered structure of the UNet architecture, we have contributed to the system performance. In addition, by increasing the capacity of our system to process the input data, our segmentation process has provided more successful results.
3.2.2 Data augmentation
Data augmentation is a method that enables the expansion of the data set by artificially duplicating images in small data sets [31]. It performs various transformations and adjustments on the data to artificially reproduce it. It aims to reproduce the data by playing with horizontal-vertical reflection, rotation at various angles, scaling in different dimensions, light and color adjustments. In systems trained with limited data, the generalization ability of the system may be limited. With data augmentation methods, the generalization capability can be increased, and overlearning can be reduced by increasing the data presented to the system. The expanded data set enables the developed system to be more robust to different constructs and thus perform well.
Since the dataset used in our study contains images and their masks in the training folder, attention should be paid to the mask and image matching when performing data augmentation operations. The data augmentation operations were processed simultaneously with the masks. The data augmentation method primarily used in our study is the horizontal flip method. This method is a general method used in many studies. Horizontal mirroring mirrors the images and allows them to be viewed from different angles. As the number of images that the system will see increases, the learning capacity will also increase. With the horizontal mirroring method, our training images are doubled, and the system is exposed to more data. Another data augmentation technique used in the study is the rotation of the images by 90, 180 and 270 degrees. With this technique, it is aimed to reduce the direction dependency by enabling the model to learn objects in different directions. These augmentation techniques have contributed to higher accuracy and segmentation success, especially by addressing uncertainties and variations in seismic images.
3.3 Used deep learning technologies
3.3.1 UNet
Convolutional neural networks were first introduced by LeNet in 1998 [32]. It has achieved high success especially in the field of computer vision. The general use of convolutional networks is to classify the image input into one of the output classes. Convolutional neural networks have limitations due to the size of the data sets and the length of the network structures. One of these limitations is the need for large data sets for the training process. However, due to reasons such as time, cost and hardware, there may be difficulties in creating these datasets. Data such as biomedical and seismic images are difficult to collect. To overcome these limitations, the UNet architecture was announced in 2015 as a type of CNN approach with the proposal of better segmentation on biomedical images [33]. UNet architecture consists of two parts: encoder and decoder. There are 9 layers in the designed network. Of these layers, 4 are encoder and 4 are decoder. The code structure of the model aims to extract increasingly complex features by increasing the number of channels at each stage from the input. Initially starting with a low number of neurons, the model is able to learn deeper and more complex features by increasing the number of channels in each downsampling stage. Each downsampling stage is performed with two 3×3 Conv2D layers and then the “Relu” function is used as the activation function. This helps the model to learn non-linear relationships. Then, in each post-sampling layer, different proportions of dropout layers were chosen as a precaution against overfitting. In the middle part of the model is the bottleneck layer, which extracts the features at the highest level. The number of channels is 16 times the initial number of neurons and additional features are learned. After the bottleneck layer, upsampling layers are applied to the model in an inverted structure. In each upsampling stage, the feature maps are concatenated with the corresponding downsampling layers to preserve the previously extracted features. At the end of the model, a 1×1 Conv2D layer processes the output with a sigmoid activation function for a two-class segmentation problem and returns a probability value for each pixel. This structure allows the model to work on low-dimensional inputs and produce high-quality segmentation outputs at the same time. Other hyper-parameters used in the study are given in Table 1.
Table 1. Other hyperparameters used in the study
|
Input size |
128*128*1 |
|
Optimizer |
Adam |
|
Batch size |
64 |
|
Epoch |
20 |
|
Loss fun. |
binary_crossentropy |
|
min_lr |
0.001 |
|
Score |
Accuracy, F1, IoU, mAP |
3.3.2 Spatial and Channel Squeeze & Excitation (SCSE)
SCSE blocks aim to implement both spatial and channel-based attention mechanisms. Therefore, it combines compression and excitation mechanisms. This method, which is frequently used in segmentation problems, is basically a twersion of SENet (Squeeze-and-Excitation Networks) [16]. With this module, a wide-area information gathering process that includes both attention mechanisms are achieved.
The module consists of two block components (Figure 5). Spatial Squeeze & Excitation (sSE) and Channel Squeeze & Excitation (cSE).
With the cSE blog, it adds special attention to the channels and realizes that separate filters learn different features. In this way, it is aimed to obtain a more meaningful representation by highlighting meaningful feature maps and discarding unnecessary ones.
The sSE blog processes individual spatial locations to identify valuable information in specific areas. One of the advantages of SCSE blocks is that they perform both spatial and channel-based information processing simultaneously, improving the overall performance of the model. This structure offers a richer attention mechanism than traditional SE blocks [16, 34]. In our study, compression is performed based on the size of the input tensor in the channel’s axis, where the number of channels is assigned to the filters variable and the shape of the tensor is transformed into (1, 1, filters) dimensions. In the SE block, an intermediate fully connected layer (Dense) of size filters//16, obtained by reducing the number of channels by a factor of 16, is created and the relu activation function is used. The ‘he_normal’ method is used to initialize the weights. The second fully connected layer is weighted by a sigmoid activation according to the input channel size. Finally, the excitation process is completed by multiplying the squeezed data by the input tensor.
Figure 5. The SCSE module used in our system
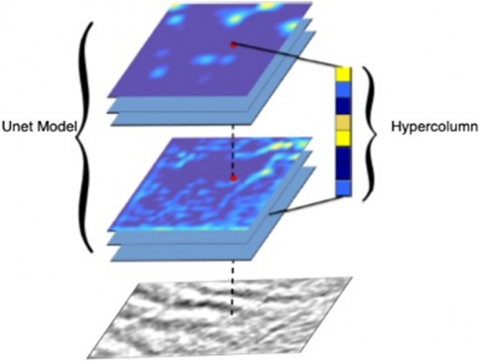
3.3.3 Hypercolumn
Hypercolumn is a technique that aims to combine feature maps from various layers of a deep learning model so that each pixel has a much richer representation. This method is used in image segmentation, object recognition and other computer vision applications [18]. Its working principle is based on the idea that each pixel of an image is represented by combining activation values from different levels of the network (deep and surface layers). In deep learning architectures consisting of layered structures, data creates different degrees of information in each layer. In these architectures, simple and low-level features are created in the initial layers (Figure 6). As the lower layers are reached, more detailed, abstract and high-level features are learned. With the hypercolumn structure, different degrees of information from these layers are collected. In this way, both low-order feature details and high-order conceptual information captured from the image are met simultaneously [18].
By incorporating hypercolumn into our system, we can achieve better performance results by aggregating pixel classification in our images with different degrees of information [35]. Since they are not specific to a particular architecture, they can be used in image segmentation problems [36]. In the system designed in our study, the UpSampling2D layer used in the Keras library was enlarged by increasing the size of the input feature map by scale factors of 2*2, 4*4, 8*8. In this way, it is aimed to keep the information loss at low levels. Hypercolumn improves the performance of the result, especially by capturing the details in the image. With the Concatenate command, all layers brought to the same spatial dimension are collected on the depth axis. A 1*1 convolution is performed on the output layer and a sigmoid activation function is performed. As a result, it creates a single output pixel. Thus, it establishes a segmentation mask.
Figure 6. Hypercolumn module
3.3.4 ASPP
ASPP is a module that realizes the detection of multi-scale features. It is used in segmentation problems as it generally improves performance results. Extended convolution layers of different values are used simultaneously to perform information extraction. In this way, image-specific details and large-scale structures are collected in a sequence of layers [17]. This module is useful when the complexity of the image data is high, object boundaries are not clear, and objects are of different sizes in each image. The ASPP module is used to prevent the loss of information that can occur in classical convolution layers. By capturing context information, it ensures that the model created preserves detailed features [36]. The ASPP module contributes to the sharper and more accurate detection of the areas to be distinguished in the image. Especially in complex images such as seismic images, it provides better generalization of the system by capturing and collecting structural information at all levels. A combination of Atrous convolution layers is applied in our study. During the convolution process, gaps are added between kernel elements to enlarge their detection area. To capture the surrounding contextual information without increasing the kernel size, different gap ratios are given. The gap ratios given in our study are 6, 12, 18. Thus, feature information in the image can be analyzed in a larger area. The outputs generated as a result of the module are summed with the concatenate function. In this way, the feature maps obtained from different gap ratios can be used together. With the ASPP module, information from different levels is combined to create a broader representation.
The modules used in the study increase the performance of the created system. In seismic images, due to their structure, unclear boundaries and low contrast can cause important details to be lost [37]. The image complexity and noise level in the data negatively affect the performance of the created system. At this point, the SCSE module can emphasize important features and suppress less important places. Thus, it can direct the attention of the system to certain features [38, 39]. It also increases the effect on performance by reducing the complexity of the model. It can achieve success in missing data situations by providing less calculations. In this respect, the SCSE module provides flexibility and performance to the system [40]. High values were obtained when working with complex background, noise, and low-contrast objects in image data [38]. In the comparisons made by taking these situations into account, it was stated that it offers better performance than FPN structures [41]. Seismic data may contain structures at different scales (small details, large geometric structures). The ASPP module prevents information loss by bringing together convolutions of different amplitudes. Therefore, it is important in terms of improving the overall performance of the model by increasing the extraction of multi-scale features. Thus, it increases the representation power of the network [42]. Studies conducted with the ASPP module show that it facilitates the segmentation of small objects by simultaneously addressing different cortices and increases the speed of the model [43]. In addition, it is stated in studies conducted with a small number of data sets and in dealing with data imbalance [44]. Due to the structural complexity of seismic images, difficulties are encountered in detecting the regions to be distinguished [37]. Hypercolumn aims to better represent high-level geometric and topological features in the image. Thus, the detection of edges and shapes in the image will be more sensitive [45]. Since deep network architectures generally do not combine information from different layers, they limit the simultaneous use of both low-level (edges, textures) and high-level (object identities) features. The hypercolumn module provides convenience in detecting existing structures in the image by combining the excitations of pixels in different directions for each image. It can create richer information by combining information from different layers in the image in image processing processes [46]. The hypercolumn module was selected because it performs operations on the image in a simple and effective way and works on pixel-level details. The reflection of seismic waves from different layers underground and representing underground structures with the created image is a very sensitive and important process. Traditional methods may be insufficient in detecting structurally different areas in the image [10]. Studies show that the use of hypercolumn in the detection of reserve areas provides better interpretation when used with the developing system [47].
3.3.5 Evaluation score
In our study, we used accuracy, IoU, F1 and mAP metrics to evaluate the performance of our model. Accuracy is defined as the ratio of the number of samples that our model can correctly classify to the total number of samples. It provides information about the overall success of the model [48]. However, it can be misleading in irregular data sets. This is because accuracy is calculated without taking into account the class distributions in the data set. The IoU evaluation score is a measure of how well the system's predicted region matches the correct region. Since it is a method that evaluates pixel-level accuracy, it is frequently used in segmentation and object detection [49, 50]. The F1 evaluation score makes a calculation by considering the precision and recall values. In this calculation, the harmonic mean of these two values is taken. It gives more reliable results especially in irregular data sets. It measures the balanced performance of the created system by using false positives and false negatives when calculating the evaluation [51]. mAP evaluation score shows the agreement between precision and recall values. It expresses the sensitivity of the designed system to false positives and false negatives [52]. After performing the evaluation process of our study, Mc Nemar and Cohen's Kappa statistical methods were checked to measure the significance of the systems created. The McNemar test is a statistical method used to compare the performance of two dependent classification algorithms and is widely used to evaluate significant differences, especially in binary classification problems [53]. It is also used in the field of artificial intelligence to statistically test the results of the system [54]. Cohen's Kappa statistical method is a metric that evaluates the agreement between two raters or classifiers. This metric performs the test by taking into account the coincidental agreement between the raters [55].
In our study, we aim to evaluate the system performance from different aspects with the metrics we use to evaluate the results of our model. Detecting false positives and negatives from systems where complex images such as seismic images are used can have serious consequences in applications. In the literature, the IoU metric is often used to evaluate the result in salt field detection [56-58]. The IoU metric aims to prevent possible misidentifications by understanding how much the real mask and the estimated mask overlap. The salt dome incorrectly defined in the images can cause time-consuming and costly errors in drilling processes.
The overall performance of the model we created was aimed to evaluate the balance between accuracy and sensitivity with the F1 score used in our study. The improvements observed in the evaluation metrics can translate into more sensitive and reliable results in real-world applications [59, 60]. The results obtained from these metrics in the industrial field contribute to better decision-making processes.
Another metric that we evaluate the performance of the created model is to analyze the prediction performance in different class areas with mAP. This metric provides information about the general sensitivity and performance of the model by calculating the average accuracy for each class. In particular, the mAP value should be high to increase the reliability of the model's predictions [61]. The improvements made by taking the mAP metric into account provide ease in detecting different structures on seismic data. In real-world applications, it is very effective in the efficient use of resources with its effect on the sensitive detection process. For this reason, using the mAP evaluation metric is important both for comprehensively investigating the model performance and for highlighting its practical results in seismic segmentation methods.
With segmentation methods, certain areas and objects can be identified in image data. The segmentation process, which was first used in medical images, is now used in every field. In our study, we investigated the contribution of SCSE, ASPP and hypercolumn modules to salt area detection in the UNet model, which is a deep learning method using TGS Salt Identification Challange seismic images. We conducted our study on the Kaggle platform using the provided GPU infrastructure at 100% capacity. Python programming language was preferred to train and evaluate our deep learning model. In the Python environment, Keras and TensorFlow libraries were used to manage modeling and training processes, while NumPy, pandas, scikit-learn were preferred for data processing and analysis. In order to compare the time spent by each module for computational operations during the training period in the created system, the times spent per epoch are presented in Table 2. This analysis reveals the reactions of the modules added to the system to the processing load in a more comprehensive way. Thus, it is evaluated which model contributes more efficiently to the training process in terms of computation of the system.
Table 2. Time the system spends per epoch
|
Model |
Time |
|
Unet |
95s |
|
SCSE |
114s |
|
Hypercolumn |
97s |
|
ASPP |
162s |
|
All |
191s |
In our study, we designed a segmentation system for salt area detection on seismic images using UNet architecture, one of the deep learning methods. In order to successfully capture the complex features on the data, some pre-processing steps were applied. The image size was increased from 101×101 pixels to 128×128 pixels to increase the learning capacity and to make it compatible with the layered structure. In addition, pixel values were normalized between 0 and 1. Thus, the training process of the system was made faster and more stable. Subsequently, data augmentation processes were applied on the images to increase the generalization capability of the system and to provide resistance to overfitting. Among the data augmentation methods, horizontal projection and rotation of the images by 90, 180 and 270 degrees were applied.
In the study, the integration of SCSE, ASPP and Hypercolumn modules into the created UNet architecture is precisely designed. The SCSE module is added after the conv2D layers in the encoder and decoder blocks. In this way, attention mechanisms are provided in both spatial and channel dimensions. With the ASPP module added to the Middle block, a wide range of information is created by combining features from different scales. The Hypercolumn module is added to the last layer to perform detailed segmentation using feature maps from different layers. It is aimed to contribute to the system performance from different areas with all three modules. The effect of these contributions on the result evaluation is investigated by using them together. While the SCSE module ensures the selection of important features without losing details, the ASPP module provides multi-scale comprehensive data. With the Hypercolumn module, the general performance is increased by collecting information from different areas. This combination offers a solution for better analysis of complex structures on seismic images.
In the study, performance results are observed for the contribution of each module and combination to the system. The effects on performance measurement metrics were investigated by performing their combinations with individual and other modules. In addition to the individual effects of the modules, the performance of their binary combinations was also investigated. In binary combination evaluation studies, it was observed that the system results contributed, but this increase was measured to be limited compared to the case where all modules were used together. It was observed that there was a significant synergy when all modules were used together and in this case the system could perform better analysis of more complex boundaries. With these results, it is evaluated that the proposed approach offers a framework that is applicable not only for seismic image segmentation but also for other segmentation problems.
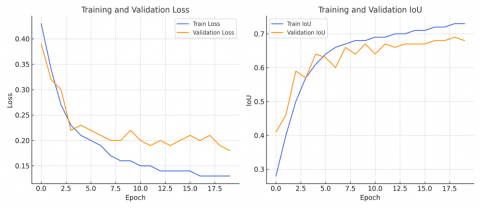
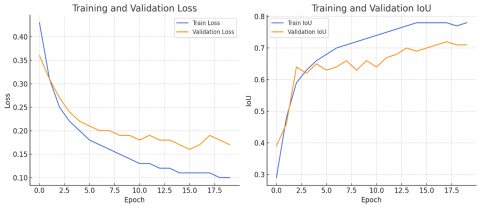
In our study, first of all, a UNet network designed without adding any modules was created. SCSE, ASPP and hypercolumn modules were added to this network and performance values were compared. The obtained train and validation loss and IoU values are shown in Figure 7.
In our study, we use SCSE, ASPP and hypercolumn modules together within the same model structure to enable the model to capture more comprehensive and richer information at different levels of feature extraction. The combination of these three modules strengthens not only the precision of the model, but also its ability to understand more complex and multi-scale features. The results show that the added modules improve the original performance of UNet.
The ASPP module increased the accuracy of the added modules more than the others. The same results were observed in the F1 metric. When the modules were added individually, the SCSE module was found to improve the system the least. The highest accuracy value was obtained when all modules were used together. The highest value obtained in the F1 score calculated by taking into account the accuracy and sensitivity metrics is the model where all modules are used together. It was observed that the hypercolumn module was not effective enough in improving the system performance. Considering all metrics, the best measurements were obtained from the system using all modules. The performance measurement results obtained from the systems are shown in Figure 8.
We compare our developed system with other studies. As seen in Table 3, it has shown better performance than existing methods. The created system reached 86.34 as the IoU metric.
UNet
SCSE Module
ASPP Module
Hypercolumn Module
SCSE+ASPP+Hypercolumn
Figure 7. Loss and IoU graphs of modules added to the UNet model (20 epochs)
Table 3. Some segmentation results in the literature
|
Method-Reference |
Metric |
Result |
|
UNet+SE-Resnet [62] |
IoU |
84 |
|
UNet [56] |
IoU |
70 |
|
Reverse attention UNet [57] |
IoU |
86 |
|
UNet [24] |
IoU |
85.8 |
|
DCNN [63] |
Accuracy |
80 |
|
UNet-ResNet34 [64] |
IoU |
85.2 |
|
UNET+SE+RESNET [22] |
IoU |
84 |
|
3D UNet [59] |
F1 |
86.07 |
|
CNN [65] |
F1 |
64 |
|
Our Study |
IoU/F1 |
86.34/87.33 |
Figure 8. Performance of the modules
Mc Nemar and Cohen's Kappa methods were applied to understand the statistical significance of the results. The Mc Nemar test is usually applied to show whether there is a significant difference in the proportions of a particular attribute between two conditions. This difference is called z score [53]. In Mc Nemar's method, the arrowheads (←,↑) in Table 3 indicate which of the two systems performs better. The z scores next to the arrowheads indicate how statistically significant the results are. The higher the z score, the more significant the difference between the performance of the two models. The z score is calculated using Eq. (1):
$z=\frac{\left(\left|N_{s f}-N_{f s}\right|-1\right)}{\sqrt{N_{s f}+N_{f s}}}$ (1)
Here, Nsf and Nfs denote the number of paired observations between two models, where one model succeeds and the other fails. Table 4 shows that the model with the highest system performance in all comparisons is the All model in which all modules are used together. Among the modules added to the UNet model, it is seen that the ASPP module increases the performance of the system the most.
Table 4. Mc Nemar’s test results
|
|
ASPP |
Hypercolumn |
SCSE |
UNet |
|
All |
2.13← |
3.80← |
3.34← |
4.35← |
|
ASPP |
|
5.07← |
5.31← |
1.80← |
|
Hypercolumn |
|
|
1.94↑ |
4.45← |
|
SCSE |
|
|
|
3.07← |
Cohen's Kappa is a statistical method that measures the agreement between two raters or classifiers. Since it takes random agreement into account, it provides a more meaningful measure than simple accuracy calculations [55]. By analyzing the results we obtained in our study with Cohen's Kappa statistical method, we also examined our models from a different perspective. Thus, we compared our model results and measured the agreement between them with a different method.
According to the results I obtained in Table 5, Cohen's Kappa values of all models are above 0.8. This shows that the models work with very high accuracy and give consistent results in classifications. The model using all modules together provides the highest Kappa value (0.8304). This clearly shows that the combination of modules improves the performance of the model. The ASPP module is observed to significantly increase the Kappa values. According to Cohen's Kappa analysis, it can be concluded that the combination of all modules (SCSE, ASPP and Hypercolumn) improved the classification agreement of the model and provided the highest performance.
Table 5. Cohen’s Kappa’s test results
|
Model |
Cohen's Kappa Value |
|
UNet |
0.8002 |
|
Hypercolumn |
0.8171 |
|
SCSE |
0.8232 |
|
ASPP |
0.8297 |
|
All |
0.8304 |
In our study, a deep learning based model was developed to improve the segmentation task using seismic image data and the effects of SCSE, Hypercolumn and ASPP modules on the system were investigated to improve the performance of the model. Before proceeding with the system design, a resizing process was applied on the data. Since the number of data is 4000 images and 4000 mask images, data replication was performed. The UNet model was designed as the main system in the study, which achieved high performance even with low data sets. Additional modules were added to improve the performance of the designed system. Accuracy, IoU, F1 and mAP metrics were used to evaluate the system performances. At the end of the study, Mc Nemar and Cohen's Kappa statistical methods were used to analyze the significance of the result values. This study examines a deep learning-based model developed on seismic image segmentation and aims to use it for reserve/fossil fuel detection. As a result of the study, it was observed that when the ASPP module is added alone, it provides a significant improvement in segmentation accuracy by effectively capturing details at different resolutions (IoU 77.75). On the other hand, the simultaneous integration of scSE, ASPP and hypercolumn modules further improved the segmentation performance of the model, leading to the highest performance values (IoU 86.34). This combination enabled the model to learn fine details more effectively, especially in complex data, and to increase its overall accuracy. These results show that the combination of modules strengthens the model's ability to learn details more comprehensively and contributes positively to the generalization performance of the model. Compared to traditional U-Net models previously used in the literature, the integration of SCSE, ASPP and hypercolumn modifications showed significant improvements in both IoU and F1 scores [8, 32].
However, the model has some limitations. In particular, the challenges faced during the study, especially with the limited amount of labeled data and the processing power demand of some modules, were significant obstacles. The longer training time made it difficult to repeat the experiments and necessitated a more careful examination of the hyperparameter settings.
The generalization ability of the system created with the small amount of data in the training set was limited and there was a risk of over-learning. Data augmentation techniques were applied to prevent this situation. The performance metrics shown by the model were carefully analyzed. In addition, it took time to determine the optimal combinations of the modules added during the adjustment of the hyper parameters of the system. While analyzing the effect of the modules on the system performance, it was observed that their contributions in some modules were limited compared to other combinations. In our future studies, it is planned to test the system in the future if access to wider and more diverse data sets is provided. Thus, the performance results of the created system with more complex and dense seismic structures can be observed and its understanding of the data and generalization capacity can be measured. It is also considered to investigate the effect of modules in transformer-based approaches on seismic data. Such architectures can be effective in complex and different-scale data such as seismic data. In this way, it can be investigated that the system is effective in wider application areas.
By testing the model on a larger dataset and experimenting with alternative modules, the performance of the model can be evaluated more comprehensively. Furthermore, comparing the model with modules added in different deep learning architectures (e.g., UNet++ or ResUNet) may provide a new perspective to the literature.
[1] Johansson, P.O., Kriström, B. (2019). Welfare evaluation of subsidies to renewable energy in general equilibrium: Theory and application. Energy Economics, 83: 144-155. https://doi.org/10.1016/j.eneco.2019.06.024
[2] Yıldırım, C., Dağdemir, Ö. (2018). Türkiye’de ekonomik büyüme ve elektrik tüketimi ilişkisi. Sakarya İktisat Dergisi, 7(4): 57-76.
[3] Yılankırkan, N., Doğan, H. (2020). Türkiye’nin enerji görünümü ve 2023 yılı birincil enerji arz projeksiyonu. Batman Üniversitesi Yaşam Bilimleri Dergisi, 10(2): 77-92.
[4] Kaygusuz, K. (2007). Energy for sustainable development: Key issues and challenges. Energy Sources, Part B: Economics, Planning, and Policy, 2(1): 73-83. https://doi.org/10.1080/15567240500402560
[5] Li, H., Hu, Q.T., Mao, Y., Niu, F.L,, Liu, C. (2022). Deep learning-based model for automatic salt rock segmentation. Rock Mechanics and Rock Engineering, 55(6): 3735-3747. https://doi.org/10.1007/s00603-021-02673-y
[6] Whittemore, D.O. (1995). Geochemical differentiation of oil and gas brine from other saltwater sources contaminating water resources: Case studies from Kansas and Oklahoma. Environmental Geosciences, 2(1): 15-31.
[7] Lu, M. (2010). Rock engineering problems related to underground hydrocarbon storage. Journal of Rock Mechanics and Geotechnical Engineering, 2(4): 289-297. https://doi.org/10.3724/SP.J.1235.2010.00289
[8] Milosavljević, A. (2020). Identification of salt deposits on seismic images using deep learning method for semantic segmentation. ISPRS International Journal of Geo-Information, 9(1): 24. https://doi.org/10.3390/ijgi9010024
[9] Wu, X., Liang, L., Shi, Y., Fomel, S. (2019). FaultSeg3D: Using synthetic data sets to train an end-to-end convolutional neural network for 3D seismic fault segmentation. Geophysics, 84(3): IM35-IM45. https://doi.org/10.1190/geo2018-0646.1
[10] Islam, M.S.U., Wali, A. (2024). A comprehensive review of deep learning techniques for salt dome segmentation in seismic images. Journal of Applied Geophysics, 230: 105504. https://doi.org/10.1016/j.jappgeo.2024.105504
[11] Yin, Z., Erdinc, H.T., Gahlot, A.P., Louboutin, M., Herrmann, F.J. (2023). Derisking geologic carbon storage from high-resolution time-lapse seismic to explainable leakage detection. The Leading Edge, 42(1): 69-76. https://doi.org/10.1190/tle42010069.1
[12] Alabdulkreem, E., Elmannai, H., Saad, A., Kamil, I.S., Elaraby, A. (2024). Deep learning-based classification of melanoma and non-melanoma skin cancer. Traitement du Signal, 41(1): 213-223. https://doi.org/10.18280/ts.410117
[13] Ağaoğlu, B., Askerzade, İ., Bostancı, G.E., Medeni, T. (2024). Effect of data augmentation method in applied science data-based salt area estimation with U-Net. Türkiye Teknoloji ve Uygulamalı Bilimler Dergisi, 5(2): 70-86. https://doi.org/10.70562/tubid.1474999
[14] Souadih, K., Mohammedi, A., Chergui, S. (2024). Accurate identification of salt domes using deep learning techniques: Transformers, generative artificial intelligence and liquid state machines. Geophysical Prospecting, 72(9): 3280-3294. https://doi.org/10.1111/1365-2478.13603
[15] Zhou, H., Xu, S., Ionescu, G., Laomana, M., Weber, N. (2020). Salt interpretation with U-SaltNet. SEG International Exposition and Annual Meeting, pp. D021S008R001. https://doi.org/10.1190/segam2020-3423283.1
[16] Roy, A.G., Navab, N., Wachinger, C. (2018). Concurrent spatial and channel ‘squeeze & excitation’in fully convolutional networks. In Medical Image Computing and Computer Assisted Intervention–MICCAI 2018: 21st International Conference, Granada, Spain, pp. 421-429. https://doi.org/10.1007/978-3-030-00928-1_48
[17] Chen, L.C., Papandreou, G., Kokkinos, I., Murphy, K., Yuille, A.L. (2017). DeepLab: Semantic image segmentation with deep convolutional nets, atrous convolution, and fully connected CRFs. IEEE Transactions on Pattern Analysis and Machine Intelligence, 40(4): 834-848. https://doi.org/10.1109/TPAMI.2017.2699184
[18] Hariharan, B., Arbeláez, P., Girshick, R., Malik, J. (2015). Hypercolumns for object segmentation and fine-grained localization. In Proceedings of the IEEE Conference on Computer Vision and Pattern Recognition, Boston, USA, pp. 447-456. https://doi.org/10.1109/CVPR.2015.7298642
[19] Karchevskiy, M., Ashrapov, I., Kozinkin, L. (2018). Automatic salt deposits segmentation: A deep learning approach. arXiv preprint arXiv: 1812.01429. https://doi.org/10.48550/arXiv.1812.01429
[20] Hatton, L., Worthington, M.H., Makin, J. (1986). Seismic data processing: Theory and practice. Merlin Profiles Ltd., USA. https://www.osti.gov/biblio/7097424.
[21] Zhang, G., Wang, Z., Chen, Y. (2018). Deep learning for seismic lithology prediction. Geophysical Journal International, 215(2): 1368-1387. https://doi.org/10.1093/gji/ggy344
[22] Zeng, Y., Jiang, K., Chen, J. (2019). Automatic seismic salt interpretation with deep convolutional neural networks. In Proceedings of the 2019 3rd International Conference on Information System and Data Mining, Houston, USA, pp. 16-20. https://doi.org/10.1145/3325917.3325926
[23] Guo, J.T., Xu, L.F., Ding, J.S., He, B., Dai, S.X., Liu, F.Y. (2020). A deep supervised edge optimization algorithm for salt body segmentation. IEEE Geoscience and Remote Sensing Letters, 18(10): 1746-1750. https://doi.org/10.1109/LGRS.2020.3007258
[24] Bodapati, J.D., Sajja, R., Naralasetti, V. (2023). An efficient approach for semantic segmentation of salt domes in seismic images using improved UNET architecture. Journal of The Institution of Engineers (India): Series B, 104(3): 569-578. https://doi.org/10.1007/s40031-023-00875-2
[25] Li, K., Song, J., Xia, S., Luo, B., Wang, J.K., Zhong, Y., Ren, S. (2023). Salt structure identification based on U-net model with target flip, multiple distillation and self-distillation methods. Frontiers in Earth Science, 10: 1071637. https://doi.org/10.3389/feart.2022.1071637
[26] Bochu, R.R., Buddha, N.K. (2023). Salt segment identification in seismic images of earth surface using deep learning techniques. In 2023 Second International Conference on Electronics and Renewable Systems (ICEARS), Tuticorin, India pp. 1290-1295. https://doi.org/10.1109/ICEARS56392.2023.10085475
[27] Sheng, H.L., Wu, X.M., Si, X., Li, J.T., Zhang, S.B., Duan, X.D. (2023). Seismic foundation model (SFM): A new generation deep learning model in geophysics. arXiv preprint arXiv: 2309.02791. https://doi.org/10.48550/arXiv.2309.02791
[28] Liu, B., Jing, H.P., Li, J.Q., Li, Y., Qu, G.Z., Gu, R.T. (2019). Image segmentation of salt deposits using deep convolutional neural network. In 2019 IEEE International Conference on Systems, Man and Cybernetics (SMC), Bari, Italy, pp. 3304-3309. https://doi.org/10.1109/SMC.2019.8913858
[29] Chung, Y.D., Lu, W.K., Tian, X.Y. (2022). Data cleansing for salt dome dataset with noise robust network on segmentation task. IEEE Geoscience and Remote Sensing Letters, 19: 1-5. https://doi.org/10.1109/LGRS.2022.3170497
[30] Bao, Q.Q., Hui, Z., Zhu, R., Ren, P.R., Xie, X.S., Yang, W.M. (2024). Improving diffusion-based image restoration with error contraction and error correction. In Proceedings of the AAAI Conference on Artificial Intelligence, Vancouver, Canada, 38(2): 756-764. https://doi.org/10.1609/aaai.v38i2.27833
[31] Shorten, C., Khoshgoftaar, T.M. (2019). A survey on image data augmentation for deep learning. Journal of Big Data, 6(1): 1-48. https://doi.org/10.1186/s40537-019-0197-0
[32] LeCun, Y., Bottou, L., Bengio, Y., Haffner, P. (1998). Gradient-based learning applied to document recognition. Proceedings of the IEEE, 86(11): 2278-2324. https://doi.org/10.1109/5.726791
[33] Ronneberger, O., Fischer, P., Brox, T. (2015). U-net: Convolutional networks for biomedical image segmentation. In Medical Image Computing and Computer-Assisted Intervention-MICCAI 2015: 18th International Conference, Munich, Germany, pp. 234-241. https://doi.org/10.1007/978-3-319-24574-4_28
[34] Chen, L.C., Zhu, Y.K., Papandreou, G., Schroff, F., Adam, H. (2018). Encoder-decoder with atrous separable convolution for semantic image segmentation. In Proceedings of the European Conference on Computer Vision (ECCV), Munich, Germany, pp. 801-818.
[35] Long, J., Shelhamer, E., Darrell, T. (2015). Fully convolutional networks for semantic segmentation. In Proceedings of the IEEE Conference on Computer Vision and Pattern Recognition, Boston, USA, pp. 3431-3440.
[36] Yu, F., Koltun, V. (2015). Multi-scale context aggregation by dilated convolutions. arXiv preprint arXiv: 1511.07122. https://doi.org/10.48550/arXiv.1511.07122
[37] Ao, Y.L., Lu, W.K., Jiang, B.W., Monkam, P. (2020). Seismic structural curvature volume extraction with convolutional neural networks. IEEE Transactions on Geoscience and Remote Sensing, 59(9): 7370-7384. https://doi.org/10.1109/TGRS.2020.3042098
[38] Qiao, W.T., Liu, Q.W., Wu, X.G., Ma, B., Li, G. (2021). Automatic pixel-level pavement crack recognition using a deep feature aggregation segmentation network with a scSE attention mechanism module. Sensors, 21(9): 2902. https://doi.org/10.3390/s21092902
[39] Guo, X.F., Wan, J.H., Liu, S.W., Xu, M.M., Sheng, H., Yasir, M. (2021). A scse-linknet deep learning model for daytime sea fog detection. Remote Sensing, 13(24): 5163. https://doi.org/10.3390/rs13245163
[40] Jiang, Z., Luo, T., Liang, X. (2024). Deep incomplete multi-view learning network with insufficient label information. In Proceedings of the AAAI Conference on Artificial Intelligence, Vancouver, Canada, 38(11): 12919-12927. https://doi.org/10.1609/aaai.v38i11.29189
[41] Lu, Y., Shi, D.X., Li, R.H., Zhang, Y., Jing, L.X., Yang, S. (2022). SCSE-E2VID: Improved event-based video reconstruction with an event camera. In 2022 IEEE International Conference on Systems, Man, and Cybernetics (SMC), Prague, Czech Republic, pp. 3249-3254. https://doi.org/10.1109/SMC53654.2022.9945237
[42] Ding, P., Qian, H.M., Zhou, Y.P., Yan, S., Feng, S.B., Yu, S. (2023). Real-time efficient semantic segmentation network based on improved ASPP and parallel fusion module in complex scenes. Journal of Real-Time Image Processing, 20(3): 41. https://doi.org/10.1007/s11554-023-01298-4
[43] Chidanand, K.S., Al-Stouhi, S. (2021). Multi-scale voxel class balanced ASPP for LIDAR pointcloud semantic segmentation. In Proceedings of the IEEE/CVF Winter Conference on Applications of Computer Vision, Waikoloa, USA, pp. 117-124.
[44] Cai, B., Xu, Q., Yang, C., Lu, Y., Ge, C., Wang, Z.C., Liu, K., Chang, S. (2023). Spine MRI image segmentation method based on ASPP and U-Net network. Mathematical Biosciences and Engineering, 20: 15999-16014. https://doi.org/10.3934/mbe.2023713
[45] Wei, H., Dong, Z., Liu, B. (2017). Hypercolumn-array based image representation and its application to shape-based object detection. Applied Soft Computing, 52: 333-347. https://doi.org/10.1016/j.asoc.2016.10.031
[46] Gaillard, A., Wunsch II, D.C., Escobedo, R.A. (1990). Neural hypercolumn architecture for the preprocessing of radiographic weld images. Applications of Artificial Neural Networks, 1294: 378-388. https://doi.org/10.1117/12.21189
[47] Han, J.G., Lü, Q.T., Gu, B.L., Xing, Z.T. (2022). Gaussian beam summation migration of deep reflection seismic data: Numerical examples. IEEE Geoscience and Remote Sensing Letters, 19: 1-5. https://doi.org/10.1109/LGRS.2022.3224211
[48] Powers, D.M. (2020). Evaluation: From precision, recall and F-measure to ROC, informedness, markedness and correlation. arXiv preprint arXiv: 2010.16061. https://doi.org/10.48550/arXiv.2010.16061
[49] Jaccard, P. (1912). The distribution of the flora in the alpine zone. New Phytologist, 11(2): 37-50. https://doi.org/10.1111/j.1469-8137.1912.tb05611.x
[50] Rezatofighi, H., Tsoi, N., Gwak, J., Sadeghian, A., Reid, I., Savarese, S. (2019). Generalized intersection over union: A metric and a loss for bounding box regression. In Proceedings of the IEEE/CVF Conference on Computer Vision and Pattern Recognition, pp. 658-666.
[51] Van Rijsbergen, C.J. (1974). Foundation of evaluation. Journal of Documentation, 30(4): 365-373. https://doi.org/10.1108/eb026584
[52] Everingham, M., Van Gool, L., Williams, C.K., Winn, J., Zisserman, A. (2010). The pascal visual object classes (voc) challenge. International Journal of Computer Vision, 88: 303-338. https://doi.org/10.1007/s11263-009-0275-4
[53] McNemar, Q. (1947). Note on the sampling error of the difference between correlated proportions or percentages. Psychometrika, 12(2): 153-157. https://doi.org/10.1007/BF02295996
[54] Bostanci, B., Bostanci, E. (2013). An evaluation of classification algorithms using Mc Nemar’s test. In Proceedings of Seventh International Conference on Bio-Inspired Computing: Theories and Applications (BIC-TA 2012), Gwalior, India, pp. 15-26. https://doi.org/10.1007/978-81-322-1038-2_2
[55] Cohen, J. (1960). A coefficient of agreement for nominal scales. Educational and Psychological Measurement, 20(1): 37-46. https://doi.org/10.1177/001316446002000104
[56] Naoui, M.A., Abdelhamid, N.M., Lejdel, B., Kazar, O., Berrehouma, N., Berrehouma, R. (2021). Deep learning for seismic data semantic segmentation. In International Conference on Artificial Intelligence and its Applications, pp. 479-485. https://doi.org/10.1007/978-3-030-96311-8_44
[57] Lou, L., Zhang, F., Han, B. (2022). Research on salt dome recognition algorithm based on reverse attention mechanism. In International Conference on Intelligent and Human-Computer Interaction Technology (IHCIT 2022), Zhuhai, China, 12344: 364-368. https://doi.org/10.1117/12.2655333
[58] Alfarhan, M., Deriche, M., Maalej, A. (2020). Robust concurrent detection of salt domes and faults in seismic surveys using an improved UNet architecture. IEEE Access, 10: 39424-39435. https://doi.org/10.1109/ACCESS.2020.3043973
[59] Zhang, H., Zhu, P.M., Liao, Z.Y. (2023). SaltISNet3D: Interactive salt segmentation from 3D seismic images using deep learning. Remote Sensing, 15(9): 2319. https://doi.org/10.3390/rs15092319
[60] Arsha, P.V., Thulasidharan, P.P. (2021). Salt body segmentation in seismic images using mask R-CNN. In 2021 International Conference on Communication, Control and Information Sciences (ICCISc), Idukki, India, pp. 1-6. https://doi.org/10.1109/ICCISc52257.2021.9484955
[61] Sun, X.Y., Zhao, Z.K., Wei, L.L., Lang, C.Y., Cai, M.X., Han, L.F., Wang, J., Li, B., Guo, Y.X. (2024). RL-SeqISP: Reinforcement learning-based sequential optimization for image signal processing. Proceedings of the AAAI Conference on Artificial Intelligence, 38(5): 5025-5033. https://doi.org/10.1609/aaai.v38i5.28307
[62] ul Islam, M.S. (2020). Using deep learning based methods to classify salt bodies in seismic images. Journal of Applied Geophysics, 178: 104054. https://doi.org/10.1016/j.jappgeo.2020.104054
[63] Di, H.B., Wang, Z., AlRegib, G. (2018). Real-time seismic-image interpretation via deconvolutional neural network. In SEG International Exposition and Annual Meeting, California, USA, pp. SEG-2018. https://doi.org/10.1190/segam2018-2997303.1
[64] Sen, S., Kainkaryam, S., Ong, C., Sharma, A. (2019). Regularization strategies for deep-learning-based salt model building. Interpretation, 7(4): T911-T922. https://doi.org/10.1190/INT-2018-0229.1
[65] Di, H.B., AlRegib, G. (2020). A comparison of seismic saltbody interpretation via neural networks at sample and pattern levels. Geophysical Prospecting, 68(2): 521-535. https://doi.org/10.1111/1365-2478.12865