Yingyan Luo![]() | Jie Shen
| Jie Shen![]() | Jialei Chen
| Jialei Chen![]() | Zhenzhen Wu*
| Zhenzhen Wu*![]()
© 2025 The authors. This article is published by IIETA and is licensed under the CC BY 4.0 license (http://creativecommons.org/licenses/by/4.0/).
OPEN ACCESS
By the end of 2023, there were approximately 220 million elderly patients aged 60 and above in China, with the incidence of stroke increasing significantly with age. The incidence rate for those over 75 is 5 to 8 times higher than that of individuals aged 45-55. Elderly strokes typically have an acute onset and rapid progression, making early detection critical for prognosis. Medical research has shown that left ventricular hypertrophy (LVH) on an electrocardiogram (ECG) is an independent risk factor for stroke in patients. Therefore, this study aims to develop an intelligent diagnostic model for stroke in elderly patients. First, we analyze 12-lead ECG data from health check-ups of elderly patients over 60 years old to construct a LVH classification model. This model, based on convolutional neural networks (CNN) and Transformer networks, extracts ECG features from both local waveform characteristics and global long-range dependencies. The fusion of abnormal ECG features improves the model's ability to identify specific LVH rhythm types associated with certain leads, while the inclusion of global context information optimizes model performance. Experiments demonstrate that the model, tested on a self-built dataset, achieves sensitivity, specificity, accuracy, and F1 score of 0.81, 0.92, 0.87, and 0.91, respectively, with an AUC of 0.91. Subsequently, we integrate MRI image segmentation technology to assist doctors in diagnosing lesion areas. We propose an MRI image segmentation model based on an improved UNet network with an attention mechanism. Experimental results show that the stroke image segmentation algorithm proposed in this study achieves an accuracy of 98.78%, sensitivity of 92.03%, and specificity of 96.58%. The research in this paper can assist doctors in clinical decision-making by first detecting potential elderly LVH patients through ECG data and then using MRI image segmentation algorithms to assist in the precise diagnosis of stroke lesions, thus avoiding the false positive results that might arise from over-reliance on ECG classification algorithms and solving the problem of inaccurate stroke lesion identification.
elderly stroke, left ventricular hypertrophy (LVH), electrocardiogram (ECG), stroke MRI, image segmentation, deep learning
As of January 17, 2024, data released by the National Bureau of Statistics of China show that by the end of 2023, the population aged 60 and above in China reached 296.97 million, with about 220 million elderly individuals suffering from one or more chronic diseases. The incidence of stroke increases significantly with age, with the incidence rate of the population aged over 75 being 5-8 times higher than that of the population aged 45-55. According to related surveys, stroke may become the second leading cause of death worldwide, and is also the third leading cause of death and disability among elderly patients [1]. As the global society ages, how to effectively address the health issues of the elderly with limited resources has become a global focus. Medical research shows that elderly stroke has an acute onset and rapid progression, and early identification is crucial for prognosis [2]. If high-risk groups for stroke can be identified through routine examination methods, it would help in the diagnosis, treatment, and prevention of elderly strokes. There are many causes of stroke in the elderly. In addition to genetic factors, it may also be caused by hypertension, hyperlipidemia, diabetes, atherosclerosis, etc. Professional medical research has proven that LVH on an ECG is not only an independent risk factor for stroke in patients but also an independent predictor of poor prognosis in stroke patients [3-5]. ECG examination is widely used due to its advantages over other examination methods, such as portability, ease of operation, and low cost, and can be used for the early screening of LVH. However, physicians face a heavy workload when identifying pathological features of elderly patients who are potential stroke candidates through ECG screening, which can lead to "misdiagnosis" and "missed diagnosis." Therefore, there is a need to develop an automated diagnostic program for identifying LVH symptoms from ECGs.
The advancements in artificial intelligence, digital health technologies, and mobile devices provide a treatment method for preventing and treating elderly stroke, enabling the exchange of information and resource sharing between elderly patients, medical teams, medical institutions, and medical devices in areas such as signal processing, image segmentation, and data analysis. Deep learning in artificial intelligence has a "quantifiable index" interpretation effect for ECG screening diagnostic data. Acharaya et al. [6] developed a 9-layer deep CNN to automatically identify five different types of heartbeats in ECG signals. Oh et al. [7] proposed an automated system based on the combination of CNN and long short-term memory (LSTM) for diagnosing arrhythmias from ECG signals. Hopkins et al. [8] indicated that LVH prediction based on neural networks outperforms traditional ECG diagnostic standards. These studies have proven the feasibility of deep learning-based analysis of LVH ECG data for early screening of elderly strokes. Of course, any disease screening method will have false positives. Further stroke diagnostic methods include computed tomography (CT) and magnetic resonance imaging (MRI), but CT is a risky examination due to the use of contrast agents and radiation damage. In contrast, advanced MRI technology has the most important advantages over CT, such as no radiation exposure, broader tissue coverage, and better identification of potentially infarcted and severely ischemic tissues. Based on lesion size, location, and vascular condition, MRI provides important information about prognosis. The annotation and recognition of MRI images also depend on the doctor's experience and consume a lot of the doctor's energy. Therefore, many scholars have conducted research on automatic segmentation algorithms for stroke lesion areas in MRI images. For example, Chen et al. [9] designed an automated system to diagnose acute ischemic stroke. Kamnitsas et al. [10] proposed a 3D CNN for 3D brain injury segmentation. Experiments have shown that deep learning neural networks, by simplifying the processing operations of original adjacent image blocks into internal network operations, have effectively completed the task of brain lesion segmentation. Based on the above research, this paper aims to optimize the algorithm and provide a method for the prevention and screening of elderly stroke diseases based on deep learning, ECG, and digital MRI imaging technology. The method first detects potential elderly LVH patients through ECG data, and then uses an intelligent MRI image diagnostic algorithm to assist in the accurate diagnosis of stroke lesions, avoiding the false positive phenomenon caused by over-reliance on ECG classification algorithms and solving the problem of inaccurate stroke lesion identification, thus assisting doctors in clinical decision-making.
2.1 Diagnosis of LVH on ECG
LVH on an ECG typically shows abnormal findings such as elevated QRS complex voltage, mild prolongation of the QRS interval, leftward deviation of the electrical axis, and ST-T changes [11]. The specific abnormal signals are presented in Table 1.
Table 1. Abnormal ECG findings in LVH
|
ECG Abnormality Type |
Specific Signal Presentation |
Clinical Significance |
|
Elevated QRS complex voltage |
Chest leads: Rv5 or Rv6 > 2.5 mV, Rv5 + Sv1 > 4.0 mV (male) or > 3.5 mV (female); Limb leads: RI ≥ 1.5 mV, RavL > 1.2 mV, RavF > 2.0 mV, RI + SIII ≥ 2.5 mV. |
Potential myocardial disease: ventricular hypertrophy; Left and right bundle branch block; Premature ventricular pulsation Inspection suggestion: echocardiography (ECHO); cardiac magnetic resonance imaging (CMR) |
|
Mild prolongation of the QRS interval |
The duration is extended to 0.10-0.11 seconds, but generally less than 0.12 seconds. |
Potential myocardial diseases: premature ventricular contractions, ventricular hypertrophy, bundle branch conduction block Inspection suggestion: echocardiography (ECHO); cardiac magnetic resonance imaging (CMR) |
|
Leftward deviation of the QRS axis |
Generally does not exceed a 30-degree deviation. |
Potential myocardial diseases: hypertensive heart disease, valvular disease Inspection suggestion: echocardiography (ECHO); cardiac magnetic resonance imaging (CMR) |
|
ST-T changes |
Mainly manifested by low, inverted, depressed, upright, or elevated ST-T segments in some leads. In leads dominated by the R wave, such as V5 and V6, the ST segment may show a downward sloping depression of > 0.05 mV, with flat or inverted T waves; in leads dominated by the S wave, such as V1, upright T waves may be observed. |
Potential myocardial diseases: hypertrophic cardiomyopathy (HCM), dilated cardiomyopathy (DCM), left ventricular densification (LVNC), induced arrhythmic right ventricular cardiomyopathy, myocarditis (ARVC) Inspection suggestion: ECHO, CMR, Sports testing 24-hour dynamic electrocardiogram |
2.2 ECG data collection
This study selects 12-lead ECG signals, which are closer to clinical practice, for the classification study of LVH. The 12-lead ECG provides more comprehensive spatial information, covering electrical activities from various directions of the heart, making it more advantageous for classifying and diagnosing LVH. We retrospectively collected data from elderly patients (aged > 60 years) who underwent resting ECG examinations in the outpatient and inpatient departments of our hospital between January 1, 2023, and December 31, 2023. The 12-lead ECG data were batch-exported from the server in nECG format. The results were evaluated by two experienced medical technicians, and if there were conflicting opinions, a third party was invited to make the final decision. The screening variables primarily focused on ECG parameters, including RaVL, SV3, RI, RaVF, SV1, and RV5 (or RV6) voltages, as well as the QRS wave duration. LVH was diagnosed based on the Sokolow-Lyon criteria: SV1 + RV5 (or RV6 amplitude) ≥ 4.0 mV in men, ≥ 3.5 mV in women, RV5 ≥ 2.5 mV, RI + SIII ≥ 2.5 mV [12]. According to this standard, the study population was divided into two groups: the LVH group and the control group. A total of 2,065 patients were included, with 413 diagnosed with LVH (LVH group) and 1,652 without LVH (control group). All participants in this study provided informed consent. The study data and materials were anonymized and kept confidential, intended solely for research purposes.
2.3 ECG data preprocessing
Preprocessing involves several processes [13], such as heart rate segmentation, resampling, denoising, and normalization, to ensure the quality and applicability of the data.
2.3.1 Denoising
ECG data are susceptible to various interferences during the collection process, mainly including the following: 1) Power line and harmonic interference, with a frequency of 50 Hz; 2) Electromyographic noise and high-frequency noise such as power supply ripple introduced by the sampling circuit, typically with a frequency above 100 Hz; 3) Respiratory baseline drift and DC components introduced by sampling, typically distributed in the frequency range of 0-0.7 Hz.
To eliminate the interferences present in the raw data, this paper designs processing algorithms to filter the raw ECG data:
(1) Second-order IIR notch filter to eliminate power line interference
The IIR filter [14] effectively filters periodic interference signals. The transfer function of the IIR notch filter is given by:
H(z)=1−2cosω0z−1+z−21−2acosω0z−1+a2z−2 (1)
where, z represents the complex variable, and a represents the location of the pole, ω0 represents the notch point, the calculation method is:
ω0=2pf0/fs (2)
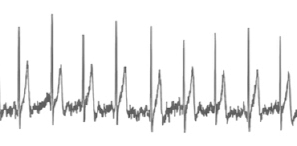
where, f0 is the signal frequency and fs are the sampling frequency. The notch filter is a band-stop filter, which takes advantage of its narrow stopband characteristics to quickly attenuate the input signal at a specified frequency point. For example, if the ECG waveform is severely interfered with at 60 Hz, it can be filtered by a 50 Hz notch filter to obtain a clearer waveform, as shown in Figure 1.
(a) ECG signal with power line interference
(b) Filtered signal after processing
Figure 1. Power line interference removal using a notch filter
(2) Mittag-Leffler filter to remove electromyographic interference
The Mittag-Leffler filter is a nonlinear filter [15] commonly used for signals with long memory characteristics. It performs excellently when dealing with non-gaussian noise and non-stationary signals. The Mittag-Leffler function is a part of fractional calculus theory and is defined in its single-parameter form as:
Eα(z)=∞∑n=0znΓ(αn+1)α>0 (3)
where, Γ is the gamma function and 0<α<1. The double-parameter form is described by the generalized Mittag-Leffler function with parameters α and β, expressed as the following power series:
Eα,β(z)=∞∑n=0znΓ(αn+β) (4)
The Mittag-Leffler filter is applied using the MATLAB function "ML_filter (t, y, sigma, alpha, beta)", which applies the Mittag-Leffler filter with exponential forgetting to a time series. The comparative effect of filtering out electromyographic interference is shown in Figure 2.
(a) Electromyographic interference in ECG signal
(b) Filtered signal after processing
Figure 2. Electromyographic interference removal using the Mittag-Leffler filter
(3) Wavelet denoising to eliminate baseline drift interference
Wavelet transform [16] inherits and develops the localized idea of the short-time Fourier transform while overcoming the drawback of fixed window size not changing with frequency. It provides a "time-frequency" window that changes with frequency and is an ideal tool for time-frequency analysis and processing of ECG signals. The main feature of wavelet transform is that it can fully highlight certain aspects of the problem’s characteristics through transformation, performing localized analysis of time (or space) frequency. By using scaling and translation operations, the signal (or function) can be gradually refined in multiple scales, achieving fine time subdivision at high frequencies and frequency subdivision at low frequencies. The wavelet transform formula used in this article is as follows (5). The Morlet wavelet is selected as the wavelet basis function, which has better localized characteristics in the frequency domain and is suitable for processing electrocardiogram vibration signals.
WT(a,τ)=1√a∫∞−∞f(t)∗ψ(t−τa)dt (5)
where, a(scale) controls the scaling of the wavelet function, and τ(transition) controls the translation of the wavelet function. The comparison effect of filtering baseline drift interference is shown in Figure 3.
(a) Baseline drift in ECG signal
(b) Filtered signal after processing
Figure 3. Wavelet denoising to remove baseline drift interference
2.3.2 Resampling
ECG signals in the dataset may have different sampling frequencies, leading to inconsistent lengths when inputting them. Therefore, resampling is necessary during preprocessing to ensure that all data have the same sampling frequency, making it easier to input data consistently for further analysis.
2.3.3 Heartbeat segmentation
In some datasets, a single ECG signal may be several minutes long, which cannot be directly input into the algorithm due to its large size. Therefore, after locating the R-wave, heartbeat segmentation is used to cut a long ECG segment into several shorter heartbeats. The dataset usually provides the location of the R-wave. After identifying the R-wave, heartbeat segmentation divides the signal between adjacent R-waves into individual heartbeat cycles, providing clear signal segments for subsequent analysis. If the dataset does not provide R-wave locations, localization methods must be applied to locate the R-wave before proceeding with further operations.
2.3.4 Normalization
Normalization is generally performed after heartbeat segmentation and denoising. It involves scaling the data to a small specific range to eliminate amplitude differences in the signal, which helps improve the stability and comparability of the algorithm. Various methods of normalization include z-score normalization, min-max normalization, and standardization.
2.4 Pre-trained ECG intelligent diagnosis model construction
Deep learning technology, through algorithms like deep neural networks, can learn feature representations from large-scale and complex ECG signals and gradually improve its ability to recognize abnormal ECGs through continuous adjustment and optimization. To fully utilize the multi-angle feature information of the twelve-lead ECG, this paper constructs a model based on CNN and Transformer networks, which extracts ECG features from both local waveform characteristics and global long-range dependency features, and integrates these features to detect the abnormal manifestations of LVH in ECG signals. This improves the recall rate for leads with specific LVH arrhythmia patterns. Meanwhile, the self-attention mechanism of the Transformer [17] can capture long-distance dependencies in the ECG signal, providing global contextual information for the model. The architecture of the ECG intelligent diagnosis model and the ECG signal classification process are shown in Figure 4.
The entire network structure in the figure above consists of three main parts: the lead-aware hierarchical Transformer module for extracting long-range dependencies and lead features across heartbeats, the attention convolution module for extracting local waveform features, and the feature fusion classification module for combining the outputs of these two modules from different views and outputting classification results. The classification process is as follows: the module inputs a multi-lead ECG signal, where m represents the number of leads and n represents the signal length. First, the signal is passed through the lead-aware hierarchical Transformer module to obtain the Transformer output, where C represents the patch embedding feature dimension. The ECG signal is then sent through the convolution attention module to obtain the convolution output. The lead-aware hierarchical Transformer module uses a self-attention mechanism to capture long-range dependency features across multiple heartbeats. Additionally, the lead-aware mechanism utilizes a window-based method to calculate self-attention scores from two views: the time dimension and the lead dimension, thereby focusing on the specific differences in the ECG signals from different leads. The original electrocardiogram signal X ∈ Rm×n is first segmented into m×n4 non overlapping patches by the EGG Patch embedding layer, and each patch is converted into a vector of length Cy(0)∈RC. Next, there is a hierarchical structure of 5 stages, with the first four stages consisting of several window based Transformer blocks and a patch merging layer, and the fifth stage consisting only of window based Transformer blocks. Among them, the window based Transformer blocks for the first two stages are time lead Transformer blocks, while the other stages are time Transformer blocks. The convolution attention module leverages the inductive bias of the local ECG signal waveform's time invariance, using convolutional blocks to extract local waveform features. The spatial and channel attention module (CBAM) [18] can focus on signal regions that are significant for distinguishing heart rhythms. Then, generalized mean (GeM) pooling [19] is applied to reduce the dimensionality of both the Transformer and convolution outputs. Finally, the lead-aware hierarchical Transformer output, after generalized mean pooling, and the attention convolution module output, after generalized mean pooling, are concatenated and passed through a fully connected layer. After activation by the Sigmoid function, the classification prediction results are obtained.
Figure 4. ECG signal classification process
2.5 Comparison of pre-training results of different models
In this section, we compare the performance of the model in Section 2.4 with other neural network models, and perform experimental validation using the PTB-XL public database ECG data. PTB-XL is currently the largest public ECG dataset [20], containing rich 12-lead ECG records, aimed at solving the problems of small-scale open datasets and the lack of benchmark tasks. The dataset contains 21,837 clinical 12-lead ECG records, all signals collected through 12 standard leads (I, II, III, AVL, AVR, AVF, V1, …, V6) connected to the subject's right arm and a reference electrode. According to the original labels, the 21,837 ECG records in the dataset are classified as normal (non-LVH) or abnormal ECGs (LVH, including QRS wave voltage elevation, slight prolongation of the QRS interval, left axis deviation, ST-T changes, etc.), and the dataset is divided into training, validation, and test sets in a 6:1:3 ratio. The experiments use the divided training, validation, and test sets to evaluate the performance of the ECG intelligent diagnostic model in this paper, comparing the performance of this model with that of Support Vector Machine (SVM) and CNN. The model in this article uses Adam optimization algorithm to derive network parameters, and the hyperparameter setting selects a network learning rate of 0.001, batch size of 128, epochs of 200. The model performance evaluation metrics include sensitivity, specificity, F1 score, accuracy, and AUC (Area Under the Curve, namely the ROC curve area), and the specific experimental results are shown in Figure 5.
Figure 5. Comparison of pre-trained results of three different models
2.6 Transfer learning model classification result evaluation
To solve the problem of limited sample size in self built datasets and help optimize the generalization performance of the model, we have done the following work: firstly, the dataset is divided into training set, validation set, and test set, and randomly divided into 60% training set, 10% validation set, and 30% test set. The model is trained on the training set, the model parameters are adjusted on the validation set, and finally the model's real-world performance is evaluated on the test set. Then compare the performance of the PTB-XL dataset and the self built dataset to determine whether the model is underfitting or overfitting. Compared with the benchmark model, draw the accuracy of the training set and validation set for different training set sizes, and determine overfitting or underfitting through the learning curve. If overfitting is found, adjust the regularization parameters, feature set, or polynomial features. Simultaneously transfer learning methods [21] are used to construct the LVH ECG intelligent diagnosis model. By transferring the learned model parameters through weight transfer, a new model is trained, accelerating and optimizing the learning efficiency of the LVH ECG intelligent diagnosis model based on the self-built dataset. First, the self-built dataset is randomly divided into 60% training set, 10% validation set, and 30% test set. Based on the pre-trained model, the classification layer is adjusted to recognize LVH and non-LVH ECGs. The transferred LVH ECG intelligent diagnosis model is then trained on the self-built dataset, and compared with the accurate results marked by doctors. The model's sensitivity, specificity, accuracy, and F1 score on the test set were found to be 0.81, 0.92, 0.87, and 0.91, respectively, with an AUC of 0.91. The specific evaluation metrics and model performance are shown in Figure 6.
Figure 6. Transfer learning model classification results on the dataset
3.1 MRI image segmentation model based on improved UNet network and attention mechanism
The common locations for strokes in elderly patients include the internal capsule, basal ganglia, and thalamus, typically manifesting as ischemic or hemorrhagic strokes. Stroke lesions can be detected through MRI images of the brain by professional doctors; however, this process is both time-consuming and requires significant expertise. Studies have shown that deep learning technologies perform excellently in medical image segmentation. However, due to privacy concerns, the complexity of annotation processes, the skill requirements for experts, and the high cost of using biomedical imaging systems, collecting a large dataset of elderly stroke MRI images is challenging. Small datasets can lead to overfitting during deep learning model training, thereby affecting model performance.
The UNet network structure [22] is particularly effective for medical image segmentation due to its U-shaped architecture, which densely fuses shallow and deep features. Additionally, the model's size is well-suited to match medical image data volumes, effectively avoiding overfitting. As a result, UNet and its extended methods have become popular in medical image segmentation in recent years. Many scholars have proposed more efficient improvements on the UNet framework, such as UNet++ [23], Attention-UNet [24], ResU-Net++ [25], and Transformer-based U-shaped models for medical image segmentation, like TransUNet [26], Swin-UNet [27], and UneXt [28]. Although these methods have achieved good results in the field of medical image segmentation, the existing networks tend to have numerous parameters and high computational complexity. To address this, this paper proposes an improved UNet model. It adds a layer normalization operation to the Tok-MLP module in the UneXt network to prevent overfitting while further learning local features. Additionally, part of the single-layer convolution is replaced with dilated convolution, utilizing separable dilated convolution blocks (SDC blocks) to acquire a larger receptive field and multi-scale contextual information without increasing computational complexity. Furthermore, a gated attention module is added during upsampling to suppress irrelevant skip connections, helping the network learn edge information and alleviating difficulties in segmenting regions with low contrast. The overall architecture of the model is shown in Figure 7. The model is a symmetric U-shaped network composed mainly of SDC blocks, E-Ghost blocks, Tok-MLP blocks, and gated attention modules. In the encoder, the SDC blocks replace traditional convolutions with dilated convolutions to obtain a larger receptive field, thus learning more features and achieving higher segmentation accuracy. In the Tok-MLP module, multilayer perceptrons (MLPs) move across the feature height and width to gain more positional information. In the decoder, upsampling is performed to reconstruct medical images. The two MLP blocks in Tok MLP undergo axial movement in the width and height directions, respectively, and learn features through depthwise separable convolution. This module uses skip connections to make MLP pay more attention to areas with higher correlation and suppress areas with lower correlation. In addition, a layer normalization operation is added after the module to prevent overfitting. Additionally, attention modules are introduced in the skip connections to combine shallow features from the encoder with deep features reconstructed by the decoder, compensating for lost local features.
Figure 7. Stroke MRI image segmentation model for elderly patients
3.2 Model evaluation
3.2.1 MRI image acquisition
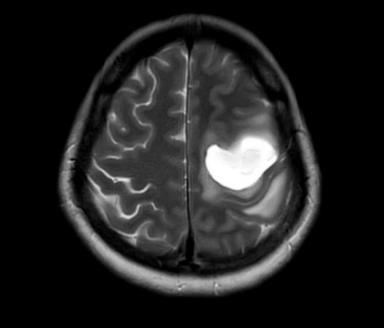
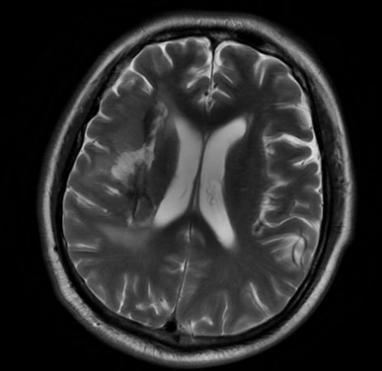
To evaluate the segmentation and experimental results of the model, the research team collaborated with hospitals to collect the MRI image dataset of elderly stroke patients. The acquisition and preprocessing processes were as follows:
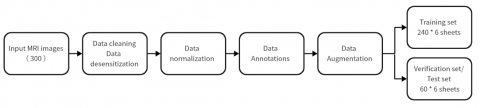
(1) Clean the stroke patients' MRI images provided by the hospital, label the lesion areas, and select the required MRI image data to build a custom dataset.
(2) All patient data underwent de-identification to protect patient privacy. Under the guidance of doctors, images with unclear boundaries, scattered lesion locations, and low contrast were excluded. After cleaning, 300 MRI images were selected as eligible stroke images, with 240 images used for training and 60 for testing.
(3) MRI medical images were augmented while retaining original information, and the input images were resized to 512×512.
(4) Expert neurologists manually annotated the lesion areas in the stroke MRI images, marking the lesion boundaries in red.
(5) Considering that the data volume was insufficient for network training, data augmentation was performed by increasing the training dataset size sixfold. Augmentation techniques included rotations by 0°, 90°, 180°, and 270° and horizontal and vertical flipping. The dataset construction and preprocessing process is shown in Figure 8.
3.2.2 Experimental results
(1) Evaluation Metrics
To evaluate the lightweight and segmentation performance of the network model proposed in this paper, five metrics are selected for comparison with other algorithms: accuracy, sensitivity, specificity, Dice coefficient, and Intersection over Union (IoU). We first use TP, FN, FP, TN to represent the true positive, false negative, false positive, and true negative of a case. Accuracy is commonly used to represent the accuracy of the model, and the calculation formula is as follows:
Accuracy=TP+TNTP+FN+FP+TN (6)
Sensitivity refers to the proportion of a detection that correctly identifies true positives. When the conditions do exist, the ability of the test to accurately indicate the situation. In disease screening, high sensitivity means that there are few missed patients. The calculation formula is shown as follows:
Sensitivity=TPTP+FN (7)
Specificity calculation refers to the proportion of negative class samples that the model incorrectly identifies as positive to all negative class samples, and generally the lower the better. The calculation formula is shown as follows:
Specificity=FPTN+FP (8)
The Dice coefficient is a function used to calculate the similarity between two sets and is widely applied in the field of medical image segmentation. It is typically used to compute the similarity between two samples, with a value range of [0, 1]. Its calculation formula is:
Dice=2×TP2×TP+FP+FN (9)
IoU is a detection measure used to assess the foreground's intersection-over-union ratio in segmentation tasks. This measure reflects the overlap between the detected regions and actual labels. IoU is calculated using a confusion matrix, which consists of four parts: true positives (TP), true negatives (TN), false positives (FP), and false negatives (FN). The calculation formula is shown as follows:
IoU=TPTP+FP+FN (10)
(2) Experimental Results Analysis
Using U-Net as the baseline network, experiments were conducted on the MRI image dataset collected in this study and compared with advanced lightweight models such as Dense-UNet and Attention-UNet in the image segmentation domain. The lesion segmentation and network model comparison results are shown in Table 2 and Table 3. To evaluate the effectiveness and superiority of the algorithm, all networks in the comparative experiments were set with the same conditions.
Table 2. Lesion segmentation results
|
MRI Image |
Doctor Annotation |
Model Segmentation |
Table 3. Network model comparison experimental results
|
Model |
Accuracy |
Sensitivity |
Specificity |
DICE |
IoU |
|
U-Net |
90.25% |
80.45% |
90.35% |
86.41% |
82.13% |
|
Dense UNet |
93.35% |
83.65% |
92.65% |
88.65% |
85.42% |
|
Attention UNet |
94.68% |
85.54% |
94.68% |
88.45% |
85.12% |
|
OURS |
98.78% |
92.03% |
96.58% |
90.12% |
88.46% |
This study leverages the non-invasive and rapid advantages of ECG technology, with LVH being an independent risk factor for stroke in elderly patients. An intelligent diagnosis model for elderly stroke is proposed to provide a new approach for stroke diagnosis. The model first extracts ECG features from local waveform characteristics and global long-range dependency features using CNN and Transformer networks, respectively, and integrates the abnormal features of LVH ECG signals to improve the recall rate for lead-specific LVH arrhythmia types. The transformer’s self-attention mechanism captures long-range dependencies in ECG signals, providing global contextual information to optimize the model’s performance. Experimental results show that the model's sensitivity, specificity, accuracy, and F1 score on the self-constructed dataset are 0.81, 0.92, 0.87, and 0.91, respectively, with an AUC of 0.91. These results demonstrate that LVH ECG can be used as a detection method for stroke classification tasks. To help neurologists obtain a more comprehensive view of stroke in patients through MRI medical imaging, aiding effective communication with stroke patients, this paper proposes an MRI image segmentation model based on the improved UNet network and attention mechanism. Experimental results show that this model achieves improvements over U-Net, Dense UNet, and Attention UNet on various evaluation metrics (accuracy, sensitivity, Dice coefficient, and IoU).
However, despite achieving the goals set for this study, there is still room for improvement in terms of data and model performance. High-quality data and optimized networks are crucial not only for designing automated stroke diagnosis systems based on ECG but also for stroke segmentation tasks in elderly patients. In the custom-built dataset, the focus was mainly on classifying LVH patients from normal ones, neglecting other factors that may influence the classification results, such as other ECG abnormalities in LVH patients or chronic diseases in elderly patients (e.g., hypertension and diabetes). Regarding stroke MRI images, artifacts and the random nature of lesion sizes may affect algorithm accuracy and interfere with the network training process, indicating that further improvements in model accuracy are still necessary. In addition, due to medical ethics and privacy protection reasons, we are unable to obtain more types of cases, and the limitations of small sample data in the model make it difficult to accurately reflect the feature distribution of the entire dataset, resulting in fluctuations in training accuracy. At the same time, the randomness of lesion areas caused by various chronic disease factors in elderly patients has a certain impact on the accuracy of the algorithm. In the future, model optimization should be considered from three aspects: increasing the amount of training data, trying different optimization algorithms, and using ensemble learning to combine the prediction results of multiple models to improve the accuracy and generalization ability of the model.
This article is the research result of the project funded by the Department of Education of Zhejiang Province (Grant No.: Y202249957).
[1] Feigin, V.L., Stark, B.A., Johnson, C.O., Roth, G.A., Bisignano, C., Abady, G.G., Hamidi, S. (2021). Global, regional, and national burden of stroke and its risk factors, 1990-2019: A systematic analysis for the global burden of disease study 2019. The Lancet Neurology, 20(10): 795-820. https://doi.org/10.1016/S1474-4422(21)00252-0
[2] Liu, M., Zhao, J., Li, S., Han, J., Ma, G., Wang, Y., Chang, H. (2023). Early monitoring of intravenous thrombolysis in acute ischaemic stroke using wearable intelligent vital sign devices: Protocol for a prospective, multicentre, observational registry cohort study. BMJ Open, 13(11): e074855. https://doi.org/10.1136/bmjopen-2023-074855
[3] Ishikawa, J., Ishikawa, S., Kabutoya, T., Gotoh, T., Kayaba, K., Schwartz, J.E., Kario, K. (2009). Cornell product left ventricular hypertrophy in electrocardiogram and the risk of stroke in a general population. Hypertension, 53(1): 28-34. https://doi.org/10.1161/HYPERTENSIONAHA.108.118026
[4] Povoa, F.F., Luna Filho, B., Bianco, H.T., Amodeo, C., Povoa, R., Bombig, M.T.N., Fonseca, F.A. (2021). Performance of the electrocardiogram in the diagnosis of left ventricular hypertrophy in older and very older hypertensive patients. Arquivos Brasileiros de Cardiologia, 117(5): 924-931. https://doi.org/10.36660/ABC.20200600
[5] Revathi, J., Anitha, J. (2024). Hybrid LSTM models-based detection of left ventricular hypertrophy in electrocardiogram signals. Intelligent Decision Technologies, 18(3): 2621-2641. https://doi.org/10.3233/IDT-240649
[6] Acharya, U.R., Oh, S.L., Hagiwara, Y., Tan, J.H., Adam, M., Gertych, A., San Tan, R. (2017). A deep convolutional neural network model to classify heartbeats. Computers in Biology and Medicine, 89: 389-396. https://doi.org/10.1016/j.compbiomed.2017.08.022
[7] Oh, S.L., Ng, E.Y., San Tan, R., Acharya, U.R. (2018). Automated diagnosis of arrhythmia using combination of CNN and LSTM techniques with variable length heart beats. Computers in Biology and Medicine, 102: 278-287. https://doi.org/10.1016/j.compbiomed.2018.06.002
[8] Hopkins, C.B., Suleman, J., Cook, C. (2000). An artificial neural network for the electrocardiographic diagnosis of left ventricular hypertrophy. Critical Reviews™ in Biomedical Engineering, 28(3-4): 435- 438. https://doi.org/10.1615/CritRevBiomedEng.v28.i34.140
[9] Chen, L., Bentley, P., Rueckert, D. (2017). Fully automatic acute ischemic lesion segmentation in DWI using convolutional neural networks. NeuroImage: Clinical, 15: 633-643. https://doi.org/10.1016/j.nicl.2017.06.016
[10] Kamnitsas, K., Ledig, C., Newcombe, V.F., Simpson, J.P., Kane, A.D., Menon, D.K., Glocker, B. (2017). Efficient multi-scale 3D CNN with fully connected CRF for accurate brain lesion segmentation. Medical Image Analysis, 36: 61-78. https://doi.org/10.1016/j.media.2016.10.004
[11] Yang, P., Ge, Z., Gao, J., Liu, X., Xu, M., Ke, H. (2023). Evaluation of the electrocardiogram RV5/V6 criteria in the diagnosis of left ventricular hypertrophy in marathon runners. The Journal of Clinical Hypertension, 25(7): 638-646. https://doi.org/10.1111/JCH.14692
[12] Shimizu, M., Tsunoda, T., Sakai, E., Shimizu, A., Misu, Y., Ryo, T., Sasano, T. (2023). Diagnosis of left ventricular hypertrophy on 12-leads electrocardiogram by historical criterion and machine learning models. Circulation, 148(S1): A13690-A13690. https://doi.org/10.1161/CIRC.148.SUPPL_1.13690
[13] Lyakhov, P., Kiladze, M., Lyakhova, U. (2021). System for neural network determination of atrial fibrillation on ECG signals with wavelet-based preprocessing. Applied Sciences, 11(16): 7213. https://doi.org/10.3390/APP11167213
[14] Edussooriya, C.U., Chandima, T. (2022). A novel multi-dimensional zero-phase IIR notch filter with independently-tunable multiple notches. Multidimensional Systems and Signal Processing, 33(4): 1073-1086. https://doi.org/10.1007/S11045-022-00844-W
[15] Rawash, Y.Z., Al‐Naami, B., Alfraihat, A., Owida, H.A. (2024). Advanced low-pass filters for signal processing: A comparative study on gaussian, Mittag-Leffler, and Savitzky-Golay Filters. Mathematical Modelling of Engineering Problems, 11(7): 1841-1850. https://doi.org/10.18280/MMEP.110713
[16] Besfat, H.M., Gelmecha, D.J., Singh, R.S. (2024). Delineation of QRS features and denoising of ECG signal using Fejer Korovkin wavelet. International Journal of Information Technology, 16(5): 3027-3031. https://doi.org/10.1007/S41870-024-01804-2
[17] Akan, T., Alp, S., Bhuiyan, M.A.N. (2023). ECGformer: Leveraging transformer for ECG heartbeat arrhythmia classification. In 2023 International Conference on Computational Science and Computational Intelligence (CSCI), Las Vegas, NV, USA, pp. 1412-1417. https://doi.org/10.1109/CSCI62032.2023.00231
[18] Zakariah, M., Alnuaim, A. (2024). Recognizing human activities with the use of convolutional block attention module. Egyptian Informatics Journal, 27: 100536. https://doi.org/10.1016/J.EIJ.2024.100536
[19] Zhu, H., Hu, P., Tang, X., Xia, D., Huang, H. (2023). NAGNet: A novel framework for real‐time students' sentiment analysis in the wisdom classroom. Concurrency and Computation: Practice and Experience, 35(22): e7727. https://doi.org/10.1002/cpe.7727
[20] Wagner, P., Strodthoff, N., Bousseljot, R.D., Kreiseler, D., Lunze, F.I., Samek, W., Schaeffter, T. (2020). PTB-XL, a large publicly available electrocardiography dataset. Scientific Data, 7(1): 1-15. https://doi.org/10.1038/s41597-020-0495-6
[21] Parikshith, H., Rajath, S.N., Shwetha, D., Sindhu, C.M., Ravi, P. (2021). Handwritten character recognition of kannada language using convolutional neural networks and transfer learning. In IOP Conference Series: Materials Science and Engineering, 1110(1): 012003. https://doi.org/10.1088/1757-899X/1110/1/012003
[22] Huyan, R., Wu, Z, Xu, S, Cui, H., Cao, X., Ma, J., Gu, W. (2023). Intelligent segmentation of prostate zones in MR images based on Vgg16-UNet. Journal of Army Medical University, 45(13): 1441-1449. https://doi.org/10.16016/j.2097-0927.202211045
[23] Pan, L., Chen, K., Zheng, Z., Zhao, Y., Yang, P., Li, Z., Wu, S. (2022). Aging of Chinese bony orbit: Automatic calculation based on UNet++ and connected component analysis. Surgical and Radiologic Anatomy, 44: 749-758. https://doi.org/10.1007/s00276-022-02933-8
[24] Dawood, T.A., Hashim, A.T., Nasser, A.R. (2023). Advances in brain tumor segmentation and skull stripping: A 3D residual attention UNet approach. Traitement du Signal, 40(5): 1895-1908. https://doi.org/10.18280/ts.400510
[25] Park, J., Han, Y.H. (2022). Segmentation of skin cancer lesions using ResUNet++. Journal of the Institute of Electronics and Information Engineers, 59(2): 95-100. https://doi.org/10.5573/ieie.2022.59.2.95
[26] Lin, A., Chen, B., Xu, J., Zhang, Z., Lu, G., Zhang, D. (2022). Ds-TransUNet: Dual Swin transformer U-Net for medical image segmentation. IEEE Transactions on Instrumentation and Measurement, 71: 1-15. https://doi.org/10.1109/TIM.2022.3178991
[27] Çelebi, A., Imak, A., Üzen, H., Budak, Ü., Türkoğlu, M., Hanbay, D., Şengür, A. (2024). Maxillary sinus detection on cone beam computed tomography images using ResNet and Swin Transformer-based UNet. Oral Surgery, Oral Medicine, Oral Pathology and Oral Radiology, 138(1): 149-161. https://doi.org/10.1016/j.oooo.2023.06.001
[28] Valanarasu, J.M.J., Patel, V.M. (2022). UNeXt: MLP-based rapid medical image segmentation network. In International Conference on Medical Image Computing and Computer-Assisted Intervention, pp. 23-33. https://doi.org/10.48550/arXiv.2203.04967