Johnsymol Joy*![]() | Mercy Paul Selvan
| Mercy Paul Selvan![]()
© 2025 The authors. This article is published by IIETA and is licensed under the CC BY 4.0 license (http://creativecommons.org/licenses/by/4.0/).
OPEN ACCESS
Neurodegenerative disorders like Parkinson's and Alzheimer's represent a notable menace to the welfare of humanity. They primarily result from the progressive deterioration of the peripheral and central nervous systems, significantly affecting an individual's daily life. To diagnose these disorders, ongoing clinical assessments are necessary. Modern medical diagnosis often employs deep learning techniques. One challenge with the deep learning approach is handling diverse datasets of multiple modalities. Earlier research relied on just one modality, making it an inadequate diagnostic aid. In this work, we combined the benefits of various modalities to create a hybrid technology designed for practice in the timely identification of Parkinson's disease. This work employs an MRI image dataset and a DaT scan dataset connected to Parkinson's disease. This study develops four alternative models. The general framework of the several recommended techniques is as follows: first, we use picture augmentation by methods such as blurring and sharpening. Subsequently, we either engage in early image fusion, transferring the fused images for feature extraction and subsequent classification, or independently extract features from both modalities and later fuse these independently extracted features before conducting the classification process. Finally, we performed a comparative analysis between the state-of-the-art model chosen as the baseline and the several models that were put forth. Among these, Model 2 exhibited superior performance, achieving a test accuracy of 93.96%.
machine learning, deep learning, multi-modality, image fusion, Convolutional Neural Network (CNN), feature extraction, hybrid deep learning
Neurodegenerative disorders [1] encompass a group of illnesses that predominantly impact the neurons in the brain and spinal cord, progressively diminishing cognitive and physical functions over time. Notable examples of these disorders are Alzheimer's disease, PD (Parkinson's Disease), Huntington's disease, and Amyotrophic Lateral Sclerosis (ALS). They have the potential to reduce a person's quality of life significantly and, in several instances, result in death. Many neurodegenerative diseases have unclear origins, although complicated combinations of genetic, environmental, and lifestyle variables are frequently the reason. Although there isn't a solution for the majority of these illnesses, research is still being conducted to realize the underlying causes of these illnesses better and provide treatments that will at least lessen symptoms, reduce the progression of the disease, and enhance the lives of those affected. The management of neurodegenerative disorders requires early diagnosis and action. Different treatment modalities, such as medication, treatments, and supportive care, are available to address the unique symptoms associated with each disorder. With ongoing research, there is promise for future developments in preventing and treating neurodegenerative illnesses.
Research and treatment for neurodegenerative disorders seem to benefit significantly from applying deep learning, a subfield of machine learning [2]. We can use deep learning techniques to diagnose these disorders early, predict the future course of the patient's illness based on clinical and genetic information, identify features from biomarkers, etc. By utilizing deep learning models, cognitive evaluation tools that track alterations in cognitive performance over time can be created.
Alzheimer’s and Parkinson’s are the major disorders that come under this group and were drastically affecting entire humanity. Early detection is crucial in all these cases. Usually, people identify these types of disorders only after showing severe symptoms. A continuous, thorough clinical assessment is needed and time-consuming for diagnosing. We possess several biomarkers [3], such as MRI (Magnetic Resonance Imaging) [4], DaT (Dopamine Transporter), PET (Positron Emission Tomography), etc., which aid clinicians in detecting or identifying distinct phases of a condition or evaluating the likelihood of future occurrences. Fortunately, we can apply different deep-learning models to these biomarkers and quickly diagnose these disorders.
This paper mainly focuses on PD [5]. Both DaT and MRI are helpful research and diagnostic technologies that support the assessment of PD and its differential diagnosis. MRI is frequently utilized to evaluate the structural state of the brain in PD [6, 7]. It offers finely detailed images of the brain's anatomy, which can help rule out other disorders like tumors or vascular anomalies that may exhibit similar symptoms. An essential nuclear medicine imaging tool for PD, DaT imaging evaluates the brain's dopamine system integrity [8]. A radiotracer that binds to dopamine transporters in the brain is injected into the bloodstream during the procedure. Combined with clinical evaluation and other diagnostic instruments, these imaging modalities aid in a more precise diagnosis and understanding of the illness.
Most existing research focuses on using a single imaging modality, which is insufficient to capture the complex nature of these diseases; this paper addresses and tries to overcome this issue. The limitations of single-modality approaches have led to inaccuracies in diagnosis and disease progression tracking. Multimodal image fusion [9], combining MRI and DaT scans, can enhance diagnostic accuracy by leveraging the complementary information provided by different imaging techniques. Despite this assurance, there aren't enough reliable models to combine several modalities to solve problems like class imbalance and data scarcity in medical imaging.
The primary objective of this study is to develop a hybrid deep learning model that combines MRI and DaT scans for detecting neurodegenerative disorder-PD using early and late image fusion techniques [10]. This is a binary classification technique. It classifies whether a particular individual is PD-affected or not. The study aims to:
The study proposes four novel deep-learning models using hybrid image fusion techniques. These models overcome the limitations of single-modality reliance by utilizing both MRI and DaT scans. This study's main contributions include the development of robust multimodal fusion architectures and applying augmentation techniques, such as blurring, sharpening, and class weighting, to mitigate data scarcity and imbalance.
Early image fusion involves merging the two types of images based on their subjects. Subsequently, the Convolutional Neural Network (CNN) and the Deep Neural Network (DNN) take these fused pictures. Subsequently, characteristics are extracted from both models, blended, and transformed into a one-dimensional vector. The last stage involves transmitting the feature vector to a neural network for classification. In the late approach to image fusion, we input MRI and DaT scans separately into neural network models to identify distinctive characteristics. Next, we convert those characteristics into a single-dimensional vector and input them into a specific deep neural network for categorization.
In the rapidly evolving field of computer science, this literature review explores the recent advancements, methodologies, and emerging deep learning trends developed to handle the above-mentioned problem, which effectively classifies different neurodegenerative disorders.
Zhang et al. [11] developed DNN utilizing 102 two-view MRI datasets, which included AXI and SAG data. They achieved a 76.46% accuracy rate using a novel approach to screening individuals with PD. They pre-processed this data using picture augmentation algorithms constructed on Wasserstein Generative Adversarial Networks (WGANs). Moreover, the data was input into two ResNet networks at the same time, and the outputs of the hidden layer were combined into a vector before being sent to a SoftMax classification layer.
To enhance quality of life and treat the progressive degeneration of dopaminergic neurons associated with PD, early and rapid diagnosis is of paramount importance. A 3D CNN was used by Chakraborty et al. [12] in the Parkinson's Progression Markers Initiative database (PPMI), which included 3T T1-weighted MRI images, they used 203 scans of healthy individuals and 203 scans of PD patients. A 3D CNN architecture was trained to detect complex patterns after data pre-processing to diagnose PD from MRI scans. The results showed that the developed 3D CNN model outperformed the others in terms of overall accuracy (95.29%), average recall (0.943), average precision (0.927), average specificity (0.9430), f1-score (0.936), and Receiver Operating Characteristic—Area Under Curve (ROC-AUC) score (0.998) for both classes.
Modi et al. [13] suggested a CNN system based on VGG16 for diagnosing Parkinson's illness. Feature extraction is automatically applied to the collected PET scan pictures from the PPMI source. The recommended technique's success is tested in terms of specificity, accuracy, sensitivity, and precision; the resultant values are 97.5%, 84.6%, 71.6%, and 96.7%, respectively.
Creating accurate indices to differentiate between different PDs is essential, particularly in developing treatment regimens. In light of this, the Parkinsonism Differential Diagnosis Network (PDD-Net), a 3D deep CNN, was created by Yu et al. [14] to automatically detect imaging-related signals that might support the differential analysis of Parkinson's diseases. Two sets of PET scans showing PD were analyzed using this DL technique: Approximately 2,100 Chinese cases and 90 German patients both are part of the Huashan Parkinsonian PET Imaging (HPPI) database. The goal of developing a deep CNN in three dimensions was to provide metrics for deep metabolic imaging (DMI). After that, these markers were evaluated in two other groups: one that was independent and followed up with data from the HPPI database throughout time and another that included 90 Parkinson patients from a separate German cohort that used different imaging techniques. The differential diagnosis has less wiggle space when using the suggested DMI indices. In the blind test group, the sensitivities for diagnosing PD, Multiple System Atrophy, and Progressive Supranuclear Palsy were 98.1%, 88.5%, and 84.5%, respectively. The specificities for these diagnoses were 90.0%, 99.2%, and 97.8%, respectively. They produced sensitivities of 94.1%, 82.4%, and 82.1% and specificities of 84.0%, 99.9%, and 94.1% in the German group, respectively.
Long et al. [15] suggested a way to tell the difference between people who are normal controls (NCs) and people who have early-stage Parkinson's disease (PD) by using multi-level assessments and multi-modal images. Structured and resting-state functional magnetic resonance imaging (rsfMRI) data on people were gathered for research. Researchers used rsfMRI pictures to measure low-frequency waves' strength, uniformity, and intensity in different brain areas. It was possible to make the anatomical pictures by getting information about the volumes of the CSF, white matter, and gray matter. It used a two-sample t-test to pick the traits and then combined them to divide them into groups. Then, using support vector machine learning, a predictor was made to tell the difference between people with early-stage PD and healthy controls. This approach showed remarkable discriminative ability, with an accuracy of 86.96%.
While previous research has extensively employed single-modality techniques, such as CNNs applied to MRI images for Parkinson’s disease detection, these methods lack the comprehensive diagnostic capabilities that multimodal approaches provide. Our work improves upon these studies by introducing a hybrid fusion of MRI and DaT scans, addressing the gaps in feature extraction and disease progression modeling that single modalities fail to capture.
3.1 Outline of proposed work
For detecting neurodegenerative disorders, lots of biomarkers are currently available. Some are MRI scans, DaT Scans, PET images, etc. It is possible to use multiple modalities to identify this type of disorder. Combining these modalities enables a more thorough evaluation of the anatomy and function of the brain [16]. Here, we implement two categories of works that use early and late image fusion [17] techniques for handling different modalities, like MRI and DaT scans, to identify whether a particular person has Parkinson’s. The proposed categories are as-Hybrid multimodal early image fusion deep learning technique and Hybrid multimodal late image fusion technique. Under these categories, this work has proposed four different Deep Learning Models. The work includes the following phases: data pre-processing, feature extraction, final classification by considering data imbalance, and performance evaluation.
The general structure of the proposed work is that initially, we perform data pre-processing like image augmentation [18] by blurring and sharpening, then either perform early image fusion and transfer the fused images for feature extraction and classify the extracted features or extract the features from both modalities independently and fuse the extracted features (late fusion) and then perform classification.
3.1.1 Data pre-processing-image augmentation
Image augmentation [19] is an extensively used technique in deep learning. Its purpose is to artificially increase the size of a training dataset by applying a variety of modifications to the data that was initially collected. The core objective in employing data augmentation is to bolster the model's capacity for generalization and enhance its overall performance, which proved particularly advantageous when training data is scarce. Different data image augmentation techniques include rotation, flipping, translation, blurring, sharpening, etc. We can also use Python-based image generator augmentation functions to generate new data. This work blurs and sharpens the original images. 3×3 and 5×5 dimensional convolution masks with intensities less than 50 were used to improve the sharpness of images. Additionally, the study investigates several methods of adding image blur. These techniques include stack blur with varied radii, radial blur with different diameters, motion blur with various degrees, and Gaussian blur with varying kernel sizes. This paper uses online tools and Python code to perform these operations.
3.1.2 Feature extractor
In deep learning, feature extraction automatically identifies and obtains pertinent features from unprocessed data to enhance a neural network's performance. Neural network layers, such as convolutional layers in CNNs or several kinds of hidden layers in deep-feed forward neural networks, are commonly used in deep learning to do this. Feature extraction is a crucial stage in deep learning to reduce computing demands, increase model performance and generalization, and allow the neural network to concentrate on the most significant parts of the data. The type of data being used and the task at hand will determine which feature extraction method is best. This paper uses a CNN and a traditional DNN as a feature extractor.
CNNs automatically pick up hierarchical characteristics at various abstraction levels. Convolutional layers are often layered to identify progressively more complex information. The feature maps produced from convolutional layers are down-sampled by pooling layers. Standard methods include max pooling and average pooling, lower spatial dimensions while keeping crucial information. On feature maps, non-linear activation functions—like ReLU (Rectified Linear Unit)— add non-linearity to the model. This makes it easier to discover complicated data links, improving the model's capacity to recognize relevant patterns. CNNs commonly conclude with one or more fully connected layers to facilitate prediction-making after extracting features through convolution and pooling. These layers establish connections between all the extracted features and the output layer, enabling the network to acquire intricate combinations of features essential for classification or regression tasks.
3.1.3 Final classifier
This paper uses customized Deep Neural Networks and LSTM (Long Short-Term Memory) as the final classifier module. A DNN can be a robust task classifier. In this study, a Customized Deep Neural Network was constructed, featuring ten dense layers with varied node counts. Given that our task involves binary classification, the final layer utilizes a sigmoid function as the activation. The chosen loss function is binary cross-entropy. The second approach used is the LSTM network. Classification LSTM architectures typically consist of input, LSTM layer (or layers), and output. The input layer's structure should correspond to the input sequences, and the output layer's unit count should match that of the classes. A dense model could also have a dropout or more layers to increase speed. This work uses LSTM as a classifier at the final stage. Our basic LSTM consists of two initial LSTM layers followed by a sequence of dense layers.
This study implemented class weighting to address data imbalance between Parkinson’s and non-Parkinson’s cases. The class weights were calculated based on the inverse of the class frequencies, assigning a higher weight to the minority class (Parkinson’s images) and a lower weight to the majority class (healthy photos). During training, this ensured that errors made on minority class samples contributed more to the loss function, forcing the model to focus on correctly classifying the underrepresented class and mitigating bias toward the majority class.
3.2 Proposed models
The proposed work introduces four innovative deep-learning models that leverage hybrid image fusion techniques [20]. These models combine MRI and DaT scans [21] to address the limitations of single-modality approaches either early or late. The following part will discuss those models in detail.
3.2.1 Hybrid multimodal late image fusion deep learning technique
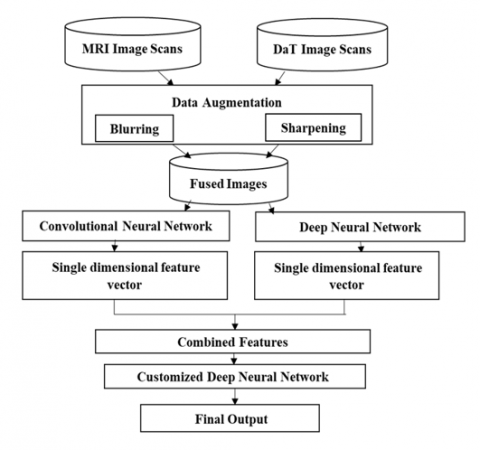
When using late fusion, individual neural networks are used to process the MRI and DaT pictures independently. The outputs of these networks are then combined at a later stage of the network. Concatenating the features on an element-by-element basis can accomplish this. With this method, the network can pick out distinguishing characteristics from each modality and combine them to make the ultimate choice. Under this heading, we created models—Model 1 (Hybrid Multi-modal late image fusion technique with customized DNN as a final classifier) and Model 2 (Hybrid Multi-modal late image fusion technique with LSTM as a final classifier). Model 1 uses a modified DNN as the final classifier in a hybrid multi-modal late image fusion approach. The suggested Model 1's basic structure is shown in Figure 1—Model 1 scans pictures from DaT and MRI scans. To solve the data imbalance problems like overfitting, it first blurs and sharpens all the images and then, for feature extraction, passes the original and augmented MRI scans to a CNN and DaT scans to a DNN model and finally fuse the extracted image and passes the fused single dimensional vector to a customized DNN for final classification.
Figure 1. Model 1 architecture
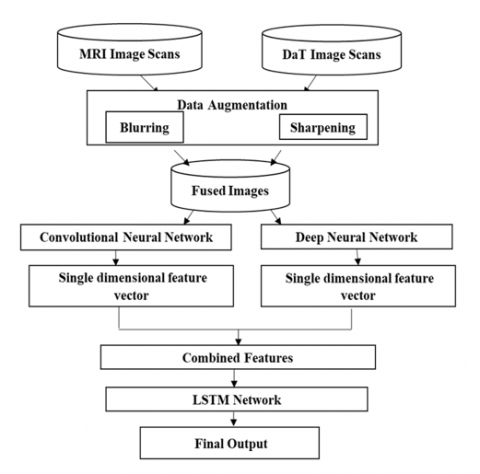
Model 2 is a Hybrid Multi-modal late image fusion technique with LSTM as a final classifier. The suggested Model 2's fundamental structure is seen in Figure 2. Model 2 takes MRI and DaT scan images, then blurs and sharpens all the images for feature extraction. It passes the original and augmented MRI scans to a CNN. DaT scans to a DNN model, and finally, it fuses the extracted images and passes the fused single-dimensional vector to the LSTM network for final classification.
Figure 2. Model 2 architecture
3.2.2 Hybrid multimodal early image fusion deep learning technique
Early fusion combines the MRI and DaT pictures at the network's start instead of late fusion. Under this category, we developed models -Model 3(Hybrid Multi-modal early image fusion technique with DNN as a final classifier) and Model 4(Hybrid Multi-modal early image fusion technique with LSTM as a final classifier). Model 3 is a Hybrid Multi-modal early image fusion technique with customized DNN as the final classifier. Model 4 is a Hybrid Multi-modal early image fusion technique with LSTM as the final classifier. Model 3, shown in Figure 3, and Model 4, shown in Figure 4, suggest models with similar fundamental architectures.
Figure 3. Model 3 architecture
The subject-wise fusing of the MRI and DaT images is performed in both cases after augmentation. Then, we will use a hybrid learning approach to analyze these data. For that, the fused dataset is passed to two different deep-learning models. One is a CNN, and the second deep learning technique used for feature extraction is a DNN. Finally, we combine features extracted from these two neural networks into a single-dimensional vector. Model 3 passes those features to a customized DNN for final classification, while Model 4 passes those features to an LSTM network. This method can assist the network in learning joint characteristics from the beginning from both modalities.
Figure 4. Model 4 architecture
3.2.3 Datasets and system used
In this proposed work, we used NTUA (National Technical University of Athens) Parkinson’s disease classification image datasets [22] of multiple modalities –one MRI and one DaT image scan dataset. So far, this dataset includes DaT scans and MRI exams from 78 participants, of which 23 are healthy control subjects, and 55 have Parkinson's disease. This binary classification dataset classifies an individual as PD or Non-PD. Together, over 42000 images are available. The problem is that we have limited DaT scan images of only 920. So, we first created a customized dataset, which means we grouped MRI and DaT scans subject-wise. Finally, a dataset consisting of 920 MRI and 920 DaT scans were made. The problem with this dataset is that it is not balanced. To address this issue, we perform some data augmentation techniques. Our models run on a system with the following specifications: Windows 10 operating system, NVIDIA Quadro GV100 graphics card, 512GB SSD hard disc for operating system, 64GB RAM and 6TB SATA hard disc for data storage. Intel Xeon Gold 6134 CPU, 24.75M Cache, 3.20 GHz, 3.19 GHz (2 processors). The NVIDIA® Quadro® GV100 has redesigned the workstation to fulfill the needs of AI-enhanced design and visualization operations. The Keras library, built on TensorFlow as a backend, was used to implement the suggested models.
3.2.4 Performance metrics
To assess the effectiveness of the previously mentioned deep learning models, various performance metrics [23] were taken into account. Accuracy, precision, recall, and the F1-score are the metrics used to evaluate these characteristics. In a deep learning project, the objectives and characteristics will dictate the metrics employed. Accuracy measures overall correctness but may not be sufficient for imbalanced datasets, as it can be misleading when one class dominates. Precision: It is essential when the cost of false positives is high, such as misdiagnosing healthy individuals. Recall (Sensitivity), Key in medical diagnoses, missing an optimistic case (false negatives) is costly, as it helps ensure that actual cases are detected. F1-Score combines precision and recall into a balanced metric, which is useful when the dataset is imbalanced. ROC-AUC: Measures the model's ability to distinguish between classes across all thresholds, providing insight into the model's performance regardless of class imbalance.
So, it's best to combine these indicators to get a complete picture of the model's efficiency. One of the most basic and often used metrics is accuracy, which is the percentage of instances properly categorized relative to the total instances. However, its suitability might be limited in the case of imbalanced datasets.
Accuracy value =(TP+TN)/(TP+TN+FP+FN) (1)
The precision metric is the ratio of true positives to the total of both true and false positives. This statistic becomes useful when the price of false positives is high.
Precision = TP / (TP + FP) (2)
To get the recall, also called sensitivity, take the total number of positive and negative results and divide it by the number of genuine positives. This metric holds significance when the cost of false negatives is substantial.
Recall = TP / (TP + FN) (3)
When recall and accuracy are harmonically averaged, the result is the F1 Score. Serving as a balance between precision and recall, it proves especially beneficial when class distribution is imbalanced.
F1-Score = 2 * (Precision * Recall) / (Precision + Recall) (4)
Area Under the Receiver Operating Characteristic (ROC) Curve (AUC-ROC): This curve is useful for binary classification problems [24]. It represents the trade-off between sensitivity and specificity across different thresholds.
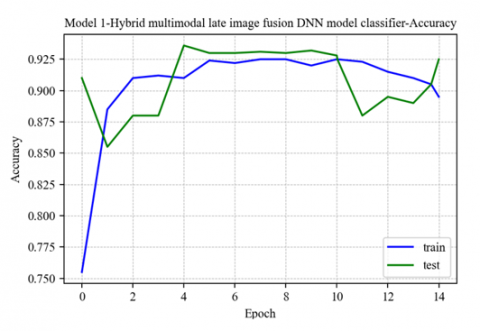
We compared our planned works to the state-of-the-art work produced by Sivaranjini and Sujatha [25] to ensure their efficacy. They built a deep-learning model for PD classification. They classified it using AlexNet, a CNN. They achieved an accuracy rate of 88.9 in their tests. Model 1, which we presented first, is called Multi-modal late image fusion using CNN and DNN as feature extractors and DNN as a classifier. It has several impressive numbers: 92.12 for training accuracy, 92.27 for test accuracy, 94 for precision, 90 for recall, 91 for F1 score, and.98 for ROC AUC score. The model accuracy and loss graph are depicted in Figure 5 and Figure 6. The ROC curve for Model 1 is shown in Figure 7.
Figure 5. Model 1-accuracy graph for train and test
Figure 6. Model 1-loss graph for train and test
Figure 7. Model 1-ROC curve
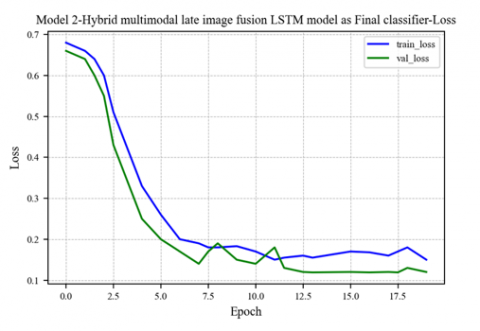
The second proposed model is a late image fusion technique entitled Multi-modal late image fusion with CNN and DNN as feature extractors and LSTM as classifier. It shows a training accuracy of 92.54, Test accuracy of 93.96, precision of 95, recall of 92, F1 score of 93, and ROC AUC score of .98. The model accuracy and loss graph are depicted in Figure 8 and Figure 9. The ROC curve for Model 2 is shown in Figure 10.
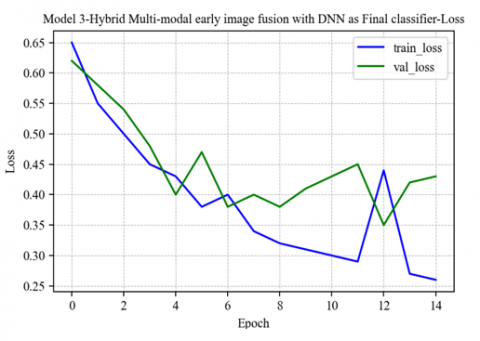
The third proposed model is Multimodal early image fusion with CNN and DNN as feature extractors and DNN as classifiers. It shows a training accuracy of 89.92, Test accuracy of 89.97, precision of 91, recall of 87, F1 score of 89, and ROC AUC score value of .976. The model accuracy and loss graph are depicted in Figures 11 and 12. The ROC curve for Model 3 is shown in Figure 13.
Figure 8. Model 2-accuracy graph for training and test
Figure 9. Model 2-loss graph for training and test
Figure 10. Model 2-ROC curve
Figure 11. Model 3-accuracy graph for training and test
Figure 12. Model 3-loss graph for training and test
Figure 13. Model 3-ROC curve
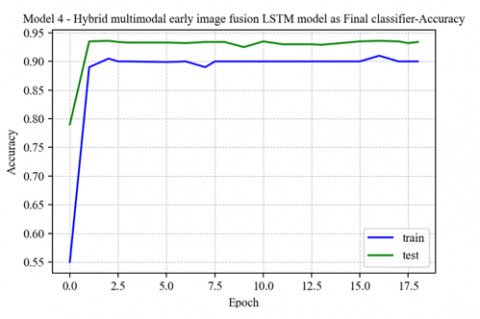
Figure 14. Model 4-accuracy graph for training and test
Figure 15. Model 4-loss graph for training and test
Figure 16. Model 4-ROC curve
Table 1. Performance measures for different proposed models
|
Models |
ROC-AUC |
Accuracy Values |
Precision |
Recall |
F1 Score |
|
|
Train |
Test |
|||||
|
Model 1 |
0.98 |
92.12 |
92.27 |
94 |
90 |
91 |
|
Model 2 |
0.98 |
92.54 |
93.96 |
95 |
92 |
93 |
|
Model 3 |
0.976 |
89.92 |
89.97 |
91 |
87 |
89 |
|
Model 4 |
0.982 |
90.21 |
92.21 |
91 |
92 |
92 |
Our final proposed model is a multimodal early image fusion with CNN and DNN as feature extractors and LSTM as a classifier. It shows a training accuracy of 90.21, Test accuracy of 92.21, precision of 91, recall of 92, F1 score of 92, and ROC AUC score of 0.982. The model accuracy and loss graph are depicted in Figure 14 and Figure 15. The ROC curve for Model 4 is shown in Figure 16.
Table 1 shows performance measures for different proposed models. Out of four proposed models, Model 2—Hybrid Multi-modal late image fusion with CNN and DNN as feature extractors and LSTM as classifier—shows the highest accuracy value. For all the proposed models, testing accuracy is higher than training accuracy, which means all the proposed models learn more effectively than the existing model developed by Sivaranjini and Sujatha [25], which was used for the comparative study.
Our experiments demonstrate that Model 2, utilizing a hybrid late fusion of MRI and DaT scans, achieves a superior test accuracy of 93.96%. This significant improvement over traditional single-modality models highlights the strength of multimodal fusion in diagnosing neurodegenerative diseases. Integrating blurring and sharpening in the augmentation process enhanced the model’s robustness, ensuring better performance under varying real-world imaging conditions. Clinically, the increased recall rate positions our approach as a reliable tool for early disease detection, vital for interventions in diseases like Parkinson’s and Alzheimer’s.
Compared to Chakraborty et al. [12], who employed 3D CNNs on MRI data and achieved a 95.29% accuracy, our multimodal fusion provides richer diagnostic information by leveraging anatomical and functional imaging despite a slight drop in accuracy. Compared to Sivaranjini and Sujatha [25], who achieved 88.9% accuracy using AlexNet, our method presents a 5% improvement attributable to the addition of DaT scans, which capture functional details overlooked in single-modality approaches. Furthermore, VGG16-based CNN systems focused on PET data reported 84.6% precision, while our 95% precision showcases the efficacy of late fusion and hybrid deep learning architectures in diagnostic accuracy.
Figure 17 depicts the accuracy value graph of the proposed models. The advantage of this model is it can take two types of image modalities to assess the chance of Parkinson’s. Neurologists usually check different biomarkers to accurately diagnose Parkinson's disease, so if we have an application that takes these different modalities as input and predicts or diagnoses Parkinson’s, which will be a significant development in this field. Using the proposed models, we can develop deep learning applications that can accept MRI and DaT scan images and predict whether the input image falls under the Parkinson’s category.
Figure 17. Graphical plot of the proposed model’s accuracy
Neurodegenerative disorders primarily manifest through the loss of neurons. Prominent among these disorders are Alzheimer's disease and Parkinson's disease. Detecting these disorders involves a substantial amount of clinical assessment, which can be time-consuming. Fortunately, neuroimaging biomarkers such as MRI, DaT scan, and fMRI offer a solution, allowing us to identify the presence of these disorders. This paper harnessed the power of deep learning techniques and image fusion on multi-modal data to analyze different Biomarkers. This study introduced four innovative deep learning models utilizing hybrid multimodal image fusion techniques, combining MRI and DaT scans to diagnose Parkinson's disease. Augmentation methods like blurring and sharpening improved data diversity, and class weighting addressed dataset imbalance. The proposed models demonstrated superior performance, with Model 2 achieving the highest accuracy of 93.96%.
Despite the success, certain limitations remain. Data imbalance may still introduce bias, especially with limited DaT scans. Moreover, the computational complexity of using LSTM in late fusion models increases processing time, making real-time applications in clinical environments more challenging.
Future research could explore integrating additional modalities, such as PET or fMRI, to overcome these challenges and further enrich the diagnostic process. Additionally, incorporating transformer-based architectures or attention mechanisms could improve feature selection and reduce the computational cost. Model compression techniques should also be considered to facilitate real-time clinical deployment.
[1] Koros, C., Stefanis, L., Scarmeas, N. (2022). Parkinsonism and dementia. Journal of the Neurological Sciences, 433: 120015. https://doi.org/10.1016/j.jns.2021.120015
[2] Zhang, L., Wang, M., Liu, M., Zhang, D. (2020). A survey on deep learning for neuroimaging-based brain disorder analysis. Frontiers in Neuroscience, 14: 779. https://doi.org/10.3389/fnins.2020.00779
[3] Márquez, F., Yassa, M.A. (2019). Neuroimaging biomarkers for Alzheimer’s disease. Molecular Neurodegeneration, 14(1): 21. https://doi.org/10.1186/s13024-019-0325-5
[4] Mozhdehfarahbakhsh, A., Chitsazian, S., Chakrabarti, P., Chakrabarti, T., Kateb, B., Nami, M. (2021). An MRI-based deep learning model to predict Parkinson’s disease stages. medRxiv, 2: 19. https://doi.org/10.1101/2021.02.19.21252081
[5] Shaban, M. (2023). Deep learning for Parkinson’s disease diagnosis: A short survey. Computers, 12(3): 58. https://doi.org/10.3390/computers12030058
[6] Arafa, D.A., Moustafa, H.E.D., Ali-Eldin, A.M., Ali, H.A. (2022). Early detection of Alzheimer’s disease based on the state-of-the-art deep learning approach: A comprehensive survey. Multimedia Tools and Applications, 81(17): 23735-23776. https://doi.org/10.1007/s11042-022-11925-0
[7] Tagaris, A., Kollias, D., Stafylopatis, A. (2017). Assessment of parkinson’s disease based on deep neural networks. In Engineering Applications of Neural Networks: 18th International Conference, EANN 2017, Athens, Greece, pp. 391-403. https://doi.org/10.1007/978-3-319-65172-9_33
[8] Pringsheim, T., Jette, N., Frolkis, A., Steeves, T.D. (2014). The prevalence of Parkinson's disease: A systematic review and meta-analysis. Movement Disorders, 29(13): 1583-1590. https://doi.org/10.1002/mds.25945
[9] Summaira, J., Li, X., Shoib, A. M., Li, S., Abdul, J. (2021). Recent advances and trends in multimodal deep learning: A review. arXiv preprint arXiv:2105.11087. https://doi.org/10.48550/arXiv.2105.11087
[10] Tang, L., Hui, Y., Yang, H., Zhao, Y., Tian, C. (2022). Medical image fusion quality assessment based on conditional generative adversarial network. Frontiers in Neuroscience, 16: 986153. https://doi.org/10.3389/FNINS.2022.986153
[11] Zhang, X., Yang, Y., Wang, H., Ning, S., Wang, H. (2019). Deep neural networks with broad views for Parkinson's disease screening. In 2019 IEEE International Conference on Bioinformatics and Biomedicine (BIBM), San Diego, CA, USA, pp. 1018-1022. https://doi.org/10.1109/BIBM47256.2019.8983000
[12] Chakraborty, S., Aich, S., Kim, H.C. (2020). Detection of Parkinson’s disease from 3T T1 weighted MRI scans using 3D convolutional neural network. Diagnostics, 10(6): 402. https://doi.org/10.3390/diagnostics10060402
[13] Modi, H., Hathaliya, J., Obaidiat, M.S., Gupta, R., Tanwar, S. (2021). Deep learning-based Parkinson disease classification using PET scan imaging data. In 2021 IEEE 6th International Conference on Computing, Communication and Automation (ICCCA), Arad, Romania, pp. 837-841. https://doi.org/10.1109/ICCCA52192.2021.9666251
[14] Yu, J., Meng, K., Liang, T., Liu, H., Wang, X. (2024). Improved deep learning for Parkinson’s diagnosis based on wearable sensors. Electronics, 13(23): 4638. https://doi.org/10.3390/electronics13234638
[15] Long, D., Wang, J., Xuan, M., Gu, Q., Xu, X., Kong, D., Zhang, M. (2012). Automatic classification of early Parkinson's disease with multi-modal MR imaging. PloS One, 7(11): e47714. https://doi.org/10.1371/journal.pone.0047714
[16] El-Sappagh, S., Abuhmed, T., Islam, S.R., Kwak, K.S. (2020). Multimodal multitask deep learning model for Alzheimer’s disease progression detection based on time series data. Neurocomputing, 412: 197-215. https://doi.org/10.1016/J.NEUCOM.2020.05.087
[17] Li, Y., Zhao, J., Lv, Z., Li, J. (2021). Medical image fusion method by deep learning. International Journal of Cognitive Computing in Engineering, 2: 21-29. https://doi.org/10.1016/J.IJCCE.2020.12.004
[18] Maharana, K., Mondal, S., Nemade, B. (2022). A review: Data pre-processing and data augmentation techniques. Global Transitions Proceedings, 3(1): 91-99. https://doi.org/10.1016/j.gltp.2022.04.020
[19] Shorten, C., Khoshgoftaar, T.M. (2019). A survey on image data augmentation for deep learning. Journal of Big Data, 6(1): 1-48. https://doi.org/10.1186/s40537-019-0197-0
[20] Jabeen, S., Li, X., Amin, M. S., Bourahla, O., Li, S., Jabbar, A. (2023). A review on methods and applications in multimodal deep learning. ACM Transactions on Multimedia Computing, Communications and Applications, 19(2s): 1-41. https://doi.org/10.1145/3545572
[21] de la Fuente-Fernández, R. (2012). Role of DaTSCAN and clinical diagnosis in Parkinson disease. Neurology, 78(10): 696-701. https://doi.org/10.1212/WNL.0b013e318248e520
[22] The NTUA Parkinson’s Dataset. (2023). https://github.com/ails-lab/ntua-parkinson-dataset/tree/master.
[23] Naidu, G., Zuva, T., Sibanda, E.M. (2023). A review of evaluation metrics in machine learning algorithms. In Computer Science On-Line Conference, pp. 15-25. https://doi.org/10.1007/978-3-031-35314-7_2
[24] Ramzan, F., Khan, M.U.G., Rehmat, A., Iqbal, S., Saba, T., Rehman, A., Mehmood, Z. (2020). A deep learning approach for automated diagnosis and multi-class classification of Alzheimer’s disease stages using resting-state fMRI and residual neural networks. Journal of Medical Systems, 44: 1-16. https://doi.org/10.1007/s10916-019-1475-2
[25] Sivaranjini, S., Sujatha, C.M. (2020). Deep learning based diagnosis of Parkinson’s disease using convolutional neural network. Multimedia Tools and Applications, 79(21): 15467-15479. https://doi.org/10.1007/s11042-019-7469-8