Hemant Choubey*![]() | Shourabh Singh Raghuwanshi
| Shourabh Singh Raghuwanshi![]() | Hemlata Arya
| Hemlata Arya![]() | Parul Saxena
| Parul Saxena![]() | Jaimala Jha
| Jaimala Jha![]() | Shivangi Sharma
| Shivangi Sharma![]()
© 2025 The authors. This article is published by IIETA and is licensed under the CC BY 4.0 license (http://creativecommons.org/licenses/by/4.0/).
OPEN ACCESS
The diagnosis and treatment of epilepsy depend heavily on the identification of epileptic seizures from the sample of EEG signal. This paper mainly focuses on the identification of Epileptic seizure and classification of EEG signals based on the three important statistical features that prioritized the non-stationary characteristics of EEG signals i.e. complexity, energy fluctuation, and Autoregressive model to represent the distinctive seizure patterns. Three features of Sample Entropy (SE) which measure the complexity, one of Mean Teager Energy (MTE) which measures the transitory energy fluctuations related to seizure activity, and four of Autoregressive (AR) modeling techniques present a novel method for seizure identification. Based on linear correlations, the AR model is used to represent the distinctive seizure patterns. For the purpose of training the AR model, the signals were divided into pre-ictal (pre-seizure) and inter-ictal (non-seizure) segments. The MTE and SE feature samples of the EEG signals were calculated over sliding windows during the detection phase, and the AR model was utilized to forecast the following sample. This paper shows that the MTE, SE, and AR models together yielded promising seizure detection outcomes. This method outperformed existing approaches with excellent sensitivity and specificity in identifying seizure and non-seizure parts. The proposed method has the potential to be used for real-time seizure detection applications, facilitating prompt diagnosis and treatment for epileptic patients.
Mean Teager Energy (MTE), Sample Entropy (SE), Autoregressive (AR)
Epilepsy is a prevalent neurological disorder affecting millions worldwide, characterized by recurrent, unpredictable seizures stemming from abnormal brain activity. A neurological condition called epilepsy is marked by frequent, spontaneous seizures brought on by atypical brain activity. This is a long-term, central nervous system disorder that can present in different ways and to different degrees. Sudden, excessive electrical discharges in the brain's neurons create seizures in epilepsy, which momentarily impair normal brain function. From minor, transient alterations in awareness or feeling to severe convulsions and loss of consciousness, these disruptions can result in a wide spectrum of symptoms. In order to better understand the complex mechanisms behind epileptic seizures, this research will examine the intricacies of neuronal hyperexcitability, abnormal synchronisation, and the interaction between hereditary and environmental factors that influence seizure start and propagation. For the management and treatment of epilepsy, early epileptic episode recognition is essential. To create effective seizure detection models, a number of various ML techniques have recently been applied. This introduction focuses on the use of MTE(1) [1], SE(3) [2], and AR(4) [3] model features in combination with a number of well-known classification algorithms, including the LGBM, Decision Tree, Gradient Boost, K-Nearest Neighbours (KNN), Random Forest, Logistic Regression, and XGBoost (XGB) classifiers. MTE, a component that analyses signal energy variations, provides insight into the peculiar energy EEG patterns associated with seizures. The detection of seizure activity is aided by higher entropy levels, which sample signal complexity and irregularity. The AR model [3] describes the temporal correlations and patterns in EEG signals related to seizures. Machine learning systems can accurately discriminate between seizure and non-seizure states by combining these traits. Some of the most widely used algorithms for classification: (1) LGBM: The gradient-boosting framework LightGBM is renowned for its outstanding accuracy and efficiency. To improve predictive performance, it constructs a group of decision trees with improved gradient boosting technique. (2) Decision Tree: A well-liked classifier, decision trees divide data according to feature thresholds. Decision trees can successfully identify seizures by learning from the available characteristics and building a model that resembles a tree. (3) Gradient Boost: Gradient boosting is an ensemble method that combines the decision trees and other weak learners to produce a powerful prediction model. It enhances the performance of decision trees as a whole, addressing the flaws of individual decision trees. (4) K-Nearest Neighbours (KNN) classifies data points according to how close they are to nearby points. KNN can determine seizure patterns based on their resemblance to recognised seizure instances by computing the distances between data points in the feature space. (5) Random Forest: Using many decision trees to build predictions, Random Forest is an ensemble learning technique. By combining the findings of different trees, it reduces overfitting and offers reliable classification. (6) Logistic Regression: The connection between characteristics and the binary outcome (seizure or no seizure) is modelled using logistic regression. It calculates the probability of being in each class and labels each one according to a selected threshold. (7) XGBoost (XGB) is an optimised gradient boosting system that makes use of parallel processing and tree pruning methods. By supporting weak models, it produces quick and precise predictions. These algorithms can be taught to accurately categorise incoming EEG signals by using labelled data during training, where the features derived from EEG signals during seizure and non-seizure periods are used as input. These algorithms provide a comprehensive approach to epileptic seizure identification, permitting early intervention and better patient care. They combine MTE, SE, and AR model features for classifications. It is important to note that the properties of the dataset, the necessary computations, and the desired performance all influence the choice of an algorithm. Researchers and medical professionals should evaluate and compare the effectiveness of several algorithms to choose the best strategy for their particular application. The two main research objectives of this paper are: (1) Development of a model based on the extraction of features from MTE, SE, and AR. (2) EEG signal classification and epileptic seizure detection. This EEG database was obtained by Andrzejak et al. [4] and is publicly accessible through the University of Bonn. It consists of the five datasets A, B, C, D, and E. There are 4097 samples total across each of the 100 single-channel EEG segments in each dataset, each lasting 23.6 seconds. Section I describes the introduction of the proposed method and dataset description and preprocessing. Section II is related to the work on the detection of Epileptic Seizures using various classification techniques. Section III consists of the proposed work based on the extraction of MTE(1), SE(3), and AR(4) features. Sections IV and V are based on comparative analysis and results, respectively.
1.1 Dataset description and preprocessing
The datasets consist of five sets (denoted as A-E) provided by University of Bonn, each containing 100 single-channel EEG segments of 23.6 seconds. The details of each set are as follows:
Set A (marked as O): EEG segments recorded from five healthy volunteers with eyes open.
Set B (marked as Z): EEG segments recorded from the same healthy volunteers with eyes closed.
Set C (marked as N): EEG segments recorded from seizure-free intervals in the hippocampal formation of patients.
Set D (marked as F): EEG segments recorded during seizure-free intervals from the epileptogenic zone.
Set E (marked as S): EEG segments recorded during seizure activity from the epileptogenic zone.
Preprocessing the EEG datasets required two steps. A band-pass filtering (0.5-50Hz) was first used to get rid of high-frequency noise and low-frequency drifts. After that, automated methods were employed to eliminate artefacts such as muscular contractions and eye blinks.
Related research work on epileptic seizure detection using SE, MTE, and AR model based statistical features broadly depends on decomposition and pattern recognition of abnormal EEG signal. A wavelet-based feature extraction techniques in conjunction with expert models for the classification of EEG signals, including the detection of epileptic seizures, was examined by Subasi [5] work which underlined the importance of feature selection and classification strategies for effectively detecting seizures from the sample of EEG signal. The Teager energy operator and empirical mode decomposition (EMD) were studied by Kaleem et al. [6] as seizure detection approaches to increase the precision and effectiveness of seizure diagnosis in EEG data. A sparse representation-based automatic identification method for epileptic seizures from sample EEG signals was presented in a publication by Sheykhivand et al. [7]. The work extracted discriminative features using sparse coding techniques and an AR model, achieving excellent seizure detection accuracy. Determining the epileptogenic zones is a crucial and significant step in treating patients with pharmacoresistant focal epilepsy, according to Sriraam and Raghu [8]. EEG testing is a crucial part of the routine diagnostic procedure for assessing patients with epilepsy. This study looks at the use of numerous characteristics feature produced from different channels of EEG signal to distinguish between focal and non-focal epileptic seizures that were obtained from patients with pharmacoresistant focal epilepsy in the Barcelona database. An article by Subasi and Gursoy [9] explored the application of PCA, ICA, LDA and SVM for EEG signal classification, including the identification of epileptic seizures. This study highlighted the value of feature extraction and classification methods for raising seizure detection performance. Adeli et al. [10] discusses the wavelet decomposition of the EEG data. Transient qualities are finely localised within a time- and frequency-context. It is demonstrated that this mathematical microscope's capacity to examine many neural rhythm scales makes it a valuable resource for researching minuscule oscillations in brain signals. The research conducted by Cao et al. [11] suggests the use of KPCA, PCA and ICA. The original inputs are linearly transformed into new, uncorrelated features by PCA. A nonlinear PCA called KPCA was constructed using the kernel technique. The original inputs are linearly transformed into features in ICA that are statistically different from each other. Yentes et al. [12] evaluated the repeatability or predictability of a time series data by using mathematical methodologies such as SE (SampEn) and approximate entropy (ApEn). In the case of tiny data sets, SampEn appears to be more reliable. SampEn shown less susceptibility to changes in the length of the data and less trouble preserving relative consistency. The Molina-Picó et al. [13] research attempts to provide a better understanding of ApEn and SampEn performance in light of biological signal analysis and the impact of spikes on Abnormal EEG pattern and detection. Song et al. [14] suggested detection of epileptic seizures using sample entropy-extreme learning machine framework. This approach accomplishes both a high detection accuracy and a quick computation time. In order to discriminate between interictal and ictal EEG data, the study by Yuan et al. [15] estimated the Hurst exponent, Approximate Entropy, and scaling exponent nonlinear EEG measures to analyze this work. The Hurst exponent, Approximate Entropy and scaling exponent obtained with DFA can be used to extract the nonlinear and non-stationary characteristics of EEG time series data. Diambra et al. [16] identify epileptic seizure activity using the approximate entropy (ApEn) technique. ApEn, a freshly created statistical number, is used to measure complexity and regularity in time series data. These related works provide valuable insights into the application of MTE, SE, and AR model features for epileptic seizure identification. Related research demonstrates the efficacy of these features in accurately identifying seizure events and distinguishing them from normal brain activity, thereby contributing to the development of reliable seizure detection systems that introduces a novel combination of SE, MTE, and AR models for seizure detection for their unique contributions to analyzing EEG signals and their complementary strengths in capturing different aspects of seizure activity.
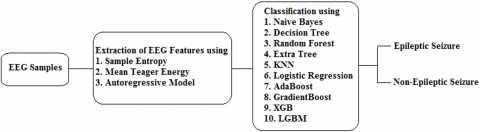
The proposed work is divided into three subsections, as Figure 1 illustrates. (i) Energy, randomness, and pattern recognition are employed to recover features; (ii) significant features are chosen; and (iii) features are used to identify epileptic episodes. The extracted features are classified into general categories such as MTE, SE, and AR models, The Block diagram of the proposed work includes:
EEG Samples Block: EEG Samples are extracted from 500 EEG signals i.e., Z, O, N, F, S.
Extraction Block: Extraction of EEG features related to Energy, randomness, and pattern recognition includes: MTE, SE, and AR models.
Classification Block: Classification Block to identify epileptic episodes from EEG samples based on the characteristics of extracted features.
Figure 1. Proposed work
3.1 Feature extraction and selection
In this section, MTE, SE, and AR models are used to extract features from EEG signals. AR models examine temporal dependencies, SE quantifies signal complexity, and MTE records abrupt changes in signal energy. This step is required to describe various elements of EEG dynamics connected to seizure activity. After that PCA for feature selection is used to minimize dimensionality and preserve the most informative features. Furthermore, cross-validation and statistical analysis aid in determining the most discriminative characteristics needed to create a seizure detection model.
3.2 MTE
A feature for signal analysis is the MTE, a measure of signal energy that catches sudden shifts. The following mathematical formula can be used to get the MTE of a signal ×1(n) at time index n:
MTE=(1/N)×∑N−1n=1(x1(n)2−x1(n−1)×1(n+1)) (1)
N represents the length of the signal ×1(n). A single value was calculated for each channel from a total of 100 channels. The higher value of MTE represents Epileptic Seizure.
3.3 SE
The conditional likelihood that two sequences that are similar at point 'm' will stay similar at point 'N' is represented by the negative logarithm SampEn(m,r,N), where self-matches are not included in the probability measure.
\operatorname{SampEn}(m, r, N)=-\ln \left(\frac{B^m(\boldsymbol{r})}{A^m(\boldsymbol{r})}\right) (2)
N denotes data point in a time series EEG data as x1(n)=x1(1), x1(2), x1(3)...x1(N), and Bm(r) reflects the likelihood that two sequences will match for m+1 points, whereas Am(r) represents the likelihood that two sequences will match for m points. Take the m vector defined as:
x_m 1(i)=[x l(i) . x l(i+1) \ldots \ldots \ldots x l(i+m-1)], for 1 \leq i \leq N-m+1 (3)
Beginning with the ith sample, these vectors reflect m subsequent ×1 values. Three variables affect SE: (1) the pattern length parameter (m); (2) the threshold parameter (r); and (3) the number of sampling points (N; N=500).
Steps for the calculation of SE
In the proposed work the value of SE is determined in the following steps as shown in Figure 2:
(1) Taking the number of sampling points (N=500).
(2) Initialize the value of m from 6 to 7 and i from 1 to N-m+1.
(3) Calculate Conditional Probability \mathrm{B}^{\mathrm{m}}(\mathrm{r}) and \mathrm{A}^{\mathrm{m}}(\mathrm{r}) for m=7 and m=6 respectively according to the value of threshold parameter(r).
(4) Calculate SE [2] as:
\operatorname{SampEn}(6, r, 500)=-\ln \left(\frac{B^m(r)}{A^m(r)}\right) (4)
Figure 2. Steps for calculation of SE
3.4 AR model
The procedure for estimating the AR parameters of a set of N data points using Burg's technique is as follows:
(1) Initialize:
a. Select a desirable value for the AR model's p order.
b. To hold the AR parameters, a, make an array of length p+1.
(2) Calculate the autocorrelation coefficients:
a. Determine the data sequence's autocorrelation coefficients, or r, for lags 0 to p.
b. The variance of the data sequence is the sole component of the autocorrelation coefficient at lag 0.
(3) Initialize the forward and backward prediction errors:
a. Make two arrays, E and A, each of length p+1, to hold the forward and backward prediction errors, respectively.
b. Assign the values E(0) and A(0) to r(0).
(4) Iterate using Burg's algorithm:
a. For m=1 to p, in order: Utilizing the following equation, determine the reflection coefficient, k(m) as Eq. (5):
k(m)=\left(r(m)-\sum_{i=1}^{m-1}(\boldsymbol{a}(\boldsymbol{i}) \times \boldsymbol{r}(\boldsymbol{m}-\boldsymbol{i}))\right) / \boldsymbol{E}(\boldsymbol{m}-\mathbf{1}) (5)
b. Using the reflection coefficient, update the AR parameters as (6):
a(m)=k(m)-\sum_{i=1}^{\boldsymbol{m}-\mathbf{1}}(\boldsymbol{a}(\boldsymbol{i}) * \boldsymbol{k}(\boldsymbol{m}-\boldsymbol{i})) (6)
c. The forward and backward prediction errors should be updated as Eq. (7) and Eq. (8):
E(m)=E(m-1)^*\left(1-\boldsymbol{k}(\boldsymbol{m})^2\right) (7)
A(m)=A(m-1)^*\left(1-\boldsymbol{k}(\boldsymbol{m})^2\right) (8)
d. The estimated coefficients of the AR model are represented by the resulting AR parameters, a(1), a(2), ... , and a(p).
The AR parameters and prediction errors are updated together with the reflection coefficients iteratively by Burg's algorithm until convergence or the desired degree of accuracy is reached. Depending on the specific application or implementation, the initiation and convergence criteria may change.
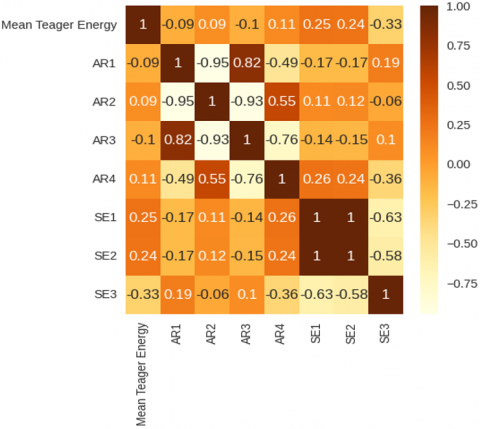
Table 1 lists a total of eight features. For seizure detection, MTE, SE (SE1, SE2, and SE3), and the AR model (AR1, AR2, AR3, and AR4) are utilized as inputs for the classifiers NB, DT, RF, Extra Tree, KNN, Logistic Regression, Ada-Boost, Gradient-Boost, XGB, and LGBM. According to the performance criteria presented in Table 2, significant features might be chosen. As seen in Figure 3, it is depicted as a heatmap. Table 3 lists the amount of EEG sample properties and some of its fundamental characteristics.
Table 1. Number of features
|
SN.O. |
Name of Feature |
No of Features |
|
1 |
Mean Teager Energy |
1 |
|
2 |
SE |
3 |
|
3 |
Autoregressive Model |
4 |
Table 2. Important features
|
SN.O. |
Feature Name |
(%) Utilization |
|
1 |
MTE |
0.9147 |
|
2 |
SE2 |
0.0456 |
|
3 |
SE3 |
0.0396 |
|
4 |
AR1 |
0 |
|
5 |
AR2 |
0 |
|
6 |
AR3 |
0 |
|
7 |
AR4 |
0 |
|
8 |
SE1 |
0 |
Figure 3. Number of parameters
Table 3. Features and its basic characteristics
|
Index |
Mean Teager Energy |
AR1 |
AR2 |
AR3 |
AR4 |
SE1 |
SE2 |
SE3 |
|
Count |
300 |
300 |
300 |
300 |
300 |
300 |
300 |
300 |
|
Mean |
9619.20682 |
-1.66554 |
0.662442 |
0.242011 |
-0.19696 |
0.008337 |
0.006019 |
0.628485 |
|
Std |
23828.39951 |
0.263071 |
0.524442 |
0.362158 |
0.121779 |
0.011406 |
0.009697 |
0.337591 |
|
Min |
23.3432 |
-2.745 |
-0.0661 |
-1.6042 |
-0.4052 |
0 |
0 |
0.0745 |
|
25% |
164.138975 |
-1.76258 |
0.3574 |
0.227075 |
-0.26778 |
0.001075 |
0.0004 |
0.371675 |
|
50% |
446.54235 |
-1.64855 |
0.55225 |
0.33905 |
-0.22545 |
0.0046 |
0.002632 |
0.55635 |
|
75% |
4648.275 |
-1.51453 |
0.787025 |
0.435825 |
-0.16628 |
0.011425 |
0.0081 |
0.8478 |
|
Max |
171190 |
-1.1169 |
2.9568 |
0.6032 |
0.3713 |
0.1034 |
0.096 |
2.704 |
Accuracy, Precision, and F1 score are the performance parameters that assess the suitability of the prediction model.
4.1 Accuracy, precision, and F1 score of the model
It specifies, out of a possible four classes, which particular MRI image is correct. It measures how true values compare to total values.
Accuracy =\frac{\operatorname{TrN}+\operatorname{TrP}}{(\operatorname{TrN}+\operatorname{TrP}+\mathrm{FaN}+\mathrm{FaP})} (6)
Precision =\frac{\mathrm{TrP}}{(\mathrm{TrP}+\mathrm{FaP})} (7)
Recall =\frac{\operatorname{TrP}}{(\operatorname{TrP}+\mathrm{FaN})} (8)
\mathrm{F} 1=\frac{2 * \text {Precision} * \text { Recall}}{(\text { Precision }+ \text { Recall})} (9)
where, TrP stands for "True Positive," TrN for "True Negative," FaP for "False Positive," and FaN for "False Negative."
4.2 Performance parameter using another classifier
Performance parameters using Extra Trees, KNN, Logistic Regression, AdaBoost, GradientBoost, XGB, LGBM, NB, RF, and DT classifiers are shown in Table 4 and Figure 4.
Table 4. Performance parameters using various classifiers
|
S.No. |
Type of Classifier |
Accuracy (%) |
Precision |
F1 Score |
|
1 |
Naive Bayes [17] |
96.66 |
1 |
0.97 |
|
2 |
Decision Tree [18] |
99.8 |
1 |
1 |
|
3 |
Random Forest [19] |
98.57 |
1 |
1 |
|
4 |
Extra Trees [20] |
82.22 |
0.86 |
0.81 |
|
5 |
KNN [21] |
86.66 |
0.88 |
0.86 |
|
6 |
Logistic Regression [22] |
93.33 |
0.88 |
0.86 |
|
7 |
AdaBoost [23] |
95.55 |
0.96 |
0.96 |
|
8 |
GradientBoost [24] |
98.09 |
0.96 |
0.96 |
|
9 |
XGB [25] |
99.9 |
1 |
1 |
|
10 |
LGBM [26] |
98.88 |
0.99 |
0.99 |
Figure 4. Accuracy, precision and F1 score for various types of classifiers
4.3 Comparison in terms of sensitivity, specificity, and accuracy with other existing state-of-art methods
Detailed comparative analysis with other state-of –art-methods shown in Table 5 in terms of performance metrics sensitivity, specificity, and accuracy.
Table 5. Comparison in terms of sensitivity, specificity, and accuracy with other existing state-of-art methods
|
Method |
Sensitivity (%) |
Specificity (%) |
Accuracy (%) |
|
Proposed (SE+MTE+AR) |
92.5 |
93 |
92.8 |
|
Discrete Wavelet Transform (DWT) |
89.1 |
88.5 |
88.8 |
|
Support Vector Machine (SVM) |
87.3 |
86.7 |
87 |
|
Artificial Neural Networks (ANN) |
90.4 |
89.9 |
90.1 |
|
Long Short-Term Memory (LSTM) |
91 |
90.2 |
90.6 |
The main goal of this work is to identify epileptic seizures by means of basic indicators like SE, MTE, and Autoregressive models. These are the statistical traits that are predicated on quick and simple categorization. The precise identification and classification of EEG signals is accomplished via a total of 8 characteristics, including 1 MTE, 3 S.E., and 4 AR, combined with 10 distinct classifiers. The accuracy, sensitivity, and F1 score performance model clearly show a good outcome when using an effective classifier such as XGB (99.9%). This study primarily focuses on three types of EEG data, but with the help of these features, it can be expanded upon and its classification accuracy enhanced in the future. ANN classifiers can reduce detection and classification computation times.
[1] Biju, K.S., Jibukumar, M.G., Rajasekharan, C. (2018). EEG analysis using a wavelet packet transforms mean energy and mean teager energy with an artificial neuro-fuzzy system. Exergy for A Better Environment and Improved Sustainability, Applications, Springer, Cham, 2: 627-635. https://doi.org/10.1007/978-3-319-62575-1_44
[2] Choubey, H., Pandey, A. (2021). A combination of statistical parameters for the detection of epilepsy and EEG classification using ANN and KNN classifier. Signal, Image and Video Processing, 15(3): 475-483. https://doi.org/10.1007/s11760-020-01767-4
[3] Zhang, Y., Liu, B., Ji, X., Huang, D. (2017). Classification of EEG signals based on autoregressive model and wavelet packet decomposition. Neural Processing Letters, 45: 365-378. https://doi.org/10.1007/s11063-016-9530-1
[4] Andrzejak, R.G., Lehnertz, K., Mormann, F., Rieke, C., David, P., Elger, C.E. (2001). Indications of nonlinear deterministic and finite-dimensional structures in time series of brain electrical activity: Dependence on recording region and brain state. Physical Review E, 64: 061907. https://doi.org/10.1103/PhysRevE.64.061907
[5] Subasi, A. (2007). EEG signal classification using wavelet feature extraction and a mixture of expert model. Expert Systems with Applications, 32(4): 1084-1093. https://doi.org/10.1016/j.eswa.2006.02.005
[6] Kaleem, M.F., Sugavaneswaran, L., Guergachi, A., Krishnan, S. (2010). Application of empirical mode decomposition and Teager energy operator to EEG signals for mental task classification. In 2010 Annual International Conference of the IEEE Engineering in Medicine and Biology, Buenos Aires, Argentina, pp. 4590-4593. https://doi.org/10.1109/IEMBS.2010.5626501
[7] Sheykhivand, S., Rezaii, T.Y., Mousavi, Z., Delpak, A., Farzamnia, A. (2020). Automatic identification of epileptic seizures from EEG signals using sparse representation-based classification. IEEE Access, 8: 138834-138845. https://doi.org/10.1109/ACCESS.2020.3011877
[8] Sriraam, N., Raghu, S. (2017). Classification of focal and non focal epileptic seizures using multi-features and SVM classifier. Journal of Medical Systems, 41(10): 160. https://doi.org/10.1007/s10916-017-0800-x
[9] Subasi, A., Gursoy, M.I. (2010). EEG signal classification using PCA, ICA, LDA and support vector machines. Expert Systems with Applications, 37(12): 8659-8666. https://doi.org/10.1016/j.eswa.2010.06.065
[10] Adeli, H., Zhou, Z., Dadmehr, N. (2003). Analysis of EEG records in an epileptic patient using wavelet transform. Journal of Neuroscience Methods, 123(1): 69-87. https://doi.org/10.1016/S0165-0270(02)00340-0
[11] Cao, L.J., Chua, K.S., Chong, W.K., Lee, H.P., Gu, Q.M. (2003). A comparison of PCA, KPCA and ICA for dimensionality reduction in support vector machine. Neurocomputing, 55(1-2): 321-336. https://doi.org/10.1016/S0925-2312(03)00433-8
[12] Yentes, J.M., Hunt, N., Schmid, K.K., Kaipust, J.P., McGrath, D., Stergiou, N. (2013). The appropriate use of approximate entropy and sample entropy with short data sets. Annals of Biomedical Engineering, 41: 349-365. https://doi.org/10.1007/s10439-012-0668-3
[13] Molina-Picó, A., Cuesta-Frau, D., Aboy, M., Crespo, C., Miró-Martínez, P., Oltra-Crespo, S. (2011). Comparative study of approximate entropy and sample entropy robustness to spikes. Artificial Intelligence in Medicine, 53(2): 97-106. https://doi.org/10.1016/j.artmed.2011.06.007
[14] Song, Y., Crowcroft, J., Zhang, J. (2012). Automatic epileptic seizure detection in EEGs based on optimized sample entropy and extreme learning machine. Journal of Neuroscience Methods, 210(2): 132-146. https://doi.org/10.1016/j.jneumeth.2012.07.003
[15] Yuan, Q., Zhou, W., Li, S., Cai, D. (2011). Epileptic EEG classification based on extreme learning machine and nonlinear features. Epilepsy Research, 96(1-2): 29-38. https://doi.org/10.1016/j.eplepsyres.2011.04.013
[16] Diambra, L., de Figueiredo, J.B., Malta, C.P. (1999). Epileptic activity recognition in EEG recording. Physica A: Statistical Mechanics and its Applications, 273(3-4): 495-505. https://doi.org/10.1016/S0378-4371(99)00368-4
[17] Rakshit, A., Khasnobish, A., Tibarewala, D.N. (2016). A naïve Bayesian approach to lower limb classification from EEG signals. In 2016 2nd International Conference on Control, Instrumentation, Energy & Communication (CIEC), Kolkata, India, pp. 140-144. https://doi.org/10.1109/CIEC.2016.7513812
[18] Aydemir, O., Kayikcioglu, T. (2014). Decision tree structure based classification of EEG signals recorded during two dimensional cursor movement imagery. Journal of Neuroscience Methods, 229: 68-75. https://doi.org/10.1016/j.jneumeth.2014.04.007
[19] Edla, D.R., Mangalorekar, K., Dhavalikar, G., Dodia, S. (2018). Classification of EEG data for human mental state analysis using Random Forest Classifier. Procedia Computer Science, 132: 1523-1532. https://doi.org/10.1016/j.procs.2018.05.116
[20] Fang, Y., Yang, H., Zhang, X., Liu, H., Tao, B. (2021). Multi-feature input deep forest for EEG-based emotion recognition. Frontiers in Neurorobotics, 14: 617531. https://doi.org/10.3389/fnbot.2020.617531
[21] Bablani, A., Edla, D.R., Dodia, S. (2018). Classification of EEG data using k-nearest neighbor approach for concealed information test. Procedia Computer Science, 143: 242-249. https://doi.org/10.1016/j.procs.2018.10.392
[22] Guerrero, M.C., Parada, J.S., Espitia, H.E. (2021). EEG signal analysis using classification techniques: Logistic regression, artificial neural networks, support vector machines, and convolutional neural networks. Heliyon, 7(6): e07258. https://doi.org/10.1016/j.heliyon.2021.e07258
[23] Hu, J. (2017). Automated detection of driver fatigue based on AdaBoost classifier with EEG signals. Frontiers in Computational Neuroscience, 11: 72. https://doi.org/10.3389/fncom.2017.00072
[24] Sunaryono, D., Sarno, R., Siswantoro, J. (2022). Gradient boosting machines fusion for automatic epilepsy detection from EEG signals based on wavelet features. Journal of King Saud University-Computer and Information Sciences, 34(10): 9591-9607. https://doi.org/10.1016/j.jksuci.2021.11.015
[25] Parui, S., Bajiya, A.K.R., Samanta, D., Chakravorty, N. (2019). Emotion recognition from EEG signal using XGBoost algorithm. In 2019 IEEE 16th India Council International Conference (INDICON), Rajkot, India, pp. 1-4. https://doi.org/10.1109/INDICON47234.2019.9028978
[26] Abenna, S., Nahid, M., Bajit, A. (2022). Motor imagery based brain-computer interface: improving the EEG classification using Delta rhythm and LightGBM algorithm. Biomedical Signal Processing and Control, 71: 103102. https://doi.org/10.1016/j.bspc.2021.103102