Vedagiri Dilli Ganesh*![]() | Rammohan Bommi
| Rammohan Bommi![]()
© 2024 The authors. This article is published by IIETA and is licensed under the CC BY 4.0 license (http://creativecommons.org/licenses/by/4.0/).
OPEN ACCESS
In the study involving turning Monel K500 with a Cubic Boron Nitride Insert, experiments assessed flank wear using the Edge Detection Technique, which is crucial for maintaining machined surface quality and the workpiece's fatigue resistance. Monel K500, widely used in aerospace for high-temperature applications, demands preserved surface integrity and minimized tool wear. This research aimed to establish optimal machining parameters for this specific alloy-insert combination while developing a novel method for precise flank wear measurement. FlankPix, an innovative tool wear monitoring approach in machining, employs pixel distance measurement and image edge detection to identify tool edges accurately while disregarding background noise for precise measurement. This method ensures a smooth tool contour, effectively evaluating the tool's condition. With an average prediction error of 1.29%, FlankPix significantly enhances accuracy in assessing tool geometry changes, improving product quality, and reducing errors in tool condition estimation during manufacturing.
turning, flank wear, canny edge detection, average prediction error, accuracy, error rate
1.1 Background
Many experts have written volumes and articles on the subject of tool wear. On the other hand, flank wear has received a relatively minor amount of attention, even though both online and offline methods for monitoring the state of machining tools have been offered. In their study, Danesh and Khalili [1] used a non-decimated wavelet transform and statistical data on surface flaws to look at how tool wear compared to the surface texture of the turned piece. As a result, they could detect how tool wear affected the texture of the workpiece's surface. Researchers [2, 3] used edge recognition and morphological component analysis to find blunted edges in industrial environments. Researchers [4, 5] used tungsten carbide inserts to measure the depth of the crater wear during quasi-orthogonal cutting tests on AISI 1045 steel. They used a synthetic neural network to help them accomplish this, which allowed them to succeed. Matlab served as the primary modelling tool in developing an image-processing method by Xiong and his colleagues to assess the degree of tool wear. The image capture system comprises high-frequency linear fluorescent light, a high-resolution CCD camera, and a data-gathering module [6, 7].
1.2 Literature review
Researchers [8-10] developed an automated tool wear monitoring system using the active contour approach and neural networks to analyse tool flank wear. Urbicain and Trejo [11] created a system to measure milling and insert cutting-edge flaws in real-time without interfering with production. An edge-preserving smoothing filter, picture gradient computation, and a cutting-edge damage assessment based on geometrical features make up a three-stage technique. The ANOVA (Analysis of Variance) and fuzzy rule methods [11, 12] were used to determine how much the AISI 5140 steel alloy wore down and how much noise it made. The L27 orthogonal array method, the MSER algorithm, and the deep pattern network [13] were used to measure the alloy's surface roughness and flank wear when dry. To determine how long a tool made from AISI 4340 steel will last, the study [14] ran tests on the material with an L9 orthogonal array, analysed the results with an ANOVA, and relied on Gilbert's method. For Gamma-Prime-reinforced alloys, the study [15] employed Kalman filtering to estimate tool wear and reported an 18% filter rate of error. Of these papers, the study [16] MSER Algorithm and DPN, published under the name FlankNet, are the most promising candidates for the method used to assess tool wear, in particular flank wear.
Ant Colony Optimization (ACO) and Canny's Edge Detection (Canny) have been used together to find skin lesions much more effectively in a study of optimisation and edge detection methods [17]. As a result, Fuzzy Logic's performance ranges from roughly 87% to 91%, with an average inaccuracy of 87%. The cutting forces and temperature acting cumulatively on the cutting tool throughout the machining operation create normal tool wear. Tool wear would have a significant impact on the surface quality of the machining workpiece. Improving workpiece surface quality is required to increase economic efficiency. A precise tool wear value, which may be utilised to schedule cutting tool replacement properly, can assist in providing optimal machining settings. The ideal machining parameter values can be found. As a result, much emphasis has been placed on developing the tool wear monitoring system [18-21]. Using the FlankPix algorithm, enhancing the accuracy of the Average Error Prediction of Flank Wear in Monel K500 to achieve the target sum (in percentage terms) is essential. If the proposed method succeeds, the typical error rate should decrease by over 90%.
A comprehensive review of existing literature reveals the importance of monitoring cutting tool technology, specifically in assessing the machinability of difficult-to-machine materials. The significance of flank wear in mining and various industries is underscored. Different ways of measuring tool wear have been looked into in the past, including non-decimated wavelet transform, edge recognition, morphological component analysis, neural networks, image processing tools like Matlab, and automated monitoring systems that use neural networks, edge-preserving smoothing filters, and real-time analysis methods.
1.3 Research gap
The literature survey revealed a crucial research gap concerning precise and reliable tool wear measurement techniques, particularly in high-temperature alloy applications like Monel K500. Existing methods, while informative, displayed limitations in accuracy and suitability for such specialized materials. There was a clear need for an advanced tool wear assessment approach that could effectively address the challenges posed by background noise, provide higher precision in edge detection, and offer more nuanced measurements of tool wear extent. The research gap made it clear that we need a new and improved way to measure tool wear that can provide higher accuracy, lower sensitivity to image noise, and work with the unique properties of high-temperature alloys like Monel K500. This gap laid the foundation for the development of the FlankPix algorithm as a solution to address these shortcomings and provide an advanced, technically enhanced tool wear measurement method for precise evaluation in challenging industrial settings.
1.4 Research objectives
The main research objective is determining the average flank wear error percentage when turning the Monel K500. According to the study [22], steel alloys have several exceptional properties, including excellent corrosion resistance in chloride and Sulphur dioxide environments. In recent years, monitoring cutting tool technology has been applied to evaluate the attributes of cutting tool materials to identify the machinability of cutting tool materials that are notoriously difficult to machine [23-25]. In addition, stress and cracking are extremely unlikely in these environments. According to the study [26], monitoring tool wear reduces workpiece errors by preventing unexpected breakage or overuse. If wear is not considered, the tool wear may cause damage to the workpiece or the machine itself. The importance of flank wear in the mining sector must be emphasized. According to the study [27], alloys are utilized in various global industries, including manufacturing, aerospace, the military, and medicine. According to the study [28], crater and flank wear are two additional types of tool wear, with the latter being crucial for machine stability, dependability, and diametric accuracy.
1.5 Significance of the study
Improving tool wear assessment accuracy is crucial for optimizing machining parameters and workpiece surface quality, enhancing economic efficiency. The development of the FlankPix algorithm is anticipated to fill the existing research gap and provide a technically advanced tool wear measurement method for high-temperature alloy applications.
The corrosion resistance of Alloy 400 is combined with the high-strength corrosion fatigue and erosion resistance of Monel K500, a nickel-copper alloy that may be age-hardened. MONEL K500 is an aluminium and titanium-added nickel-copper alloy with precipitation-hardening properties. Both 90-mm and 180-mm-diameter Monel K500 alloys were evaluated for turning purposes. The workpiece's (in-weight percentage) chemical components are listed as follows: Ni 63.0 Cu 29.5 Al 2.7, Ti 0.6 C 0.18 Fe 2.0 Mn 1.5 Si 0.50 S 0.010. The turning path was constructed using a NAGMATI 175 centre lathe. We employed Cubic Boron Nitride (CBN) inserts manufactured by Sandvik and meeting the requirements of CNGA 120 408S01030A, 7025 Grade, fixed in a PCLNR 2020 K12 tool holder for the experiments.
2.1 Monel K500 alloy: Specifications
Chemical Composition (approximate percentages): Nickel (63%), Copper (29.5%), Aluminum (2.7%), Titanium (0.6%), Carbon (0.18%), Iron (2.0%), Manganese (1.5%), Silicon (0.50%), Sulfur (0.010%).
Mechanical Properties: Monel K500 offers high tensile strength, excellent corrosion resistance, good hardness, and fatigue strength. The hardness of the Monel K 500 is 35HRC.
Temperature Resistance: Exhibits outstanding resistance to a wide range of temperatures, making it suitable for high-temperature applications.
Age-Hardening Alloy: It can be strengthened through precipitation hardening after aging heat treatment.
2.2 CBN inserts: Specifications
Material Composition: CBN inserts are made from synthetic crystalline structures of boron and nitrogen.
Hardness: Extremely high hardness comparable to diamond, making them suitable for machining hard materials like hardened steels, cast iron, and superalloys.
High Thermal Conductivity: CBN inserts possess excellent thermal conductivity, aiding in dissipating heat generated during machining processes.
Wear Resistance: Known for their exceptional wear resistance, CBN inserts offer extended tool life even under high-speed machining conditions.
Machining Applications: Often used in machining applications requiring high-speed cutting, high precision, and durability, particularly in hard materials where traditional carbide inserts might wear out quickly.
Investigators regularly measured flank wear offline with a universal measuring microscope. For the experiment, an L27 orthogonal array was used. Table 1 shows the values for the machining parameters feed rate, depth of cut, and cutting speed. Testing was carried out in a dry setting. Images of worn-out equipment were taken using a scanning electron microscope (SEM) for computer vision analysis.
Table 1. Machining parameters
|
Sl. No |
Parameters |
Unit |
Symbols |
L1 |
L2 |
L3 |
|
1 |
Cutting speed |
m/min |
V |
450 |
660 |
900 |
|
2 |
Feed rate |
mm/rev |
S |
0.125 |
0.16 |
0.20 |
|
3 |
Depth of cut |
mm |
D |
0.6 |
0.8 |
1.0 |
The core steps of the FlankPix algorithm rely on the Canny edge detection technique, a multi-stage process that identifies abrupt changes in intensity within grayscale images. The steps in this method are
•Noise reduction using Gaussian blur;
•Gradient calculation to find out the strengths and directions of edges;
•Non-maximum suppression keeps track of the ridges representing edges, and hysteresis thresholding is used to create edge maps based on high and low thresholds.
FlankPix stands out for its ability to precisely identify tool edges while disregarding background noise, resulting in accurate measurements of tool wear. Its effectiveness lies in the combination of pixel distance measurement and edge detection techniques, which contribute to maintaining a smooth and precise tool contour, which is critical for evaluating the tool's condition. This method demonstrates an average prediction error of just 1.29%, showcasing its high accuracy in assessing tool geometry changes and enhancing product quality in manufacturing processes.
The images of the tool wear were first processed using the Innovative FlankPix algorithm, then submitted to the edge detection algorithm and pixel measurement to estimate the amount of flank wear that each of the respective images has. The % error is the ratio of the difference between the measured value and predicted value to the measured value, as in Eq. (1).
$\%$ Error $=\frac{M-P}{M}$ (1)
where, M is experimental value of Flank wear, P is predicted value using FlankPix method.
3.1 Canny edge detection
A canny edge detector is a multi-stage operator for edge detection that can identify various image edges. Moreover, Canny provided a computational edge detection theory to clarify the efficacy of his approach. It was intended to create a superior edge detector that the Canny operator developed. It takes in a grayscale image and spits out a second image labelled with the coordinates of any abrupt changes in intensity that it detects. There are five stages to the Canny Edge detection method. Methods of reducing noise, calculating gradients, employing non-maximal suppression, utilizing a double threshold, and using hysteresis to track edges are discussed.
Several steps are required for the Canny operator to complete his work. Gaussian convolution is first used to smooth the image. A straightforward 2-dimensional first derivative operator was applied to the smoothed image to draw attention to areas with high first spatial derivatives. With the magnitude of the gradient, edges create ridges. The algorithm then follows the crests of these ridges, performing non-maximal suppression by setting all pixels that are not actually on the ridge top to zero. This results in a narrow line in the final output. Two thresholds, T1 and T2, govern the hysteresis shown in the tracking process, with T1 being higher than T2. Assuming T1 is the starting location, tracking can only start at a higher ridge. From there, they tracked in both directions until the ridge's elevation was lower than T2. Using hysteresis like this helps to prevent the splintering of loud edges into smaller pieces.
Gaussian Blur Kernel Size (σ): The size of the Gaussian blur kernel influences the amount of smoothing applied to the image. A larger kernel (higher σ) produces more blur, reducing noise but potentially blurring edges. Common σ values range from 1 to 3.
High and Low Thresholds: The Canny edge detector uses two thresholds to determine which edge pixels to consider as strong, weak, or non-relevant:
High Threshold (T₁): Determines the minimum gradient value required for a pixel to be considered a strong edge pixel.
Low Threshold (T₂): Sets the minimum gradient for a pixel to be considered a weak edge pixel. Any pixel with a gradient value between T₁ and T₂ is marked as a weak edge pixel.
Hysteresis Thresholding: This step helps in connecting edge pixels into continuous edges. It involves:
Strong Edge Pixel: Pixels above the high threshold (T₁).
Weak Edge Pixel: Pixels between the high (T₁) and low (T₂) thresholds.
Non-relevant Edge Pixel: Pixels below the low threshold (T₂) are considered non-relevant.
Edge Connectivity: Weak edge pixels are considered part of the edge if they are connected to strong edge pixels. This connectivity step forms continuous edges.
3.1.1 Noise reduction
One way to remove noise from an image is to apply a Gaussian blur. It is achieved using the Gaussian Kernel (3×3, 5×5, 7×7, etc.) image convolution technique. The degree of blur is the most critical factor when choosing a blur kernel. The blur becomes less apparent as the size of the kernel decreases. This research uses a 5×5 Gaussian kernel.
$\begin{gathered}\text { lessto }= \\ \frac{1}{2 \pi \sigma^2} \exp \left(-\frac{(e-(k+1))^2+(f-(k+1))^2}{2 \sigma^2}\right) \\ 1 \leq e, f \leq(2 k+1)\end{gathered}$ (2)
$\mathrm{S}=\mathrm{I} * \mathrm{~g}(\mathrm{x}, \mathrm{y})$ (3)
where,
$\begin{gathered}g(x, y)=\frac{1}{\sqrt{2 \pi \sigma^1}} e^{\frac{x^2+y^2}{2 \sigma^2}} \\ \mathrm{H}_{\text {ef }}=\text { Filter function }\end{gathered}$(4)
Eq. (2) shows the Gaussian Kernel filter equation.
3.1.2 Gradient calculation
The gradient size throughout the dimensions can be determined by computing the filter's derivative for the X and Y dimensions and then converging that result with I. It is also possible to determine the image's orientation by calculating the tangent of the angle between the two measurements. A gradient vector, complete with magnitude and direction, results from the convolution. In the end, the Gaussian derivatives are responsible for the staleness of the final edges.
3.1.3 Non maximum suppression
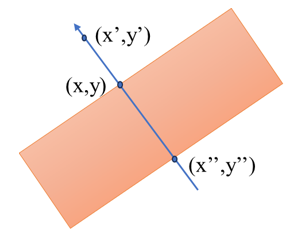
Consider the three edge points on edge shown in Figure 1. Consider the coordinates (x,y) as an example, assuming the edge gradient is at its highest level. It must be proven that the gradient perpendicular to the edge is less than (x,y). If the values are less than the (x,y) gradient, the non-maximal locations along the curve can be skipped.
Figure 1. Non – maximum suppression
3.1.4 Hysteresis thresholding
When creating an edge map, hysteresis thresholding considers both high and low thresholds before settling on a solution (see Figure 2). A significant improvement over single thresholding can be achieved by appropriately computing both the low and high points and then processing the resulting thresholder images. In contrast to single thresholding, hysteresis thresholding uses low and high thresholds to find edges via a linking procedure.
Figure 2. Hysteresis thresholding
3.2 Flank wear measurement using distancing method
The FlankPix algorithm incorporates distance measurement through the utilization of Canny edge detection. After the Canny edge detection technique identifies edges within grayscale images, the algorithm calculates the distance or extent of flank wear based on these detected edges. Canny edge detection, within the context of FlankPix, helps pinpoint the abrupt changes in intensity that signify the edges of the worn tool. The outcome of the canny edge detection can be seen in Figure 3.
Figure 3. (a) Tool wear SEM image, (b) Edge detected image of original SEM image
Once the edges are identified, FlankPix utilizes distance measurement techniques to determine the amount of wear along these edges precisely. It involves calculating the distance between specific points on the edges, allowing for an accurate estimation of the flank wear's extent. By integrating distance measurement with the information obtained through Canny Edge detection, FlankPix ensures a detailed assessment of the tool's wear, improving accuracy in evaluating tool conditions and ultimately enhancing manufacturing quality.
Figure 4. Proposed methodology
The process followed in tool wear detection from SEM images is illustrated in Figure 4, as given below. The input test image is pre-processed by converting it to grayscale binary. The bwconncomp command calculates the binary cumulative area. Moreover, the orientation, minor axis length, and significant axis length at their maximums can be obtained. The pixels of the captured image are determined, as illustrated in Figure 5. After examining the collected image of the interconnected construction blocks, we calculated the size of each pixel in the x and y directions using the number of pixels placed in the x and y directions. The capture event command reads the coordinates of the point in the X and Y directions.
Figure 5. FlankPix analysis
The measured parameters are as follows:
Major Axis Length 583.54 mm
Minor Axis Length 200.36 mm
3.2.1 Steps in FlankPix algorithm
1. Open CV
2. Create a new file
3. Launch a Python program
4. Import the files that contain the headers
5. Download and install the necessary Python interpreters for the algorithms, such as OpenCV, matplotlib, and NumPy
6. Change the color mode of the image to grayscale
7. To detect edges in the photos, run Canny's Edge Detection Algorithm
8. Fix the threshold value (Edge detection)
9. Accumulate Pixel coordinates in Px and Py
10. Calculate the distance from the pixel coordinates
12. Convert the value from Pixels to mm
13. Compare the predicted value with the respective experimental data
15. Calculate the % Error and average error percentage
3.2.2 Sensitivity analysis of the vision system
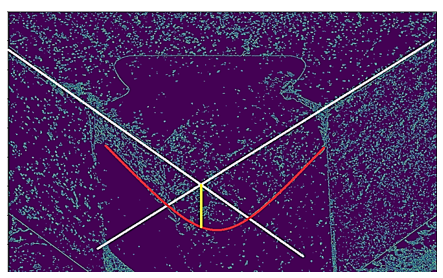
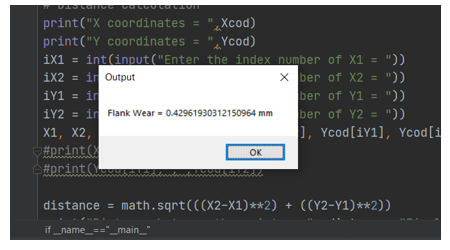
The precision of the suggested vision system depicted in Figure 6 was determined by comparing the measured values for flank wear.
Error Sensitivity = [ Experimental Value]-[Predicted Value]/
[Experimental value]* 100
For the given input image,
Experimental measured value = 0.43 mm
FlankPix predicted value = 0.4296 mm
Error Sensitivity = (0.43-0.4296)/0.43 = 0.00093×100 = 0.093%
Average Prediction error = 1.29%
Figure 6. Flank wear measurement using FlankPix
Monel K500 was turned with a cubic boron nitride insert. Several experiments were conducted. The edge detection technique was utilized to determine the extent of flank wear. The worn insert would undermine the integrity of the machined surface, diminishing the workpiece's resistance to fatigue and, consequently, its longevity. The aerospace industry uses the alloy known as Monel K500 extensively for high-temperature applications. As a direct result, it is essential that the integrity of the machined surface of this alloy is maintained and that tool wear is minimized. In addition, it is vital to define the proper machining parameters for this insert material and alloy combination. Throughout this investigation, a novel method for measuring flank wear was devised.
Table 2 displays the results of the flank wear analysis performed with FlankPix and the Tool Maker's Microscope. It also includes factors, dependents, and error percentages for traditional and non-traditional flank wear measurements. When predicting the flank wear of the insert, FlankPix performs admirably, with impressively high accuracy and a significantly reduced error percentage; the new Edge detection technique has an average error of 1.29%.
Table 2. Flank wear was measured using experimental values and the FlankPix algorithm
|
Experiment Number |
Cutting Speed (V) m/min |
Feed Rate (S) mm/rev |
Depth of Cut (D) mm |
Experimental Flank Wear in mm |
Flank Wear Predicted Using FlankPix in mm |
Prediction Error |
|
1 |
450 |
0.125 |
0.6 |
0.542 |
0.54 |
0.3690 |
|
2 |
450 |
0.125 |
0.8 |
0.531 |
0.528 |
0.56497 |
|
3 |
450 |
0.125 |
1.0 |
0.532 |
0.53 |
0.37593 |
|
4 |
450 |
0.16 |
0.6 |
0.65 |
0.649 |
0.15384 |
|
5 |
450 |
0.16 |
0.8 |
0.362 |
0.36 |
0.55248 |
|
6 |
450 |
0.16 |
1.0 |
0.633 |
0.629 |
0.63191 |
|
7 |
450 |
0.20 |
0.6 |
0.75 |
0.749 |
0.13333 |
|
8 |
450 |
0.20 |
0.8 |
0.242 |
0.24 |
0.82644 |
|
9 |
660 |
0.20 |
1.0 |
0.135 |
0.133 |
1.48148 |
|
10 |
660 |
0.125 |
0.6 |
0.432 |
0.429 |
0.69444 |
|
11 |
660 |
0.125 |
0.8 |
0.321 |
0.314 |
2.18068 |
|
12 |
660 |
0.125 |
1.0 |
0.272 |
0.261 |
4.04411 |
|
13 |
660 |
0.16 |
0.6 |
0.481 |
0.471 |
2.07900 |
|
14 |
660 |
0.16 |
0.8 |
0.477 |
0.453 |
5.03144 |
|
15 |
660 |
0.16 |
1.0 |
0.498 |
0.481 |
3.41365 |
|
16 |
660 |
0.20 |
0.6 |
0.278 |
0.272 |
2.15827 |
|
17 |
660 |
0.20 |
0.8 |
0.263 |
0.261 |
0.76045 |
|
18 |
660 |
0.20 |
1.0 |
0.252 |
0.249 |
1.19047 |
|
19 |
900 |
0.125 |
0.6 |
0.284 |
0.282 |
0.70422 |
|
20 |
900 |
0.125 |
0.8 |
0.267 |
0.262 |
1.87265 |
|
21 |
900 |
0.125 |
1.0 |
0.281 |
0.272 |
3.20284 |
|
22 |
900 |
0.16 |
0.6 |
0.292 |
0.29 |
0.68493 |
|
23 |
900 |
0.16 |
0.8 |
0.874 |
0.871 |
0.34324 |
|
24 |
900 |
0.16 |
1.0 |
0.574 |
0.572 |
0.34843 |
|
25 |
900 |
0.20 |
0.6 |
0.972 |
0.97 |
0.20576 |
|
26 |
900 |
0.20 |
0.8 |
0.43 |
0.4296 |
0.23255 |
|
27 |
900 |
0.20 |
1.0 |
0.363 |
0.361 |
0.55096 |
For each experimental trial, researchers estimated flank wear width (VB). With FlankPix analysis, captured images are processed. The image processing system known as FlankPix could precisely estimate the amount of flank wear. Unlike previous measuring systems, this one does not require a separate calibration of the visual system. This method is highly accurate for assessing flank wear width, with an average error rate of 1.29% compared to its existing counterparts.
The comparison in Table 3 focuses on the average prediction error as a key metric to evaluate the effectiveness of FlankPix in estimating tool wear compared to conventional methods such as the Tool Maker's Microscope and other established techniques.
Table 3. Flank wear measurement comparison of FlankPix algorithm with conventional techniques
|
Method |
Average Prediction Error |
|
FlankPix (Proposed) |
1.29% |
|
Functional Data Analysis [29] |
1.9% |
|
FlankNet [30] |
3.03% |
|
CUSUM Algorithm [31] |
2.5% |
The FlankPix algorithm, while innovative, exhibits limitations that warrant consideration. Sensitivity to image quality variations, reliance on specific parameter settings, potential computational demands, and adaptability challenges across diverse machining conditions are primary concerns. Furthermore, its performance may rely heavily on the initial image quality, risking accuracy with poor inputs, and potential overfitting issues could restrict generalizability. Addressing these limitations is crucial for refining the algorithm's robustness and applicability in diverse industrial settings.
The industrial sector will find this approach of measuring tools wear much more helpful than using a single metric. The Edge Detection Method was developed to measure the amount of wear on the Cubic Boron Nitride insert used to turn Monel K500. It is essential to preserve the integrity of the machined surface and keep tool wear to a minimum.
The subsequent findings are given below:
Compared to the standard way of evaluating flank wear using a toolmaker's microscope, the flank wear measured with FlankPix yielded greater accuracy, with an average percentage of 1.29 percent. FlankPix algorithm's applications in precision tool wear measurement across aerospace, manufacturing, defense, and medical sectors.
Some potential limitations include susceptibility to image quality variations, sensitivity to lighting conditions, challenges with complex tool geometries, and the need for further validation in diverse industrial settings to confirm its generalizability and performance under varying conditions. Improvements for FlankPix could involve refining the algorithm, integrating advanced technologies like AI, ensuring robustness across varied conditions, validating in different industries, and developing methodologies for quantifying tool life, enhancing its reliability and wider applicability.
|
V |
Cutting speed |
|
S |
Feed rate |
|
D |
Depth of cut |
|
M |
Experimental value of Flank wear |
|
P |
Predicted value using FlankPix method |
[1] Danesh, M., Khalili, K. (2015). Determination of tool wear in turning process using undecimated wavelet transform and textural features. Procedia Technology, 19: 98-105. http://doi.org/10.1016/j.protcy.2015.02.015
[2] Yu, X., Lin, X., Dai, Y., Zhu, K. (2017). Image edge detection based tool condition monitoring with morphological component analysis. ISA transactions, 69: 315-322. http://doi.org/10.1016/j.isatra.2017.03.024
[3] Ning, Q., Wang, T.Y. (2012). Morphological filtering algorithm for estimation of tool wear in CNC milling machining. In Materials Science Forum, 697: 566-569. http://doi.org/10.4028/www.scientific.net/msf.697-698.566
[4] Sud, D., Singla, A.K., Gupta, M.K. (2022). Nanomaterials in Manufacturing Processes. CRC Press.
[5] Mishra, S.K., Ghosh, S., Aravindan, S. (2020). Temporal and spatial crater wear prediction of WC/Co tools during dry turning of Ti6Al4V alloy. Wear, 448: 203229. http://doi.org/10.1016/j.wear.2020.203229
[6] Xiong, G., Liu, J., Avila, A. (2011). Cutting tool wear measurement by using active contour model based image processing. In 2011 IEEE International Conference on Mechatronics and Automation, Beijing, China, pp. 670-675. http://doi.org/10.1109/icma.2011.5985741
[7] Liu, J.C., Xiong, G.X. (2014). Study on Volumetric tool wear measurement using image processing. Applied Mechanics and Materials, 670: 1194-1199. http://doi.org/10.4028/www.scientific.net/amm.670-671.1194
[8] García-Ordás, M.T., Alegre-Gutiérrez, E., Alaiz-Rodríguez, R., González-Castro, V. (2018). Tool wear monitoring using an online, automatic and low cost system based on local texture. Mechanical Systems and Signal Processing, 112: 98-112. http://doi.org/10.1016/j.ymssp.2018.04.035
[9] Peng, R., Pang, H., Jiang, H., Hu, Y. (2020). Study of tool wear monitoring using machine vision. Automatic Control and Computer Sciences, 54(3): 259-270. http://doi.org/10.3103/s0146411620030062
[10] de Cos Juez, F.J., Villar, J.R., de la Cal, E.A., Herrero, Á., Quintián, H., Sáez, J.A., Corchado, E. (2018). Hybrid Artificial Intelligent Systems. Springer Cham. https://doi.org/10.1007/978-3-319-92639-1
[11] Urbicain, G., Trejo, D.O. (2021). Machining dynamics and parameters process optimization. Applied Sciences. https://doi.org/10.3390/books978-3-0365-0295-3
[12] Kuntoğlu, M., Sağlam, H. (2021). ANOVA and fuzzy rule based evaluation and estimation of flank wear, temperature and acoustic emission in turning. CIRP Journal of Manufacturing Science and Technology, 35: 589-603. http://doi.org/10.1016/j.cirpj.2021.07.011
[13] Yang, J., Duan, J., Li, T., Hu, C., Liang, J., Shi, T. (2022). Tool wear monitoring in milling based on fine-grained image classification of machined surface images. Sensors, 22(21): 8416. http://doi.org/10.3390/s22218416
[14] Das, S.R., Panda, A., Dhupal, D. (2017). Experimental investigation of surface roughness, flank wear, chip morphology and cost estimation during machining of hardened AISI 4340 steel with coated carbide insert. Mechanics of Advanced Materials and Modern Processes, 3: 9. http://doi.org/10.1186/s40759-017-0025-1
[15] Niaki, F.A., Ulutan, D., Mears, L. (2015). In-process tool flank wear estimation in machining gamma-prime strengthened alloys using Kalman filter. Procedia Manufacturing, 1: 696-707. http://doi.org/10.1016/j.promfg.2015.09.018
[16] Li, X., Rashidi, M.M., Lather, R.S., Raman, R. (Eds.). (2023). Emerging Trends in Mechanical and Industrial Engineering: Select Proceedings of ICETMIE 2022. Springer. https://doi.org/10.1007/978-981-19-6945-4
[17] Sengupta, S., Mittal, N., Modi, M. (2020). Improved skin lesions detection using color space and artificial intelligence techniques. Journal of Dermatological Treatment, 31(5): 511-518. http://doi.org/10.1080/09546634.2019.1708239
[18] Bagga, P.J., Makhesana, M.A., Patel, K., Patel, K.M. (2021). Tool wear monitoring in turning using image processing techniques. Materials Today: Proceedings, 44: 771-775. http://doi.org/10.1016/j.matpr.2020.10.680
[19] Moldovan, O.G., Dzitac, S., Moga, I., Vesselenyi, T., Dzitac, I. (2017). Tool-wear analysis using image processing of the tool flank. Symmetry, 9(12): 296. http://doi.org/10.3390/sym9120296
[20] Santosh, K.C., Hegadi, R.S. (2018). Recent trends in image processing and pattern recognition. In Second International Conference, RTIP2R 2018, Solapur, India. https://doi.org/10.1007/978-981-13-9187-3
[21] Pal, S.K., Mishra, D., Pal, A., Dutta, S., Chakravarty, D., Pal, S. (2022). Digital Twin-Fundamental Concepts to Applications in Advanced Manufacturing. Berlin/Heidelberg, Germany: Springer. http://doi.org/10.1007/978-3-030-81815-9
[22] Pan, L., Kwok, C.T., Lo, K.H. (2022). Microstructural characteristics and hardness enhancement of super duplex stainless steel by friction stir processing. Materials, 15(18): 6267. http://doi.org/10.3390/ma15186267
[23] Herzog, C., Wolf, M., Drummer, D. (2022). In situ measured tooth flank wear of plastic gears under spectrum loading. Polymers, 14(23): 5239. http://doi.org/10.3390/polym14235239
[24] Sommer, D., Pape, D., Esen, C., Hellmann, R. (2022). Tool wear and milling characteristics for hybrid additive manufacturing combining laser powder bed fusion and in situ high-speed milling. Materials, 15(3): 1236. http://doi.org/10.3390/ma15031236
[25] Chowdhury, M.S.I., Bose, B., Fox-Rabinovich, G., Veldhuis, S.C. (2021). Investigation of the wear performance of TiB2 coated cutting tools during the machining of Ti6Al4V alloy. Materials, 14(11): 2799. http://doi.org/10.3390/ma14112799
[26] Gao, S., Duan, X., Zhu, K., Zhang, Y. (2022). Generic cutting force modeling with comprehensively considering tool edge radius, tool flank wear and tool runout in micro-end milling. Micromachines, 13(11): 1805. http://doi.org/10.3390/mi13111805
[27] Francis Xavier, J., Ravi, B., Jayabalakrishnan, D., Ezilarasan, C., Jayaseelan, V., Elias, G. (2021). Experimental study on surface roughness and flank wear in turning of Nimonic C263 under dry cutting conditions. Journal of Nanomaterials, 2021: 2054399. http://doi.org/10.1155/2021/2054399
[28] Rajmohan, T., Palanikumar, K., Davim, J.P. (2021). Advances in Materials and Manufacturing Engineering. Springer Singapore. https://doi.org/10.1007/978-981-15-6267-9
[29] Jozić, S., Lela, B., Bajić, D. (2014). A new mathematical model for flank wear prediction using functional data analysis methodology. Advances in Materials Science and Engineering, 2014: 138168. https://doi.org/10.1155/2014/138168
[30] Bommi, R.M., Ezilarasan, C., Sudeshkumar, M.P., Vinoth, T. (2022). Estimation of flank wear in turning of nimonic C263 super alloy based on novel MSER algorithm and deep patten network. Russian Journal of Nondestructive Testing, 58(2): 140-156. http://doi.org/10.1134/s1061830922020073
[31] Shi, X., Wang, X., Jiao, L., Wang, Z., Yan, P., Gao, S. (2018). A real-time tool failure monitoring system based on cutting force analysis. The International Journal of Advanced Manufacturing Technology, 95: 2567-2583. https://doi.org/10.1007/s00170-017-1244-7