Arpit Deo*![]() | Ish Pandey
| Ish Pandey![]() | Safdar Sardar Khan
| Safdar Sardar Khan![]() | Aditi Mandlik
| Aditi Mandlik![]() | Nitika Vats Doohan
| Nitika Vats Doohan![]() | Bhupendra Panchal
| Bhupendra Panchal![]()
© 2024 The authors. This article is published by IIETA and is licensed under the CC BY 4.0 license (http://creativecommons.org/licenses/by/4.0/).
OPEN ACCESS
A mutation in the beta-globin gene results in the blood condition known as Sickle cell anemia. It is estimated that number of individuals affected by sickle cell anemia worldwide exceeded 20 million and 250 million individuals globally bear the gene accountable for sickle cell disease and other hemoglobinopathies. SCA is characterized by aberrant red blood cells with a crescent form that can obstruct blood arteries and result in a number of health issues. Manual detection of SCA is time-consuming and costly. The goal of this study is to increase the efficiency and precision of sickle cell anemia detection by employing deep learning techniques on microscopic blood cell images, which can result in early identification and better patient care by employing deep learning techniques on microscopic blood cell images. Data augmentation techniques are applied to expand the dataset and enhance the model's performance. Otsu thresholding followed by watershed segmentation and region-based segmentation is performed for image processing. We have employed Extreme Learning Machine (ELM), a pretrained CNN InceptionV3 architecture, and a hybridized model of CNN + LSTM for classifying images into circular, elongated, and other categories. This amalgamated architecture facilitates deep feature extraction through CNN and detection via the extracted features using LSTM. The proposed hybridized model exhibits superior performance and accuracy which surpasses the results achieved by alternative approaches, making it a reliable tool for early SCA detection and improved patient care.
sickle cell anemia, machine learning, deep learning, CNN, LSTM, blood disorder, image classification, microscopy images
Sickle cell anemia is an inherited blood condition that impairs hemoglobin structure and function [1]. A mutation in the HBB gene is the root cause of SCA. This mutation results in the production of abnormal hemoglobin known as Hemoglobin S [2]. Hemoglobin S tends to form rigid, abnormal red blood cells rather than the typical disc-shaped cells [3, 4]. Sickle cells have a drastically shorter life expectancy of just 10 to 20 days compared to normal RBCs, which have a life expectancy of 120 days. The sub-Saharan region of Africa has the highest prevalence, although people of Middle Eastern, Indian, and Mediterranean origin are also susceptible to it [5]. Each year, there are around 300,000 infants with sickle cell disease globally and 5% of the world's population has the traits of sickle cells [6, 7]. Sickle cells have the potential to clog blood vessels, which would limit blood flow, harm tissue, and cause discomfort [8]. Depending on the severity of the condition, sickle cell anemia can cause a variety of moderate to severe symptoms, such as anemia, lethargy [9], jaundice, pain crises, delayed growth and development, eyesight issues, and an increased susceptibility to infections [10]. Complications of sickle cell anemia can affect multiple organ systems and include stroke, acute chest syndrome [11, 12], pulmonary hypertension [13] and kidney damage [14]. Manual detection of sickle cell anemia is not efficient as it is time consuming, requires skilled personnel, it is not cost effective and difficult to detect where resources are limited therefore in this paper image classification technique is used to overcome these barriers by classifying the microscopic blood images. Image preprocessing is done by applying filtration and segmentation techniques such as watershed segmentation [15], region based segmentation and then a comparative study of different deep learning models is done as deep learning is efficient for image classification it can detect complex pattern and relationship in data which may be difficult to identify with machine learning models. We have used ELM, CNN inception v3 and a combine CNN- LSTM model to classify the microscopic blood images into circular, elongated and others.
An overview of various studies to diagnose sickle cell anemia using various techniques which includes image-based classification is presented. In 1910, Dr. James B. Herrick's gave the first explanation on SCA in the published literature of sickle cell disease [16]. To distinguish between circular and elongated blood cells in a processed picture, Otsu thresholding with watershed segmentation are performed. RF, logistic regression, support vector machines, and naive bayes are then applied, with random forest producing the best results with an accuracy of 92% [17]. Fuzzy c means was applied, extracted geometrical and statistical features were used after to train and compare KNN, SVM and ELM where ELM was superior with 87.7% of accuracy, 83.33% specificity and 87.5% sensitivity as proposed by Chy and Rahaman [18]. Otsu thresholding followed by gaussian and canny filter to enhance the image for classification using gradient boost and random forest classifier with SDS-score of 95.6% and 94.4%which performed better than previous models by selecting the best parameters using randomized and grid search [19]. Data augmentation was used to minimize overfitting where the model plus a multiclass SVM classifier attains highest accuracy [20]. When it comes to accuracy and processing time, Niblack's methodology outperforms other techniques of adaptive thresholding with 95.4% accuracy and 1.73 seconds of processing time [21]. The amalgamation of fuzzy C-means and NICK's thresholding with KNN classifier was the most effective, according to Patgiri and Ganguly [22]. Distinct adaptive thresholding methods are tested together with fuzzy C-means, Naive Bayes and KNN classifier. Machine learning models were outperformed by MLP, a sort of feedforward neural network with many layers of neurons [23]. Faster R-CNN was implemented to detect RBCs, WBCs and Platelets which achieved greater accuracy in detecting objects more effectively [24]. For classification, Soni et al. [25] proposed equipped AlexNet model transfer learning, including model evaluation utilizing data division algorithms. Deep neural network in which augmented images are fed to a deep CNN model utilizing pre-trained models such as VGG16, VGG19, ResNet50, ResNet101, and InceptionV3, among which InceptionV3 yielded the highest accuracy of 91% [26]. Seven CNN-based hybrid image classification techniques—CNN with ELM, KNN, GA, MLP, SVM, RNN, and LSTM—were compared to determine which was the most accurate [27]. CNN-LSTM performed better. Integration of CNN-LSTM utilized for feature extraction and the latter for feature-based classification [28]. CNN model and a RCNN are two recent techniques that are compared and combined in video analysis to categorize cell motion [29]. Our research paper introduces a hybrid model, yielding superior results as CNNs and its architectures have been separately explored, their integration in this domain remains unexplored.
3.1 Image acquisition
The image dataset used in this research was acquired from a local hospital and is part of confidential patient records. The dataset consists of 260 microscopic colored blood cell images taken in JPG format. The images consist of normal RBC’s and abnormal RBC’s like sickle cell and others.
3.2 Data augmentation
By generating extra training samples from the original data, a technique known as data augmentation is used to artificially enhance the size of a dataset. It prevents overfitting, can help in improving the performance and generalization of a model [20]. The rotation angles of images are 0, 90, 180 and 270, part of dataset is flipped horizontally and vertically and a scaling factor between 0.8 and 1.2 is applied to introduce variations in image size.
3.3 Image preprocessing
Image preprocessing is used to enhance the quality microscopic blood images and prepare images for subsequent processing steps. To minimize complexity and dimensionality, as well as to remove high frequency noise, the picture is first converted to grayscale using a mean filter given as:
$W_{i, j}=\frac{1}{n^2} \sum_{x=-(n-1) / 2}^{(n-1) / 2} \sum_{y=-(n-1) / 2}^{(n-1) / 2} Z_{i+x, j+y}$ (1)
where, W is the input gray image, Z is the output image, and n is the size of the kernel. The resulting value represents the average intensity of the neighborhood surrounding the pixel at position (i, j).
Followed by a median filter to smooth the image. The Gaussian filter is applied to remove noise while preserving edges given as:
$Z_{i, j}=\frac{1}{N} \sum_{x=-(n-1) / 2}^{(n-1) / 2} \sum_{y=-(n-1) / 2}^{(n-1) / 2} W_{i+x, j+y} * G_{x, y}$ (2)
where, W is the input image, Z is the output image, K is the normalization factor, n is the size of the Gaussian kernel, and G is the Gaussian kernel given below:
$G_{x, y}=\frac{1}{2 \pi \sigma^2} e^{-\frac{x^2+y^2}{2 \sigma^2}}$ (3)
where, x and y are the distances from the center of the kernel, the Gaussian distribution's standard deviation is denoted by the sigma, π is the mathematical constant, and e is the base of the natural logarithm.
Finally, to locate the cell borders, the Canny edge filter is used.
3.4 Segmentation
Segmentation is a technique used to separate items of use from the background of a picture. First, Otsu thresholding is applied given by Eq. (4):
$\sigma_w^2(t)=w_0(t) \cdot w_1(t) \cdot\left[\mu_0(t)-\mu_1(t)\right]^2$ (4)
The variance for a particular threshold value "t" is denoted by the symbol $\sigma_w^2$. The likelihood of a pixel falling into the background class for threshold "t" is calculated as the proportion of pixels with intensity levels below "t" to all of the pixels in the picture, and is denoted by the formula w0(t).
The likelihood of a pixel falling into the foreground class for threshold "t" is expressed as w1(t)which is calculated as the ratio of pixels with intensity values greater than or equal to "t" to all pixels in the picture. The average intensity value of the background class pixels given threshold "t" is represented by the formula μ0(t). The average intensity value of the foreground class pixels given threshold "t" is μ1(t).
Following this, Watershed segmentation was then applied to refine the segmented regions and separate objects that were touching or overlapping. Finally, more attributes were extracted from the segmented sections using region-based segmentation, such as texture, shape, or size. This combination of techniques resulted in accurate and robust segmentation of blood cells in the images.
3.5 Morphological operations
Morphological operations are applied to enhance features and improve the segmentation process. To extract critical information from the images, we performed dilation and closing to fill gaps and holes of the object, erosion and opening is done to remove small objects and smooth out the boundaries.
3.6 Feature extraction
We did feature extraction to obtaining meaningful information from processed image dataset as given in Figure 1.
Figure 1. Block diagram of methodology
Metric Value: It represents the total number of pixels found inside the area that is relevant (ROI). Mathematically, Metric Value can be represented as follows:
$MetricVal = Number of pixel sin ROI$ (5)
Circularity: It measures the roundness of the object. A normal RBC has a circularity of 1, while an abnormal RBC like sickle cell and others has a circularity inclining towards 0. Mathematically, Circularity can be calculated as:
$Circularity=\frac{4\cdot \pi \cdot Area}{Perimete{{r}^{2}}}$ (6)
Standard Deviation: It measures the degree of variation of the pixel values within the region of interest. Mathematically, Standard Deviation can be calculated as:
$\sigma=\sqrt{\frac{1}{N} \sum_{i=1}^N\left(x_i-\mu\right)^2}$ (7)
Aspect Ratio: The aspect ratio is calculated by dividing the vertical axis length by the horizontal axis length. Following are the mathematical steps to determine the aspect ratio:
Aspect Ratio $=\frac{\text { Width }}{\text { Height }}$ (8)
Eccentricity: It is the measure of how much an object deviates from a perfect circle. Mathematically, Eccentricity can be calculated as:
Eccentricity $=\sqrt{1-\left(\frac{\text { minor axis }}{\text { major axis }}\right)^2}$ (9)
Variance: It measures the degree of spread of the pixel values within the region of interest. Mathematically, Variance can be calculated as:
Variance $=\frac{\sum_{i=1}^n\left(x_i-\mu\right)^2}{n}$ (10)
Entropy: It measures the randomness or uncertainty of the pixel intensity distribution within the region of interest. Mathematically, Entropy can be calculated as:
Entropy $=-\sum_{i=1}^n p_i \log \log \left(p_i\right)$ (11)
Energy: It measures the sum of the squared pixel values within the region of interest. Mathematically, Energy can be calculated as:
Energy $=\sum_{i=1}^n p_i^2$ (12)
Kurtosis: It measures the degree of peakedness of the pixel intensity distribution within the region of interest. Mathematically, Kurtosis can be calculated as:
Kurtosis $=\frac{\sum_{i=1}^n:\left(x_i-\underline{x}\right)^4 \cdot p_i}{\sigma^4}$ (13)
Skewness: It measures the degree of asymmetry of the pixel intensity distribution within the region of interest. Mathematically, Skewness can be calculated as:
Skewness $=\frac{\sum_{i=1}^n\left(x_i-\underline{x}\right)^3 \cdot p_i}{\sigma^3}$ (14)
These features are used to train and evaluate ELM classifier used for sickle cell detection.
3.7 Classifiers
3.7.1 ELM
It is a simple, highly computational efficient single-hidden-layer feedforward neural network [30]. Its output weights are solved using a closed-form method, and its input weights are initialized randomly. As opposed to advanced algorithms for machine learning like KNN and SVM, ELM has been demonstrated to perform better in the identification of SCA using microscopic blood images [18]. Its efficient due to simplicity in architecture and faster training time, although it does not leverage the intricate hierarchical features captured by deeper architectures.
3.7.2 CNN InceptionV3
A CNN architecture called Inception-V3 is used to classify images due to its efficient feature extraction, parallel processing, and better accuracy [31]. Convolutional, pooling, and activation layers are included in its 48 total layers. Additionally, it has Inception modules, which combine 1x1, 3x3, and 5x5 convolutions with pooling and concatenation processes to capture intricate hierarchical patterns. The network can extract features using these modules at various sizes and resolutions. Here, batch normalization and regularization are used to enhance performance while preventing overfitting.
3.7.3 CNN – LSTM hybridization
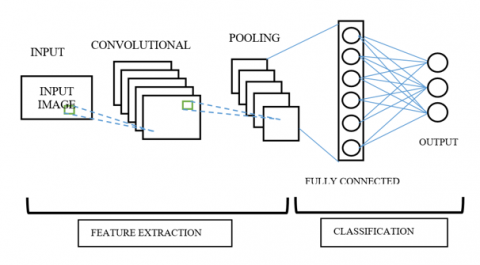
In Figure 2, Convolutional neural network (CNN) is a type of deep neural network that includes convolutional layers, pooling layers, and fully connected layers [32] that work together to get important characteristics from the input data and categorize the data as circular elongated and other shapes. It also uses filters [33] or kernels for extraction of specific features:
Figure 2. CNN architecture
$y_{p, q}=f\left(\sum_{m=0}^{M-1} \sum_{n=0}^{N-1} x_{p+i, q+j} \cdot w_{i, j}+b\right)$ (15)
where, in Eq. (15) yp,q is the output activation at location (p, q) in the feature map, f being the activation function (ReLU is used), xp+i, q+j being the input activation at position (p+i, q+j) in input feature map, wi,j is the weight (or kernel) applied to input feature map, b is the bias term.
The feature maps created by the convolutional layers are down sampled by pooling layers to decrease their spatial dimensionality [34]. Convolutional and pooling layers' feature maps are then used by fully connected layers to categorize the input picture [35].
Long Short-Term Memory (LSTM) is a form of recurrent neural network (RNN) shown in Figure 3 and is intended to address the issue of vanishing gradients in conventional RNNs [36]. A memory cell is used by LSTMs to store data over time [37], and the input gate, output gate, and forget gate being the three gates that regulate how data enters and leaves the memory cell. Each time a time step is taken, the input gate Eq. (16) chooses which data should be stored in the memory cell. The values that come from this process are then transferred via a tan activation function, which creates the new candidate cell state.
$i_t=\sigma\left(W_{x i} x_t+W_{h i} h_{t-1}+b_i\right)$ (16)
Figure 3. LSTM architecture
The memory cell state is obtained by subtracting the result from the memory cell state as determined by the forget gate Eq. (17) for each time step in order to produce the new cell state.
$f_t=\sigma\left(W_{x f} x_t+W_{h f} h_{t-1}+b_f\right)$ (17)
A tanh activation function Eq. (19) is applied to the values once the output gate Eq. (18) has determined which data should be output from the memory cell at each time step.
$o_t=\sigma\left(W_{x o} x_t+W_{h o} h_{t-1}+b_o\right)$ (18)
$\begin{aligned} c_t=f_t * c_{t-1}+ & i_t * \tanh \tanh \left(W_{x c} x_t+W_{h c} h_{t-1}\right. \left.+b_c\right)\end{aligned}$ (19)
which output gate multiplies to create the new hidden state Eq. (20).
$h_t=o_t * \tanh \tanh \left(c_t\right)$ (20)
where, xt is the input at time step t, ht is the hidden state output at time step t, ct is the cell state at time step t, * represents element-wise multiplication, and W and b are the weight matrices and bias vectors that will be learned during training. $\sigma$ is the sigmoid activation function.
CNN-LSTM: CNN and LSTM networks are combined to create hybrid architecture it is advantageous for sickle cell anemia detection by effectively combining spatial and temporal information, recognizing sequential patterns, and creating robust feature representations critical for accurate image classification. The architecture blends the LSTM's temporal modelling skills with CNNs’ feature extraction capabilities. The LSTM classifier is used to model the temporal connections between frames and arrive at a final prediction. Each frame of the input sequence is processed by the CNN feature extraction algorithm to extract pertinent features. The CNN feature extractor uses a convolutional layer with 32 filters each, kernels of size 3x3 and is triggered by the ReLU activation function. It then uses 10 convolutional and 5 pooling layers, followed by one fully connected layer. For the final classification into circular, elongated, and other shapes, the LSTM network consists of one LSTM layer with 64 units, followed by one fully linked layer, as illustrated in Figure 4. Further hyperparameter tuning is done where learning rate is 0.001 and dropout rate 0.3 for regularization. Backpropagation through time (BPTT) jointly train the CNN-LSTM components in order to enhance the hybrid architecture's overall performance. Modern findings in image classification to identify sickle cell anemia have been attained using the CNN-LSTM hybrid architecture.
Figure 4. CNN + LSTM
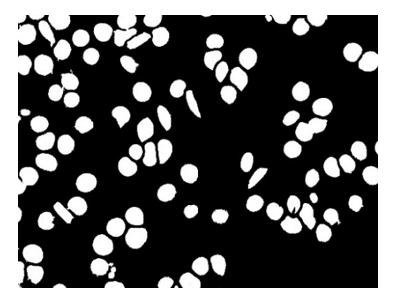
The dataset employed in this study consists of 750 microscopic blood pictures, of which 80-20 ratio is maintained train test split respectively. To enhance the dataset size and improve performance, image augmentation is used. In image Figure 5 preprocessing images are converted from RGB to grey scale after that mean, median and gaussian filter is applied to obtain processed image. Figure 6 processed images are then passed through segmentation step where otsu thresholding in Figures 7 and 8, watershed segmentation, region-based segmentation images several morphological operations are done. Table 1 gives the result of feature extraction.
Figure 5. Original image
Figure 6. Processed image
Figure 7. Binary image
Figure 8. Image after segmentation, noise removal and filling holes using morphological
Table 1. Feature extraction
|
Features |
Normal Blood Cells (Circular) |
Sickle Cell (Elongated) |
Other |
|
Metric value |
1.197 |
0.503 |
0.809 |
|
Standard Deviation |
0.391 |
0.314 |
0.443 |
|
Aspect Ratio |
1.335 |
5.893 |
4.223 |
|
Eccentricity |
0.396 |
0.904 |
0.677 |
|
Variance |
0.128 |
0.109 |
0.192 |
|
Entropy |
0.598 |
0.937 |
0.707 |
|
Kurtosis |
1.551 |
4.835 |
3.162 |
|
Skewness |
1.991 |
0.642 |
1.399 |
Refined pictures with relevant features are then input into ELM, InceptionV3, and CNN-LSTM where accuracy, precision, F1 score and recall of the above techniques are reported based on TP, TN, FP, and FN results. Tables 2-4 are examples.
Table 2. ELM
|
Class |
Accuracy |
Precision |
Recall |
F1 Score |
|
Circular |
92.8% |
0.88 |
0.90 |
0.89 |
|
Elongated |
91.6% |
0.88 |
0.87 |
0.87 |
|
Others |
90.8% |
0.86 |
0.86 |
0.86 |
Table 3. Inception V3
|
Class |
Accuracy |
Precision |
Recall |
F1 Score |
|
Circular |
92.93% |
0.90 |
0.89 |
0.89 |
|
Elongated |
93.47% |
0.90 |
0.90 |
0.90 |
|
Others |
92.00% |
0.88 |
0.88 |
0.88 |
Table 4. CNN – LSTM
|
Class |
Accuracy |
Precision |
Recall |
F1 Score |
|
Circular |
95.73% |
0.94 |
0.93 |
0.93 |
|
Elongated |
94.67% |
0.92 |
0.92 |
0.92 |
|
Others |
94.93% |
0.92 |
0.93 |
0.92 |
In Figures 9-11, confusion matrix of ELM, InceptionV3 and CNN+LSTM are depicted where true positive refers to correct detection of sickle cell, TN refers correct detection of normal cell, FP refers to incorrect detection of normal cell and FN refers to incorrect detection sickle cell as CNN+LSTM model has consistent TP and TN values and less FP and FN values which indicates that CNN+LSTM outperforms InceptionV3 and ELM.
Figure 9. Confusion matrix of ELM
Figure 10. Confusion matrix of Inception V3
Figure 11. Confusion matrix of CNN - LSTM
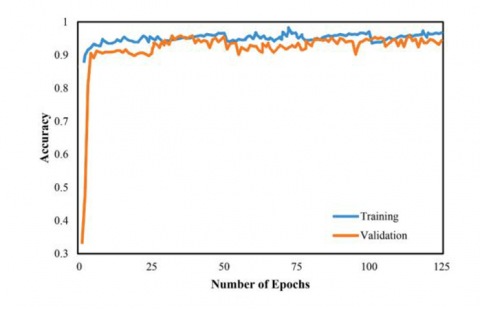
Figure 12. Accuracy of CNN-LSTM architecture
Figure 13. Loss of CNN-LSTM architecture
In Figures 12 and 13 graphical representation of accuracy and cross-entropy (loss) with respect to number of epochs is depicted to monitor the performance of CNN+LSTM model where number of epochs is 125. CNN+LSTM has 95.56% of training accuracy and 91.85% validation accuracy whereas 0.08 and 0.26 is training loss and validation loss, respectively.
ELM has less accuracy compared to InceptionV3 andInceptionV3 has less accuracy than CNN+LSTM architecture. CNN+LSTM provides better results in detection of sickle cell comparative to other mentioned models used in this paper given in Table 5.
Table 5. Comparison of overall accuracy
|
Model |
Overall Accuracy |
|
CNN + LSTM |
92.667% |
|
CNN InceptionV3 |
90.133% |
|
ELM |
87.601% |
Hemoglobin molecules are produced abnormally as a result of the genetically transmitted blood disorder known as sickle cell anemia. In order to avert serious health issues our research focuses on faster and more accurate identification of sickle cell anemia using image classification using deep learning techniques. Expansion of data set is done using data augmentation to prevent overfitting. Different deep learning models like ELM, InceptionV3 and CNN+LSTM are used to classify images into circular, elongated and others. Early detection is crucial for timely intervention and management of the condition. Our research shows that the hybrid CNN and LSTM excelled the others, achieving the highest accuracy of 92.66%, when compared to ELM and InceptionV3.This implies that the performance of deep neural networks for the classification of sickle cell anemia in images can be improved by integrating CNN and LSTM components. This helps in accurate and early detection of sickle cell anemia through image classification which contribute to improved patient outcomes and more efficient healthcare processes.
In this section, we list a few prospective areas for further study and advancement, expansion of data to include more diverse set of patients and to evaluate the generalizability of our models to other populations. For better detection of echinocytes optimization of hyperparameter can be done and exploration of different deep learning architecture with ensembling techniques can be performed. Furthermore, the study can be expanded by recommending the optimal treatment on the basis of diagnosis of severity of sickle cell anemia obtained through diagnosis of SCA which may include blood transfusions, dosage of hydroxyurea to reduce pain and inflammation and bone marrow or stem cell transplants in severe cases.
[1] Sharma, V., Rathore, A., Vyas, G. (2016). Detection of sickle cell anaemia and thalassaemia causing abnormalities in thin smear of human blood sample using image processing. In 2016 International Conference on Inventive Computation Technologies (ICICT), Coimbatore, India, pp. 1-5. https://doi.org/10.1109/INVENTIVE.2016.7830136
[2] Odigwe, B.E., Eyitayo, J.S., Odigwe, C.I., Valafar, H. (2019). Modelling of sickle cell anemia patients response to hydroxyurea using artificial neural networks. arXiv preprint arXiv:1911.10978. https://arxiv.org/abs/1911.10978
[3] Singh, B.K., Thakkar, H. (2021). Hydroxyurea dosage classification for sickle cell disease patients. In 2021 6th International Conference on Inventive Computation Technologies (ICICT), Coimbatore, India, pp. 1289-1292. https://doi.org/10.1109/ICICT50816.2021.9358788
[4] Adio, W.S., Christopher, F.C., Adesola, R.O., Mary, F.I. (2022). Current trends in the treatment of sickle cell anemia. World News of Natural Sciences, 43: 60-75.
[5] Petrović, N., Moyà-Alcover, G., Jaume-i-Capó, A., González-Hidalgo, M. (2020). Sickle-cell disease diagnosis support selecting the most appropriate machine learning method: Towards a general and interpretable approach for cell morphology analysis from microscopy images. Computers in Biology and Medicine, 126: 104027. https://doi.org/10.1016/j.compbiomed.2020.104027
[6] Omogbadegun, Z., Ogundele, I., Oladipupo, O. (2019). Applying neural network-based approach to sickle cell disease-related pain classification. Journal of Computer Science, 15(6): 861-872. https://doi.org/10.3844/jcssp.2019.861.872
[7] Centers for Disease Control and Prevention. (2016). Data & Statistics on Sickle Cell Disease.
[8] Rios, J.D.O., Ribeiro, T.F., Bertochi, G.F.A., Lobo, C.P.D.C., Domingos, C.R.B. (2022). The severity of sickle cell anemia in men - The action of molecular and biochemical markers. International Journal of Blood Research and Disorders, 9(1): 077. https://doi.org/10.23937/2469-5696/1410077
[9] Glassberg, J. (2011). Evidence-based management of sickle cell disease in the emergency department. Emergency Medicine Practice, 13(8): 1-20.
[10] Yawn, B.P., Buchanan, G.R., Afenyi-Annan, A.N., et al. (2014). Management of sickle cell disease: Summary of the 2014 evidence-based report by expert panel members. Jama, 312(10): 1033-1048. https://doi.org/10.1001/jama.2014.10517
[11] Mekontso Dessap, A., Leon, R., Habibi, A., Nzouakou, R., Roudot-Thoraval, F., Adnot, S., Godeau, B., Galacteros, F., Brun-Buisson, C., Brochard, L., Maitre, B. (2008). Pulmonary hypertension and cor pulmonale during severe acute chest syndrome in sickle cell disease. American Journal of Respiratory and Critical Care Medicine, 177(6): 646-653. https://doi.org/10.1164/rccm.200710-1606OC
[12] Paul, R.N., Castro, O.L., Aggarwal, A., Oneal, P.A. (2011). Acute chest syndrome: Sickle cell disease. European Journal of Haematology, 87(3): 191-207. https://doi.org/10.1111/j.1600-0609.2011.01647.x.
[13] Caughey, M.C., Poole, C., Ataga, K.I., Hinderliter, A.L. (2015). Estimated pulmonary artery systolic pressure and sickle cell disease: A meta-analysis and systematic review. British Journal of Haematology, 170(3): 416-424. https://doi.org/10.1111/bjh.13447
[14] Güntürkün, F., Chen, D., Akbilgic, O., Davis, R.L., Karabayir, I., Strome, M., Dai, Y., Saraf, S.L., Ataga, K.I. (2021). Using machine learning to predict rapid decline of kidney function in sickle cell anemia. EJHaem, 2(2): 257-260. https://doi.org/10.1002/jha2.168
[15] Algailani, H., Hamad, M.E.S. (2018). Detection of sickle cell disease based on an improved Watershed segmentation. In 2018 International Conference on Computer, Control, Electrical, and Electronics Engineering (ICCCEEE), Khartoum, Sudan, pp. 1-4. https://doi.org/10.1109/ICCCEEE.2018.8515855
[16] Savitt, T.L., Goldberg, M.F. (1989). Herrick's 1910 case report of sickle cell anemia: The rest of the story. Jama, 261(2): 266-271.
[17] Sen, B., Ganesh, A., Bhan, A., Dixit, S., Goyal, A. (2021). Machine learning based diagnosis and classification of sickle cell anemia in human RBC. In 2021 Third International Conference on Intelligent Communication Technologies and Virtual Mobile Networks (ICICV), Tirunelveli, India, pp. 753-758. https://doi.org/10.1109/ICICV50876.2021.9388610
[18] Chy, T.S., Rahaman, M.A. (2019). A comparative analysis by KNN, SVM & ELM classification to detect sickle cell anemia. In 2019 International Conference on Robotics, Electrical and Signal Processing Techniques (ICREST), Dhaka, Bangladesh, pp. 455-459. https://doi.org/10.1109/ICREST.2019.8644410
[19] Petrović, N., Moyà-Alcover, G., Jaume-i-Capó, A., González-Hidalgo, M. (2020). Sickle-cell disease diagnosis support selecting the most appropriate machine learning method: Towards a general and interpretable approach for cell morphology analysis from microscopy images. Computers in Biology and Medicine, 126: 104027. https://doi.org/10.1016/j.compbiomed.2020.104027
[20] Alzubaidi, L., Fadhel, M.A., Al-Shamma, O., Zhang, J., Duan, Y. (2020). Deep learning models for classification of red blood cells in microscopy images to aid in sickle cell anemia diagnosis. Electronics, 9(3): 427. https://doi.org/10.3390/electronics9030427
[21] Patgiri, C., Ganguly, A. (2019). Comparative study on different local adaptive thresholding techniques for detection of sickle cell anaemia from microscopic blood images. In 2019 IEEE 16th India Council International Conference (INDICON), Rajkot, India, pp. 1-4. https://doi.org/10.1109/INDICON47234.2019.9030304
[22] Patgiri, C., Ganguly, A. (2021). Adaptive thresholding technique based classification of red blood cell and sickle cell using Naïve Bayes Classifier and K-nearest neighbor classifier. Biomedical Signal Processing and Control, 68: 102745. https://doi.org/10.1016/j.bspc.2021.102745
[23] Yeruva, S., Varalakshmi, M.S., Gowtham, B.P., Chandana, Y.H., Prasad, P.K. (2021). Identification of sickle cell anemia using deep neural networks. Emerging Science Journal, 5(2): 200-210. https://doi.org/10.28991/esj-2021-01270
[24] Raina, S., Khandelwal, A., Gupta, S., Leekha, A. (2020). Blood cells detection using faster-RCNN. In 2020 IEEE International Conference on Computing, Power and Communication Technologies (GUCON), Greater Noida, India, pp. 217-222. https://doi.org/10.1109/GUCON48875.2020.9231134
[25] Soni, S., Thakkar, H., Singh, B.K. (2022). Transfer learning for sickle cell anemia and trait classification. In 2022 Second International Conference on Power, Control and Computing Technologies (ICPC2T), Raipur, India, pp. 1-5. https://doi.org/10.1109/ICPC2T53885.2022.9776656
[26] Sen, B., Ganesh, A., Bhan, A., Dixit, S. (2021). Deep learning based diagnosis of sickle cell anemia in human RBC. In 2021 2nd International Conference on Intelligent Engineering and Management (ICIEM), London, United Kingdom, pp. 526-529. https://doi.org/10.1109/ICIEM51511.2021.9445293
[27] Suganthi, M., Sathiaseelan, J.G.R. (2020). An exploratory of hybrid techniques on deep learning for image classification. In 2020 4th International Conference on Computer, Communication and Signal Processing (ICCCSP), Chennai, India, pp. 1-4. https://doi.org/10.1109/ICCCSP49186.2020.9315270
[28] Islam, M.Z., Islam, M.M., Asraf, A. (2020). A combined deep CNN-LSTM network for the detection of novel coronavirus (COVID-19) using X-ray images. Informatics in Medicine Unlocked, 20: 100412. https://doi.org/10.1016/j.imu.2020.100412
[29] Darrin, M., Samudre, A., Sahun, M., Atwell, S., Badens, C., Charrier, A., Helfer, E., Viallat, A., Cohen-Addad, V., Giffard-Roisin, S. (2023). Classification of red cell dynamics with convolutional and recurrent neural networks: A sickle cell disease case study. Scientific Reports, 13(1): 745. https://doi.org/10.1038/s41598-023-27718-w
[30] Liu, Y., Loh, H.T., Tor, S.B. (2005). Comparison of extreme learning machine with support vector machine for text classification. In International Conference on Industrial, Engineering and Other Applications of Applied Intelligent Systems, pp. 390-399. https://doi.org/10.1007/11504894_55
[31] Ganesan, K., K, B.B. (2023). A novel deep learning approach for sickle cell anemia detection in human RBCs using an improved wrapper-based feature selection technique in microscopic blood smear images. Biomedical Engineering/Biomedizinische Technik, 68(2): 175-185. https://doi.org/10.1515/bmt-2021-0127
[32] Galvez, R.L., Bandala, A.A., Dadios, E.P., Vicerra, R.R.P., Maningo, J.M.Z. (2018). Object detection using convolutional neural networks. In TENCON 2018-2018 IEEE Region 10 Conference, Jeju, Korea (South), pp. 2023-2027. https://doi.org/10.1109/TENCON.2018.8650517
[33] Alzubaidi, L., Al-Shamma, O., Fadhel, M.A., Farhan, L., Zhang, J. (2020). Classification of red blood cells in sickle cell anemia using deep convolutional neural network. In Intelligent Systems Design and Applications: 18th International Conference on Intelligent Systems Design and Applications (ISDA 2018), Vellore, India, pp. 550-559. https://doi.org/10.1007/978-3-030-16657-1_51
[34] Lundervold, A.S., Lundervold, A. (2019). An overview of deep learning in medical imaging focusing on MRI. Zeitschrift für Medizinische Physik, 29(2): 102-127. https://doi.org/10.1016/j.zemedi.2018.11.002
[35] Chang, P., Grinband, J., Weinberg, B.D., Bardis, M., Khy, M., Cadena, G., Su, M.Y., Cha, S., Filippi, C.G., Bota, D., Baldi, P., Poisson, L.M., Jain, R., Chow, D. (2018). Deep-learning convolutional neural networks accurately classify genetic mutations in gliomas. American Journal of Neuroradiology, 39(7): 1201-1207. https://doi.org/10.3174/ajnr.A5667
[36] Hochreiter, S. (1998). The vanishing gradient problem during learning recurrent neural nets and problem solutions. International Journal of Uncertainty, Fuzziness and Knowledge-Based Systems, 6(02): 107-116. https://doi.org/10.1142/S0218488598000094
[37] Chen, G. (2016). A gentle tutorial of recurrent neural network with error backpropagation. arXiv preprint arXiv:1610.02583. https://arxiv.org/abs/1610.02583