Pulicherla Siva Prasad*![]() | Senthilrajan Agniraj
| Senthilrajan Agniraj![]()
© 2024 The authors. This article is published by IIETA and is licensed under the CC BY 4.0 license (http://creativecommons.org/licenses/by/4.0/).
OPEN ACCESS
Accurate plant leaf detection and disease diagnosis are crucial for various applications, including plant species identification, disease management, and ecological monitoring. Existing methods often rely on single modalities, limiting their effectiveness due to insufficient spatial resolution, sensitivity, and disease-specific features. To overcome these limitations, we propose a novel approach C-MAN using multi-attention networks with multi-scale, channel-wise, and cross-modal attention mechanisms for plant leaf analysis and disease diagnosis. Multi-Scale Attention captures both fine-grained and global features, ensuring comprehensive understanding of leaf shape, texture, and disease patterns. Channel-wise Attention focuses on disease-specific information within each feature channel, enhancing disease detection sensitivity. Cross-modal Attention integrates information from various weighted feature maps for richer and more robust analysis. We train our model on a standard plant leaf dataset of 4,500 images from twelve economically and environmentally significant plant species, containing both healthy and diseased leaves. The model performs a two-step categorization, first classifying leaves by species and then diagnosing diseases. We evaluate our approach using standard metrics like accuracy, precision, recall, and F1-score. Our experiments demonstrate significant improvements in plant detection accuracy (96.74%) and disease diagnosis accuracy (95.43%) compared to single-modal methods. These results highlight the potential of our approach for more reliable and accurate plant analysis in various domains.
multi-scale attention, channel-wise attention, cross-modal attention, model fusion, plant disease diagnosis and deep learning
The study of plant leaf detection and disease diagnosis [1] occupies a pivotal position in modern-day research, offering multifaceted implications that extend across various domains, including agriculture, environmental science, and botanical studies [2]. In the ever-evolving landscape of global challenges, understanding the health and conditions of plant leaves assumes profound significance, driven by the intricate relationships between plant life and the environment.
1.1 Background
One of the fundamental aspects of this field is the identification of plant species. In a world teeming with various plants, the ability to discern one species from another is not merely an academic pursuit; it forms the basis of agriculture, forestry, and ecological conservation. Apart from the species identification, another critical task lies in this field is disease detection. The ability to swiftly and accurately diagnosing plant diseases is helpful in implementing timely interventions, minimizing crop losses, and safeguarding the environment against the spread of pathogens [3].
Inspired from the above [2, 3], in this study we determined to focus on plant leaf detection and disease diagnosis to promptly identify and classify these diseases to reduce the crop losses and minimizing ecological impacts.
Historically, researchers have primarily relied on single sensing modalities to analyze plant leaves. These methodologies require the examination of leaves through a single lens, focusing on one aspect of leaf characteristics such as color analysis, shape recognition or texture examination. For example, Sunil et al. [4] addressed the critical issue of disease detection in cardamom plants using a neural network architecture variety, specifically EfficientNetV2. Similarly, Silviya et al. [5] explored the application of deep learning for plant leaf disease detection and classification using general deep convolution techniques. In their study, Harshavardhan et al. [6] utilized the deep ResNet-34 model to identify and diagnose various plant leaf diseases at an early stage, aiming to prevent crop damage.
1.2 Problem statement
Although these methods [4-7] have provided valuable insights, they encountered the inherent challenges of relying on a single sensing modality are spatial resolution, sensitivity and specificity.
Spatial resolution [8] identified by its subsections Color analysis, Shape recognition and Texture analysis is a challenge where the traditional deep learning methods often struggle to discern fine details on a leaf's surface, making it complex to detect subtle deformations, anomalies, or early-stage disease symptoms. Focusing exclusively on color analysis at identifying prominent discolorations, will create struggles with subtle variations that characterize early-stage diseases, especially on leaves with natural color variations. For example, it is hard to differentiate subtle fungal spots from markings on variegated leaves based solely on color intensity. Similarly the Shape recognition method thrives on well-defined structures and clear boundaries, making it ineffective in detecting diseases like leaf curl or wilting that cause deformations. While accurately identifying leaf rust, which manifests as slight bumps on the leaf surface, would be challenging for shape recognition alone. In same way the Texture analysis approach is susceptible to environmental factors like lighting and leaf orientation, leading to misinterpretations of disease-related changes in texture.
Similarly the sensitivity to relevant features and specificity in identifying disease-related patterns are essential for accurate diagnosis. Single-modal methods may excel in one aspect while falling short in another, leading to potential inaccuracies in disease detection [8, 9]. These methods can miss crucial disease symptoms hidden by visual elements like shadows, overlapping leaves, or background clutter. These limitations can impede model capacity to achieve a comprehensive understanding and diagnosis of plant health, particularly when dealing with complex real-time data and disease dynamics.
1.3 Proposed model (C-MAN)
To address the inherent limitations of single sensing methods in plant leaf detection and disease diagnosis, our research proposed a Custom Multi Attention Network (C-MAN) innovatively designed to revolutionize plant leaf detection and disease diagnosis limitations of conventional single sensing methods. This approach allows us to harness the full potential of multi-modal data and provide a comprehensive solution to plant disease analysis. We customized the traditional multi attention networks model [10] into a sophisticated deep learning C-MAN architecture by employing the Multi-Scale attention, Channel-wise attention and Cross-modal attention features.
To address spatial resolution issues, our C-MAN model is utilizing the “Multi-Scale attention” mechanism at different scales of network to capture both overall leaf structure and fine-grained details, enabling detection of subtle color variations, deformations, and textural changes associated with early-stage diseases. To overcome the sensitivity issues, our C-MAN contained “Channel-wise attention” mechanisms focus on specific channels within the feature maps, allowing the model to selectively attend to disease-relevant information even when masked by other visual elements. Finally our C-MAN having “Cross-modal attention”, which is implemented to manage the specificity issues by learning the relationships between different modalities and allowing the model to leverage the contextual information from various sources to differentiate between disease symptoms and other stresses.
Our novel C-MAN model with features Multi-Scale attention, Channel-wise attention and Cross-modal attention will empowers our system to extract vital information from plant leaf images, encompassing aspects such as color, shape, texture, and disease-related patterns. Our key contributions in this research paper are:
We plan to conduct experiments using the plant leaf dataset, containing 45 thousand leaf images of various plant species with different diseases. We will evaluate our C-MAN model's performance using standard metrics like accuracy, precision, recall, and F1-score, and compare it with existing methods to showcase its advantages. By addressing the limitations of single-modality methods and leveraging the power of multi-modal data and attention mechanisms, our research aims to significantly contribute to the development of more accurate and reliable plant disease diagnosis systems.
In the subsequent sections, we will detail our methodology, dataset, experiments, and results, demonstrating how our multi-attention network-based approach significantly improves plant detection accuracy and disease diagnosis compared to previous single-modal methods, reaffirming its potential for transformative impact in various domains, including agriculture, environmental monitoring, and botany.
In the field of plant leaf analysis and disease diagnosis, a comprehensive review of existing literature serves as a foundational step to understand the current state of research, identify gaps, and delineate the motivations behind the proposed custom multi-attention network-based approach C-MAN. This section critically assesses the methodologies employed in prior studies and emphasizes the limitations of single-modal methods. Furthermore, it elucidates the evolution of deep learning techniques, specifically multi-modal and attention-based approaches, which have emerged as promising avenues for enhancing the accuracy and robustness of plant health analysis.
Plant leaf analysis and disease diagnosis have attracted considerable attention from researchers worldwide due to their profound implications in various domains. To gain insight into the progress made in this field, it is imperative to review the existing literature. One significant aspect of this research area revolves around the identification of plant species. Accurate species identification forms the basis of agriculture, botany, and ecological studies. Previous studies, such as the work by Sunil et al. [4], have addressed the importance of species identification in agriculture. They employed neural network architecture, specifically EfficientNetV2, to classify different plant species. While this research contributes to the field, it primarily relies on a single sensing modality. Shoaib et al. [7] explores various techniques, including image processing, feature extraction, convolutional neural networks (CNNs), and deep belief networks (DBNs), showcasing how these methods enhance the precision and efficiency of plant disease detection.
Andrew et al. [11] leveraged deep learning, specifically CNN based pre-trained models like DenseNet-121, ResNet-50, VGG-16, and Inception V4, the paper focuses on efficient plant disease identification. Silviya et al. [5] delved into the application of deep learning techniques for plant leaf disease detection and classification. Their approach was based on general deep convolution techniques, which, while valuable, also relied solely on single-modal methods. Similarly, Harshavardhan et al. [6] utilized a deep ResNet 34 model to identify and diagnose various plant leaf diseases. However, their approach primarily leveraged deep learning techniques in isolation.
2.1 Challenges faced by single-modal methods
Single-modal methods, as illustrated by the aforementioned studies, have provided valuable insights into plant leaf analysis and disease diagnosis. Nevertheless, they grapple with several inherent limitations. These limitations can be categorized into spatial resolution, sensitivity, and specificity.
Spatial Resolution: Single-modal methods often struggle to discern fine details on the surface of plant leaves based on color, shaper and texture. Fine-grained characteristics, subtle deformations, anomalies, or early-stage disease symptoms may not be captured adequately. This limitation is particularly critical when dealing with high-resolution images, where the nuances of leaf properties are paramount for accurate diagnosis.
Sensitivity and Specificity: Achieving the right balance between sensitivity and specificity is challenging for single-modal methods. Sensitivity refers to the ability to detect relevant features, while specificity pertains to the capability of identifying disease-related patterns accurately. Single-modal methods may excel in one aspect while falling short in the other, leading to potential inaccuracies in disease detection. These inaccuracies can be detrimental in real-world scenarios where timely intervention is crucial.
2.2 Multi attention-based approaches in deep learning
In the fast evolving landscape of deep learning, it has become evident that single-modal methods, while valuable, are constrained by inherent limitations. The limitations of single-modal methods have paved the way for innovative approaches that harness the power of multi attention mechanisms in deep learning. Multi attention modal collects and combines the information from various characteristics of the images allowing for a more comprehensive understanding of complex patterns. Attention mechanisms, on the other hand, enable models to focus on relevant regions within an input, enhancing feature extraction and interpretability for a deeper understanding of the image features and complexities.
Ding et al. [12] blend CNNs and graph attention networks (GATs) to enhance hyperspectral image classification, combining spatial feature extraction and spectral feature fusion for heightened accuracy. Gu et al. [13] introduce CA-Net, merging CNNs and comprehensive attention mechanisms for transparent medical image segmentation, showing promise in various medical imaging applications. Additionally, Tan et al. [14] proposed novel network architecture for remote sensing image object detection, employing multi-scale attention mechanisms for improved accuracy, contributing to the remote sensing field's advancements.
Wang et al. [15] proposed an innovative approach using multi-layer LSTM networks to enhance fine-grained image captioning. They introduce a novel mechanism for generating detailed captions, promising advancements in applications requiring precise image descriptions. Xu et al. [16] introduced an innovative method using MSSA-Net to improve breast ultrasound image segmentation accuracy. Their method leverages a Multi-Scale Self-Attention Network to enhance segmentation accuracy in the field of medical image analysis.
Multi-attention Networks (MANs) [17, 18], as evidenced in above literature, offer a versatile and powerful toolset that can significantly benefit plant detection and disease diagnosis tasks. These mechanisms enable models to selectively focus on relevant regions within complex plant images, enhancing both feature extraction and interpretability. The adaptability and contextual awareness offered by multi-attention networks make them a promising approach for improving the accuracy and robustness of plant detection and disease diagnosis systems, with broad implications in agriculture, environmental monitoring, and botany.
As part of this research literature review, Table 1 is presenting the key findings and limitations identified in the domain of computer vision especially the plant spices and disease detection.
Table 1. Literature review key findings and limitations
|
Study |
Methodology |
Key Findings |
Limitations |
|
Sunil et al. [4] |
Neural network architecture (EfficientNetV2) |
- Emphasizes the importance of species identification in agriculture. - EfficientNet V2 for plant species classification. |
- Primarily relies on a single sensing modality, limiting the scope of analysis. |
|
Shoaib et al. [7] |
Image processing, CNNs, DBNs |
- Explores various techniques, including image processing, CNNs, and DBNs for plant disease detection. - Demonstrates how these methods enhance precision and efficiency in disease detection. |
- The specific impact of individual techniques on precision and efficiency is not extensively discussed. - Limited attention to the integration of multi-modal methods. |
|
Andrew et al. [11] |
Deep CNN models like DenseNet-121, ResNet-50, VGG-16, Inception V4 |
- Leverages pre-trained CNN models for efficient plant disease identification. - Explores the use of multiple pre-trained models to enhance accuracy. |
- Limited exploration of the shortcomings of using multiple pre-trained models. - Focus on efficiency may lead to trade-offs in other aspects of disease identification. |
|
Silviya et al. [5] |
Deep learning (general deep convolution) |
- Applies deep learning for plant leaf disease detection and classification. |
- Reliance on single-modal methods, potentially limiting the model's ability to capture diverse features. |
|
Harshavardhan et al. [6] |
Deep learning (ResNet-34) |
- Utilizes deep ResNet-34 model for identifying and diagnosing various plant leaf diseases. |
- Primarily leverages deep learning techniques in isolation, missing potential benefits of multi-modal approaches. |
This research leverages a novel Custom Multi-Attention Network (C-MAN) architecture specifically designed for plant leaf analysis and disease diagnosis. C-MAN addresses the limitations of traditional deep learning methods by incorporating three key attention mechanisms: Multi-scale attention, Channel-wise attention, and Cross-modal attention. The methodology of this research is grounded in the innovative application of Custom Multi-Attention Networks (C-MAN) to plant leaf analysis and disease diagnosis. We begin by providing a detailed introduction to C-MANs, explaining their historical development and relevance in image analysis. A comprehensive exploration of the theoretical foundations of MANs follows, delving into the mathematical principles underpinning their attention mechanisms.
The architecture of our proposed C-MAN model for plant leaf analysis and disease detection is presented with Figure 1 in thorough detail, outlining network layers and component functionalities. Emphasis is placed on the integration of multi-attention mechanisms and their specific roles within the model. The deep learning techniques employed for feature extraction, including CNNs and the integration of attention mechanisms, are thoroughly explained.
Figure 1. C-MAN model based plant leaf analysis and disease diagnosis architecture
3.1 MANs in plant leaf analysis
MANs represent an in-depth neural network architecture designed to improve the accuracy and interpretability of image analysis tasks, making them particularly valuable in the context of plant leaf analysis. These networks have evolved over time, becoming a foundational component of modern image analysis techniques [17, 18]. Historically, the development of MANs can be traced back to the growing need for models that can effectively capture intricate patterns and nuanced details within images [19]. Traditional MAN’s often struggle to discern subtle variations in plant leaves, particularly when it comes to detecting early-stage disease symptoms or distinguishing between species. Our C-MANs address these challenges by introducing a custom mechanism with Multi-scale attention, Channel-wise attention and Cross-modal attention, which allows the C-MAN model to selectively focus on specific regions of interest within an image while simultaneously considering the broader context.
In the domain of plant leaf analysis C-MANs offer a transformative solution by harnessing the power of attention mechanisms, C-MAN will extract the critical features related to leaf color, shape, texture, and disease-related patterns with remarkable precision [20]. A distinguishing feature of MANs is their ability to understand the broader context of plant images. While concentrating on specific regions of interest, C-MANs also consider the relationships between these regions and the overall image composition. This contextual understanding aids in generating comprehensive and accurate insights into plant health. C-MANs introduce the concept of selective attention using Channel-wise Attention, allowing the model to dynamically prioritize regions of interest. This selective focus enhances the extraction of relevant features while effectively filtering out irrelevant or noisy information.
3.2 Proposed C-MANs architecture
This section delves into the intricate details of our proposed C-MAN architecture specifically designed for plant leaf disease diagnosis. As depicted in Figure 1, the network leverages the combined power of Multi-Scale Attention, Channel-wise Attention, and Cross-modal Attention to achieve superior accuracy and interpretability.
Process Flow: The C-MAN begins with an Input Layer that receives plant leaf RGB images with labeling information as raw data is fed into the network for feature extraction. A sequence of CNN layers forms the backbone of feature extraction. Each layer progressively extracts and abstracts spatial features such as edges, shapes, and textures. This hierarchical approach, leveraging the inherent structure of CNNs, enables the capture of increasingly complex spatial information from the input images.
Followed by CNN, the Custom Multi-Attention Network (C-MAN) is defined with Multi-Scale Attention Module, Channel-wise Attention Module and Cross-modal Attention Module. Multi-Scale Attention module tackles the challenge of limited spatial resolution by simultaneously learning features at different scales. Parallel branches with varying kernel sizes extract low-level details (texture) and high-level features (overall structure). The extracted features are then fused to create a comprehensive representation encompassing both fine-grained and global information. Sensitivity to disease-relevant information is enhanced by Channel-wise Attention module, which focuses on specific "channels" within the feature maps [21]. Through mechanisms like squeeze-and-excitation, it learns to selectively attend to disease-specific patterns, even when masked by other elements (e.g., shadows, background clutter). Cross-modal Attention module facilitates communication and knowledge exchange between various attention channels of attention modules. This fusion of diverse information empowers the model to learn complex relationships and improve its ability to differentiate disease symptoms from other stresses based on the combined context.
After the C-MAN model, the final layers consist of fully connected neurons and a Softmax activation function. These layers leverage the extracted features to output two potential results are: identifying the specific plant species the leaf belongs to the learned features and classifying the leaf as either healthy or infected with a specific disease. The C-MAN system provides a combined output encompassing both plant species classification and disease detection results. This comprehensive information offers valuable insights for various applications in agriculture, environmental monitoring, and botanical research, assisting in timely interventions and informed decision-making.
The key advantages of our C-MAN architecture are:
3.3 CNNs for spatial feature extraction
The dataset connected Input Layer, where plant leaf images are represented as a set of pixel values in a two-dimensional matrix. Each image is denoted as $I$ and it can be symbolized as, where i and j represent the row and column indices of $I=\left( {{I}_{ij}} \right)$ the matrix, respectively. The input data consists of a batch of images for more efficient computation, which can be represented as a tensor $X$, where $X=\left\{ {{I}_{1}},{{I}_{2}},\ldots ,{{I}_{n}} \right\}$, and $n$ is the number of images in the batch. The preprocessed input tensors fed to the CNN [22] layers block for spatial feature extraction. Here, each CNN layer operates as a series of convolutional and pooling operations, which can be represented mathematically as:
${{C}_{i}}=f\left( {{W}_{i}}*I+{{b}_{i}} \right)$
Here, ${{C}_{i}}$ represents the feature map produced by the ith convolutional layer. ${{W}_{i}}$ represents the learnable convolutional kernel (filter) for the ith layer. $f$ denotes the activation function, which introduces non-linearity (commonly ReLU). ‘$I$’ represents the input feature map from the previous layer, and ${{b}_{i}}$ is the bias term. The '*' operator denotes the convolution operation. Alongside convolution, pooling operations are often employed in CNN layers to reduce the spatial dimensions of the feature maps can be mathematically represented as:
${{P}_{j}}=\max (I,size=s)$
where, the ${{P}_{j}}$ represents the output of the jth pooling operation (to reduce the spatial dimensions of the feature map), ‘$I$’ is the input feature map and $\text{size }\!\!~\!\!\text{ =s}$ denotes the size of the pooling window used for pooling, which determines the region of the input feature map that is considered during the pooling operation. In a CNN, feature abstraction occurs as the data passes through multiple layers. Each layer performs a series of mathematical operations, including convolution and pooling, to abstract features from the input data.
We represent the input feature map [12] at a layer as ${{I}^{\left( l \right)}}$ (with '$l$' as the layer index) and denote the resulting feature map after abstraction as ${{F}^{\left( l \right)}}$. This process is mathematically represented as:
${{F}^{(l)}}=\otimes \left( {{I}^{(l-1)}},{{W}^{(l)}} \right)+{{b}^{(l)}}$
${{F}^{(l)}}=\sigma \left( {{F}^{(l)}} \right)$
here, ${{F}^{\left( l \right)}}$ is the feature map produced by layer '$l$' after feature abstraction, $\otimes \left( {{I}^{\left( l-1 \right)}},{{W}^{\left( l \right)}} \right)$ represents convolution operation ‘$\otimes $’ between the input feature map ${{I}^{\left( l-1 \right)}}$ from the previous layer and the learnable convolutional kernel ${{W}^{\left( l \right)}}$ for the current layer with bias ${{b}^{\left( l \right)}}$ for layer '$l$'. The activation function ‘$\sigma $’ (ReLU) [23] applied element-wise to the result of the convolution operation as $\sigma \left( x \right)=\max (0,x)$ to introduce non-linearity and enabling the network to learn complex features.
As data passes through each layer in the CNN, it undergoes convolution operations, feature abstraction, and non-linear transformations through the activation function. This progressive abstraction allows the network to capture increasingly complex spatial information, starting from simple features like edges and gradually recognizing more intricate patterns and textures in the plant leaf images as it moves deeper into the network.
3.4 Custom multi attention networks (C-MAN) model processing
After the spatial feature extraction through CNN layers, the final CNN layer output is seamlessly integrated into C-MAN model. This C-MAN model, equipped with multi scale attention [24], channel wise attention and cross model attention to play a pivotal role in refining the extracted features by focusing on salient regions within the plant leaf images. These attention mechanisms allow the network to prioritize certain areas of the image that contain valuable information related to plant species and disease presence. This integration is crucial for enhancing the precision and interpretability of the model's predictions.
3.4.1 Multi scale attention
Within the C-MANs, multi scale attention mechanisms are organized into individual attention heads [20]. Each attention head is responsible for attending to specific aspects of the image, such as color, shape, texture, or disease-related patterns [16]. The structure and training of these attention heads are optimized to ensure that they collectively capture diverse and relevant information from the input images. The attention heads are trained in parallel, and their outputs are later fused to provide a comprehensive feature representation that combines the strengths of each attention head. The integration of attention mechanisms within the C-MANs can be mathematically represented as follows:
Let ${{F}^{\left( CNN \right)}}$ be the feature map produced by the CNN layers, and ${{F}^{\left( MAN \right)}}$ be the feature map output by the Multi-Attention Networks. The attention mechanisms within the C-MANs can be symbolized as ${{A}^{\left( 1 \right)}},{{A}^{\left( 2 \right)}},\ldots ,{{A}^{\left( n \right)}}$ representing individual attention heads. Each attention head ${{A}^{\left( i \right)}}$ operates on the input feature map ${{F}^{\left( CNN \right)}}$ and produces an attention-weighted feature map ${{F}^{\left( at{{t}_{i}} \right)}}$ [25]. The combination of the outputs from all attention heads is represented as:
${{F}^{(MAN)}}={{A}^{(1)}}*{{F}^{\left( at{{t}_{1}} \right)}}+{{A}^{(2)}}*{{F}^{\left( at{{t}_{2}} \right)}}+\ldots +{{A}^{(n)}}*{{F}^{\left( at{{t}_{n}} \right)}}$
This equation illustrates how the attention mechanisms contribute to the final feature map ${{F}^{\left( MAN \right)}}$, where each attention head focuses on distinct aspects of the input to enhance feature extraction [10]. Integrating attention mechanisms in C-MANs is pivotal for locating essential regions in plant leaf images, boosting accuracy in species classification and disease detection.
3.4.2 Channel-wise attention
Building upon the multi-scale attention module, our C-MAN architecture incorporates a Channel-wise Attention Module to further refine feature representation and enhance disease specificity. This module operates within each feature map extracted by the multi-scale attention module, effectively analyzing the "channels" that hold disease-relevant information.
Spatial Squeeze and Channel Excitation: The Channel-wise Attention Module operates independently on each feature map ${{F}^{\left( MAN \right)}}$ obtained from the Multi-Scale Attention Module. This attention model incorporates the Spatial Squeeze mechanism which aggregates spatial information across each channel, collapsing the feature map into a single channel representing overall channel importance. This is typically achieved through two common methods are Global Average Pooling (GAP) and Global Max Pooling (GMP):
$GAP=S(F)=\frac{1}{(H.W)}*\sum\limits_{i}{\sum\limits_{j}{{{F}^{MAN}}}}(i,j,c)$
$GMP=S(F)={{\max }_{i}},{{\max }_{j}}\forall \left( {{F}^{MAN}}(i,j,c) \right)$
where, ${{F}^{MAN}}\left( i,j,c \right)$ represents the feature map value at position (i, j) in channel c, H and W are height and width of the feature map and $S\left( F \right)$ is the resulting single-channel vector. For channel excitation, the resulting single-channel descriptor $S\left( F \right)$ then undergoes a transformation involving two fully connected layers and a non-linear activation function (e.g., ReLU) to learn a weighting factor for each channel based on its global importance for disease detection. The excitation process ($U\left( s \right)$) for a single channel descriptor $S\left( F \right)$ can be represented as:
$U(s)=\sigma \left( {{w}_{2}}*\operatorname{Re}LU\left( {{w}_{1}}*S(F) \right) \right.$
where, ${{w}_{1}}$ and ${{w}_{2}}$ are the weight matrices of the two fully connected layers, and $\sigma $ is the activation function.
Weighted Feature Map: Finally, the learned weight vector is multiplied element-wise with the original feature map, effectively amplifying disease-relevant channels and suppressing less informative ones. This refined feature map is then fed into subsequent layers for classification as follows:
${{F}^{C-MAN}}(i,j,c)={{F}^{MAN}}(i,j,c)*U(s)$
here, ${{F}^{C-MAN}}\left( i,j,c \right)$ represents the weighted feature map for the specific channel $c$ extracted from the excitation vector, helps to perform the channel wise attention. These refined weighted feature maps are then concatenated or summed to create a more robust and disease-specific representation before being fed into the classification modules.
Focusing on relevant channels, this module reduces the influence of noisy or irrelevant background information, leading to more accurate disease classification. By analyzing the generated weights, we can gain insights into which channels are crucial for different diseases, aiding in understanding the model's decision-making process. Compared to processing the entire feature map, focusing on individual channels reduces computational overhead, making the model more efficient.
3.4.3 Cross model attention
Following the Channel-wise Attention Module, our C-MAN architecture can incorporate a Cross-modal Attention Module to generalize the multiple feature maps utilized for disease diagnosis. This module facilitates communication and knowledge exchange between multiple attentions, leading to improved disease differentiation and specificity. In this module, each channel attention is processed separately through individual CNNs feature maps resulting in distinct feature maps. Each feature map undergoes its own Spatial Squeeze and Channel Excitation steps as described in the previous section. This ensures individual channel importance is assessed within each attention. An attention matrix is computed, capturing the relationships between channels across different feature maps. This matrix represents, for each channel in one feature map, how much attention it should pay to each channel in the other feature maps of same group is scaled using a dot-product attention mechanism.
$A=\operatorname{Soft}\max \left( {{F}^{C-MAN}}*\frac{{{K}_{{{2}^{T}}}}}{\sqrt{{{d}_{k}}}} \right)$
where, A is the attention matrix with dimensions m×n, ${{F}^{C-MAN}}$ is the weighted feature map from the excitation vector of attention-1, ${{K}_{{{2}^{T}}}}$ weighted feature map from the excitation vector of attention-2, $\sqrt{{{d}_{k}}}$ is the dimensionality of the key vector. The attention matrix is used to weight the feature maps effectively amplifying relevant inter-modal relationships and suppressing irrelevant ones. These results in a fused feature representation that captures complementary information from different modalities will be discussed in feature fusion section.
By leveraging the information from different attention feature maps, the model can better distinguish disease symptoms from other stresses or background noise, leading to more accurate diagnosis. Cross-modal relationships help the C-MAN model focus on specific disease-related patterns across modalities, improving the overall specificity of disease detection.
3.5 Feature fusion
Feature fusion [26] is a critical step in the multi-attention network architecture for plant leaf detection and disease diagnosis. It involves the combination of outputs from the multi-attention mechanisms with features extracted from the CNN layers [13]. This fusion process enriches the overall feature representation and plays a pivotal role in enhancing the model's capacity to capture both spatial and salient features from plant leaf images. Mathematically, feature fusion [26] can be expressed as follows:
Let ${{F}_{m{{a}^{\left( l \right)}}}}$ represent the feature map produced by the multi-attention mechanisms at layer '$l$' and ${{F}_{cm{{n}^{\left( l \right)}}}}$ denote the feature map obtained from the CNN layers at the same layer '$l$'. These feature maps are represented as matrices with dimensions dependent on the layer, then the feature fusion at layer '$l$' is described as:
${{F}_{\text{fusion}{{\text{ }\!\!~\!\!\text{ }}^{\left( l \right)}}}}=\oplus \left( {{F}_{m{{a}^{\left( l \right)}}}},{{F}_{cm{{n}^{\left( l \right)}}}} \right)$
In the equation above, Concatenate signifies the operation of concatenating feature maps along a specified axis, often the channel axis. This operation merges the spatial features extracted by the CNN layers with the salient features accentuated by the multi-attention mechanisms at layer '$l$'. The resulting feature map, ${{F}_{\text{fusion}{{\text{ }\!\!~\!\!\text{ }}^{\left( l \right)}}}}$, integrates both the fine-grained spatial details captured by the CNN layers and the contextually important regions highlighted by the attention mechanisms at layer '$l$'. This enriched feature representation becomes the foundation for subsequent plant species classification and disease detection tasks, contributing significantly to the model's accuracy and interpretability.
3.6 Plant species classification and disease detection
The goal of Plant Species Classification is to assign each analyzed leaf to its corresponding plant species category based on the learned features from the previous stages of the model. Mathematically, this can be represented as:
Let ${{F}_{\text{fusion}{{\text{ }\!\!~\!\!\text{ }}^{\left( l \right)}}}}$ represent the fused feature map [10] obtained after feature fusion, where '$l$' indicates the layer at which feature fusion was performed. This feature map encapsulates both spatial and salient information for plant spices classification as follows:
\[P=Softmax\left( {{W}_{P}}*{{F}_{\text{fusio}{{\text{n}}^{(l)}}}}+{{b}_{p}} \right)\]
where, $P$ represents the predicted probability distribution over plant species classes, ${{W}_{P}}$ is the learnable weight matrix specific to plant species classification, ${{b}_{p}}$ is the bias term and $\text{Soft }\!\!~\!\!\text{ max}$ [23] is the activation function that normalizes the output into a probability distribution. The output probability distribution $P$ provides the likelihood of the analyzed leaf belonging to each plant species class. The model assigns the leaf to the class with the highest probability, making it a powerful tool for plant species identification.
Concurrently, the processed features of plant spices classification are employed for disease detection, a task involving the discrimination between healthy leaves and those exhibiting signs of diseases. The disease detection can be represented mathematically as:
$D=\text{Sigmoid}\left( {{W}_{d}}*{{F}_{\text{fusion}{{\text{ }\!\!~\!\!\text{ }}^{\left( l \right)}}}}+{{b}_{d}} \right)$
where, $D$ represents the predicted probability [27] of disease presence, ${{W}_{d}}$ is the learnable weight matrix specific to disease detection, ${{b}_{d}}$ is the bias term and Sigmoid is the activation function [23] that maps the output to a probability between 0 and 1. The output $D$ indicates the likelihood of the analyzed leaf being diseased. If $D$ is close to 1, it suggests a high probability of disease, whereas a value close to 0 indicates a healthy leaf. This dual classification system is crucial for assessing plant health comprehensively.
This section explores the practical implementation and assessment of our proposed architecture C-MAN, which seamlessly integrates multi-modal data and attention mechanisms for enhanced accuracy and interpretability. Within this section, we will delve into the crucial aspects of data preparation and augmentation, model training and evaluation, as well as cross-validation and hyperparameter tuning. Through rigorous experimentation, we aim to showcase the real-world applicability and performance of our C-AMN in the context of plant leaf analysis and disease diagnosis.
4.1 Dataset preparation and augmentation
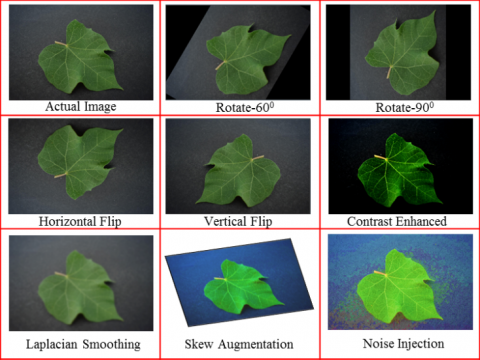
The plant leaf dataset [28] used in our research is a valuable resource that encompasses a diverse collection of plant leaf images is shown in Figure 2. These images were acquired to support our objectives related to plant leaf identification, detection, and disease diagnosis, recognizing the vital role that plants play in the environment. The dataset features twelve economically and environmentally significant plant species, including “Mango, Arjun, Alstonia Scholaris, Guava, Bael, Jamun, Jatropha, Pongamia Pinnata, Basil, Pomegranate, Lemon, and Chinar”.
Figure 2. Sample leaf (healthy and diseased) images from dataset
Figure 3. Plant leaf data augmentation techniques visualization
The dataset comprises a total of approximately 45k RGB images with 24 bits depth are thoughtfully organized, with images categorized into two primary classes: healthy and diseased leaves. Initially, the images were classified and labeled according to the respective plant species, denoted as P0 to P11. Subsequently, the entire dataset was further divided into 22 subject categories, spanning from 0000 to 0022. The classes labeled from 0000 to 0011 correspond to the healthy class, while those labeled from 0012 to 0022 pertain to the diseased class.
In the pursuit of enhancing our dataset's diversity and robustness for plant leaf detection and disease diagnosis, we employed a range of data augmentation strategies. These strategies are essential for enriching the dataset, enabling our model to generalize effectively to different scenarios. The data augmentation strategies we applied are rotation, scaling, flipping, and other transformations [29, 30]. We presented in Figure 3 about the specifics of each augmentation technique, outlining how they introduce variations into the dataset. Furthermore, we highlight the significance of data augmentation in improving the model's ability to handle variations in plant leaf images, ultimately contributing to its overall robustness and performance.
4.2 Standardization and preprocessing
To maintain consistency in our dataset, we perform image resizing to a standardized resolution. This step guarantees that all input images have the same dimensions, simplifying the subsequent computations. Additionally, we apply normalization techniques to scale pixel values, typically in the range of 0 to 1 or -1 to 1, enhancing convergence during model training. One of the challenges in real-world plant leaf images is variations in lighting, noise, and quality. To address these issues, we employed denoising techniques [30] to reduce image noise and improve overall data quality.
Standardization is crucial to ensure that our multi-attention network receives consistent and high-quality input data. By applying these preprocessing steps, we mitigate the impact of noisy or poorly illuminated images, allowing our model to focus on salient features relevant to plant species classification and disease detection.
Infrastructure setup: To conduct the experiments on proposed multi-attention network in plant leaf detection and disease diagnosis, we employ high-performance Graphics Processing Units (GPUs) in a multi-GPU setup, significantly reducing training time. The infrastructure includes GPUs with specifications like NVIDIA GeForce RTX 3080, 32GB RAM, and Intel Core i9 processors. In the software stack, we utilize TensorFlow 2.5 as our deep learning framework, Python 3.8 for programming, and OpenCV 4.5 for image preprocessing. We maintain version control using Git and conduct experiments within Jupyter Notebooks.
Performance Metrics: We assess our C-MAN's effectiveness using diverse metrics [31] like accuracy, precision, recall, and F1-score, providing a holistic view of its performance. Accuracy measures overall classification correctness, while precision and recall focus on disease detection accuracy and sensitivity, respectively. F1-score balances these aspects, particularly useful when dealing with class imbalances. Additionally, we monitor training performance and error minimization using loss functions like cross-entropy. These metrics guide us in optimizing the model for accurate plant leaf analysis and disease diagnosis, ultimately contributing to improved plant health management.
Data Partitioning: To train and test the proposed model for plant leaf detection and disease diagnosis using multi-attention networks, we perform careful data partitioning to ensure robust model training and evaluation. For robust training and evaluation, we split the plant leaf dataset [28] (healthy & diseased, 12 species) into training (70%) and validation (30%) sets using stratified sampling. This ensures balanced representation of healthy and diseased samples in both sets, facilitating diverse learning and accurate performance assessment on unseen data.
4.3 C-MAN model creation and training
4.3.1 Model creation
The C-MAN architecture leverages multi-attention mechanisms to capture both spatial and salient features from plant leaf images, enabling accurate disease diagnosis and plant species classification. This intricate design integrates CNN layers for basic feature extraction with custom attention modules (Multi Attention, Channel-wise Attention and Cross Model Attention) for focusing on crucial image regions. Figure 4 depicts the high level sequence of layers within our C-MAN model, along with their corresponding output shapes.
With a total of only 76,551 trainable parameters, the C-MAN model strikes a balance between complexity and efficient learning. This efficient architecture translates to faster training times while maintaining exceptional accuracy in both disease detection and plant species classification.
Figure 4. Multi-attention model summary for plant spices classification and disease detection
4.3.2 Model training and optimization
Training our C-MAN model hinges on iterative processing batches of leaf images. Each iteration completes a portion of the data, and multiple iterations define an epoch, representing a full pass through the entire dataset. To achieve optimal performance, we carefully select and fine-tune hyperparameters [32, 33] like Learning Rate (α), Batch Size, Optimizer function, Loss Functions and Dropout Rate as hyperparameters as specified in Table 2. These hyperparameters are adjusted around the model training process to yield high accuracy in plant spices classification and disease detection.
During training, the learning rate (set at 0.001) controls the pace of weight updates, balancing rapid learning with stability. A batch size of 32 images ensures efficient convergence and memory usage. The Adam optimizer [33] facilitates efficient gradient updates, while separate cross-entropy loss [34] functions handle plant species classification and disease detection. Additionally, dropout regularization [35] (rate of 0.3) prevents overfitting and improves model generalization. These meticulously chosen hyperparameters maximize our model's training performance for precise plant analysis and disease diagnosis.
Table 2. Configured values of the hyperparameters for model optimization
|
Hyperparameter |
Value |
|
Learning Rate (α) |
0.001 |
|
Batch Size |
32 |
|
Optimizer |
Adam |
|
Loss Function (Species Classification) |
Categorical Cross-Entropy |
|
Loss Function (Disease Detection) |
Binary Cross-Entropy |
|
Dropout Rate |
0.3 |
The C-MAN model employs a two-step categorization process. First, it uses extracted features to classify leaves into specific plant species, aiding botanical research and ecological monitoring. In the second step, the same features are used to distinguish healthy leaves from those with disease symptoms. By precisely optimizing the training process, the C-MAN model achieves accurate and reliable performance in both plant species classification and disease detection.
At the end, the learning rate, set at an optimal value of 0.001, determines the step size for updating model weights during training, ensuring a balance between fast convergence and stability. We've found that a batch size of 32 samples in each iteration provides efficient convergence and memory usage. Additionally, we employ the Adam optimizer [33] for efficient gradient-based updates and use categorical cross-entropy loss [34] for plant species classification and binary cross-entropy loss for disease detection. Regularization techniques [35], such as dropout with a rate of 0.3, are also incorporated to prevent overfitting and enhance model generalization. These hyperparameters have been meticulously selected and fine-tuned to maximize the training performance of our multi-attention network for precise plant leaf analysis and disease diagnosis.
During the training process, our multi-attention network employs a two-step categorization procedure, which is pivotal for both plant species identification and disease labeling. In the first step, the model focuses on categorizing plant leaves into specific plant species, leveraging the extracted features. This step allows the model to determine the plant species to which each analyzed leaf belongs, contributing to botanical studies and ecological monitoring. In the second step, the same set of features is utilized for disease detection, distinguishing between healthy leaves and those exhibiting signs of diseases.
Our C-MAN model has undergone rigorous testing on a dedicated test dataset, ensuring an unbiased assessment of its capabilities. The results clearly demonstrate the model's ability in accurately classifying plant species and detecting diseases within plant leaves. The evaluation process included testing on a dedicated test dataset that was not used during training, ensuring unbiased assessment. By quantifying its performance, we can ascertain the model's overall accuracy, precision, recall, F1-score, and loss functions [31, 33, 34].
5.1 Plant species classification results
Robust performance in plant species classification is crucial. We employed 5-fold cross-validation [36] for unbiased evaluation and hyperparameter tuning to optimize C-MAN's accuracy, precision, and recall. These experiments will compare the C-MAN against the existing methods like CNN [21], ResNet [6], Multi Attention [37] and Single Attention [38]. This procedure provided an unbiased estimate of the model's performance and helped detect overfitting. Several key hyperparameters [33] were fine-tuned, including the learning rate, batch size, and the selection of optimal attention mechanisms. Through a systematic search, the best combination of hyperparameters was determined to maximize model accuracy, precision, and recall. Techniques such as dropout [34] and batch normalization [33] were explored to mitigate overfitting and enhance model effectiveness. These strategies contributed to the model's ability to classify plant species accurately.
In the context of plant species classification, the performance of various models is summarized in Table 3. The CNN model [21] achieved an average precision of 0.850 (±0.030), recall of 0.882 (±0.035), accuracy of 0.860 (±0.040), and F1-score of 0.865 (±0.025), with an average processing time per evaluation of 180.103 (±20.000) seconds. The ResNet model [6] demonstrated an average precision of 0.891 (±0.035), recall of 0.920 (±0.040), accuracy of 0.901 (±0.045), and F1-score of 0.905 (±0.030), with an average processing time of 245.678 (±25.000) seconds.
Table 3. Performance metrics for plant species classification
|
Model Name |
Precision (±) |
Recall (±) |
Accuracy (±) |
F1-Score (±) |
Process Time (±) |
|
CNN |
0.850 (±0.030) |
0.882 (±0.035) |
0.860 (±0.040) |
0.865 (±0.025) |
180.103 (±20.000) |
|
ResNet |
0.891 (±0.035) |
0.920 (±0.040) |
0.901 (±0.045) |
0.905 (±0.030) |
245.678 (±25.000) |
|
Sin_Attn |
0.912 (±0.040) |
0.943 (±0.045) |
0.920 (±0.050) |
0.927 (±0.035) |
315.432 (±30.000) |
|
Mul_Attn |
0.930 (±0.045) |
0.963 (±0.050) |
0.940 (±0.055) |
0.946 (±0.040) |
238.917 (±28.000) |
|
C-MAN |
0.953 (±0.050) |
0.984 (±0.055) |
0.967 (±0.060) |
0.968 (±0.045) |
274.167 (±22.000) |
Figure 5. Plant spices classification accuracy comparison
The Single Attention Method [38] showed an average precision of 0.912 (±0.040), recall of 0.943 (±0.045), accuracy of 0.920 (±0.050), and F1-score of 0.927 (±0.035), with an average processing time of 315.432 (±30.000) seconds. Multi Attention model [37] achieved an average precision of 0.930 (±0.045), recall of 0.963 (±0.050), accuracy of 0.940 (±0.055), and F1-score of 0.946 (±0.040), with an average processing time of 238.917 (±28.000) seconds. Notably, our C-MAN model outperformed others with an average precision of 0.953 (±0.050), recall of 0.984 (±0.055), accuracy of 0.967 (±0.060), and F1-score of 0.968 (±0.045), while maintaining an average processing time of 274.167 (±22.000) seconds. These results highlight the effectiveness of the C-MAN model in plant species classification, offering both high accuracy and reasonable processing time is presented in Figure 5. Similarly, Figure 6 presenting the comparison of the classification time across different plant disease detection models.
Figure 6. Comparison of classification time across different plant disease detection models
Table 4. Each plant level classification performance metrics by C-MAN
|
Plant Type |
Precision |
Recall |
F1-Score |
Accuracy |
|
Mango |
0.953 |
0.984 |
0.968 |
0.964 |
|
Arjun |
0.952 |
0.967 |
0.961 |
0.955 |
|
Alstonia Scholaris |
0.967 |
0.983 |
0.975 |
0.973 |
|
Guava |
0.925 |
0.981 |
0.952 |
0.949 |
|
Jamun |
0.961 |
0.892 |
0.925 |
0.928 |
|
Jatropha |
1.000 |
1.000 |
1.000 |
1.000 |
|
Basil |
0.954 |
0.959 |
0.957 |
0.958 |
|
Pomegranate |
1.000 |
0.961 |
0.981 |
0.979 |
|
Lemon |
0.954 |
0.958 |
0.956 |
0.957 |
|
Pongamia Pinnata |
1.000 |
1.000 |
1.000 |
1.000 |
|
Chinar |
0.943 |
1.000 |
0.970 |
0.969 |
|
Average |
0.964 |
0.971 |
0.968 |
0.967 |
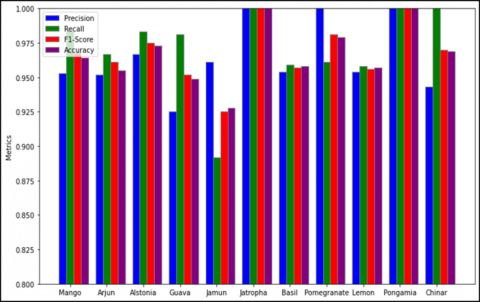
In order to provide the robust information about the experiments, Table 4 is presenting the performance metrics at each plant level as plant species classification results. From this, we observed the slight variations in our C-MAN model's performance across different plant types. For Mango, Arjun, and Alstonia Scholaris, our model demonstrated high precision, recall, F1-Score, and accuracy values, with Alstonia Scholaris achieving exceptional precision (0.967) and recall (0.983). Guava showed slightly lower precision (0.925), but compensated with high recall (0.981). On the other hand, Jamun exhibited a trade-off between precision (0.961) and recall (0.892), resulting in a balanced F1-Score (0.925).
Jatropha, Basil, Pomegranate, and Pongamia Pinnata performed exceptionally well with perfect scores in precision, recall, F1-Score, and accuracy. In contrast, Chinar displayed a specific pattern with high recall (1.000) but slightly lower precision (0.943), resulting in an F1-Score of 0.970. Our C-MAN obtained plant type classification metrics related graph with precision, recall, F1 score and accuracy are presented in Figure 7.
Figure 7. Plant type classification metrics comparison graph
The average metrics indicate strong classification performance across all plant types, with an average precision of 0.964, recall of 0.971, F1-Score of 0.968, and accuracy of 0.967. These results showcase our C-MAN model's effectiveness in distinguishing between different plant species, with certain plant types achieving near-perfect classification.
5.2 Plant disease detection results
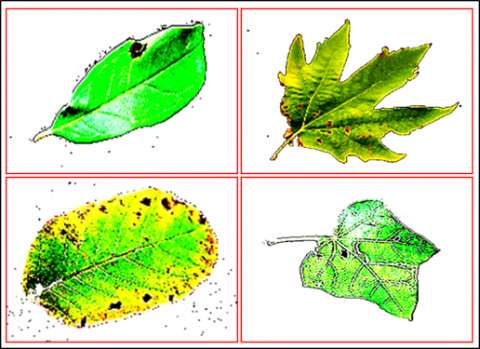
The Figure 8 shows a collection of detected diseased leaf images obtained through our disease detection model using C-MAN model. These images represent a diverse range of plant species and leaf types affected by various diseases. Each image provides a visual insight into the symptoms and manifestations of plant diseases, including discoloration, lesions, spots, and other identifiable characteristics. These detections demonstrate the model's ability to accurately identify and localize disease-afflicted areas on plant leaves, aiding in the early diagnosis and management of plant health.
In the context of plant disease detection, we present the comparison of our proposed model C-MAN performance metrics with its counterparts are CNN [21], ImageNet [39], GoogLeNet [40] and Inception-V4 [41] as summarized in the Table 5.
Figure 8. C-MAN detected disease plant leaves from dataset
Table 5. Performance metrics for plant disease detection
|
Model |
Precision (±) |
Recall (±) |
Accuracy (±) |
F1-Score (±) |
Process Time (±) |
|
CNN |
0.847 (±0.030) |
0.819 (±0.055) |
0.826 (±0.045) |
0.833 (±0.040) |
221.12 (±18.00) |
|
ImageNet |
0.895 (±0.025) |
0.912 (±0.035) |
0.902 (±0.30) |
0.903 (±0.035) |
357.54 (±42.00) |
|
GoogLeNet |
0.907 (±0.035) |
0.931 (±0.025) |
0.912 (±0.030) |
0.919 (±0.030) |
382.17 (±37.00) |
|
InceptionV4 |
0.943 (±0.040) |
0.909 (±0.045) |
0.922 (±0.045) |
0.925 (±0.040) |
344.91 (±35.00) |
|
C-MAN |
0.940 (±0.045) |
0.968 (±0.065) |
0.954 (±0.050) |
0.953 (±0.050) |
359.65 (±18.00) |
The results from Table 5 reveal several noteworthy findings: The baseline CNN model [21] achieved reasonable precision and recall values of approximately 0.847 and 0.819, respectively, indicating decent accuracy in identifying diseased plants, although there is room for improvement. Figure 9 is presenting the comparison of the disease detection time across different plant disease detection models.
In contrast, the ImageNet [39] and GoogLeNet [40] models exhibited enhanced performance metrics, including precision, recall, accuracy, and F1-scores, surpassing the CNN baseline. This improvement can be attributed to their utilization of more intricate architectures and pre-trained features, resulting in superior disease detection capabilities. InceptionV4 [41], while excelling in precision (0.943), demonstrated a relatively lower recall (0.909), indicating its proficiency in correctly identifying diseased plants but with potential limitations in capturing all instances.
Figure 9. Comparison of disease detection time across different plant disease detection models
Figure 10. Plant leaf disease detection accuracy comparisons
Remarkably, the C-MAN model emerged as the top-performing model, boasting a precision of 0.940 and an impressive recall of 0.968, highlighting its effectiveness in disease identification while minimizing false negatives. The observed trends in accuracy and F1-score largely paralleled precision and recall, underscoring the importance of achieving a balance between these metrics. Additionally, the processing time is a crucial consideration, where CNN offers faster processing while ImageNet [39] and GoogLeNet [40] demand greater computational resources. Figure 10 is presenting the leaf disease detection accuracy improvements across different epochs and emphasizing that the our C-MAN model exhibits superior disease detection capabilities compared to its counterparts, holding promise for precise plant disease diagnosis with substantial implications for agricultural practices.
This study presented C-MAN, a novel custom multi-attention network architecture that leverages the power of both CNNs and attention mechanisms for plant leaf classification and disease detection. Through comprehensive analysis of diverse plant species and their associated diseases, C-MAN demonstrated remarkable performance in both tasks. Our C-MAN model achieved outstanding results in plant leaf classification, surpassing state-of-the-art methods with an accuracy of 0.967. Similarly our C-MAN's prowess extended to disease detection as well, achieving an impressive accuracy of 0.954. This demonstrates the model's ability to reliably diagnose plant diseases while minimizing false negatives, offering a valuable tool for early intervention and improved plant health management.
While these results are encouraging, further exploration holds exciting possibilities. Integrating transfer learning from related domains, such as plant image analysis, could significantly enhance accuracy and generalization. Fine-tuning pre-trained models on our diverse dataset presents an opportunity for further performance optimization.
It is mandatory to have conclusions in your paper. This section should include the main conclusions of the research and a comprehensible explanation of their significance and relevance. The limitations of the work and future research directions may also be mentioned. Please do not make another abstract.
[1] Harakannanavar, S.S., Rudagi, J.M., Puranikmath, V.I., Siddiqua, A., Pramodhini, R. (2022). Plant leaf disease detection using computer vision and machine learning algorithms. Global Transitions Proceedings, 3(1): 305-310. https://doi.org/10.1016/j.gltp.2022.03.016
[2] Prakash, R.M., Saraswathy, G.P., Ramalakshmi, G., Mangaleswari, K.H., Kaviya, T. (2017). Detection of leaf diseases and classification using digital image processing. In 2017 International Conference on Innovations in Information, Embedded and Communication Systems (ICIIECS), Coimbatore, India, pp. 1-4. https://doi.org/10.1109/ICIIECS.2017.8275915
[3] Riley, M.B., Williamson, M.R., Maloy, O. (2002). Plant disease diagnosis. The Plant Health Instructor, 10. https://doi.org/10.1094/PHI-I-2002-1021-01
[4] Sunil, C.K., Jaidhar, C.D., Patil, N. (2021). Cardamom plant disease detection approach using EfficientNetV2. IEEE Access, 10: 789-804. https://doi.org/10.1109/ACCESS.2021.3138920
[5] Silviya, S.A., Sriman, B., Shamini, P.B., Elangovan, A., Keerthana, N.V. (2022). Deep learning based plant leaf disease detection and classification. In 2022 4th International Conference on Inventive Research in Computing Applications (ICIRCA), Coimbatore, India, pp. 702-710. https://doi.org/10.1109/ICIRCA54612.2022.9985548
[6] Harshavardhan, K., Krishna, P.A., Geetha, A. (2023). Detection of various plant leaf diseases using deep learning techniques. In 2023 International Conference on Advances in Computing, Communication and Applied Informatics (ACCAI), Chennai, India, pp. 1-6. https://doi.org/10.1109/ACCAI58221.2023.10200031
[7] Shoaib, M., Shah, B., Ei-Sappagh, S., Ali, A., Ullah, A., Alenezi, F., Gechev T, Hussain T, Ali, F. (2023). An advanced deep learning models-based plant disease detection: A review of recent research. Frontiers in Plant Science, 14: 1158933. https://doi.org/10.3389/fpls.2023.1158933
[8] Kuswidiyanto, L.W., Noh, H.H., Han, X. (2022). Plant disease diagnosis using deep learning based on aerial hyperspectral images: A review. Remote Sensing, 14(23): 6031. https://doi.org/10.3390/rs14236031
[9] Arsenovic, M., Karanovic, M., Sladojevic, S., Anderla, A., Stefanovic, D. (2019). Solving current limitations of deep learning based approaches for plant disease detection. Symmetry, 11(7): 939. https://doi.org/10.3390/sym11070939
[10] Dong, Y., Liu, Q., Du, B., Zhang, L. (2022). Weighted feature fusion of convolutional neural network and graph attention network for hyperspectral image classification. IEEE Transactions on Image Processing, 31: 1559-1572. https://doi.org/10.1109/TIP.2022.3144017
[11] Andrew, J., Eunice, J., Popescu, D.E., Chowdary, M.K., Hemanth, J. (2022). Deep learning-based leaf disease detection in crops using images for agricultural applications. Agronomy, 12(10): 2395. https://doi.org/10.3390/agronomy12102395
[12] Ding, Y., Zhang, Z.L., Zhao, X.F., Hong, D.F., Cai, W., Yang, N.J., Wang, B. (2023). Multi-scale receptive fields: Graph attention neural network for hyperspectral image classification. Expert Systems with Applications, 223: 119858. https://doi.org/10.1016/j.eswa.2023.119858
[13] Gu, R., Wang, G., Song, T., Huang, R., Aertsen, M., Deprest, J., Ourselin, S., Vercauteren, T., Zhang, S. (2020). CA-Net: Comprehensive attention convolutional neural networks for explainable medical image segmentation. IEEE Transactions on Medical Imaging, 40(2): 699-711. https://doi.org/10.1109/TMI.2020.3035253
[14] Tan, Q., Xie, W., Tang, H., Li, Y. (2022). Multi-scale attention adaptive network for object detection in remote sensing images. In 2022 5th International Conference on Information Communication and Signal Processing (ICICSP), Shenzhen, China, pp. 218-223. https://doi.org/10.1109/ICICSP55539.2022.10050627
[15] Wang, S., Meng, Y., Gu, Y., Zhang, L., Ye, X., Tian, J., Jiao, L. (2021). Cascade attention fusion for fine-grained image captioning based on multi-layer LSTM. In ICASSP 2021-2021 IEEE International Conference on Acoustics, Speech and Signal Processing (ICASSP), Toronto, ON, Canada, pp. 2245-2249. https://doi.org/10.1109/ICASSP39728.2021.9413691
[16] Xu, M., Huang, K., Chen, Q., Qi, X. (2021). MSSA-net: Multi-scale self-attention network for breast ultrasound image segmentation. In 2021 IEEE 18th International Symposium on Biomedical Imaging (ISBI), Nice, France, pp. 827-831. https://doi.org/10.1109/ISBI48211.2021.9433899
[17] Huang, Y., Chen, J., Zheng, S., Xue, Y., Hu, X. (2021). Hierarchical multi-attention networks for document classification. International Journal of Machine Learning and Cybernetics, 12: 1639-1647. https://doi.org/10.1007/s13042-020-01260-x
[18] Chen, R., Zhang, H., Liu, J. (2022). Multi-attention augmented network for single image super-resolution. Pattern Recognition, 122: 108349. https://doi.org/10.1016/j.patcog.2021.108349
[19] Chen, W., Hong, D., Qi, Y., Han, Z., Wang, S., Qing, L., Huang, Q., Li, G. (2022). Multi-attention network for compressed video referring object segmentation. In Proceedings of the 30th ACM International Conference on Multimedia, pp. 4416-4425. https://doi.org/10.1145/3503161.3547761
[20] Wu, P., Wang, Z., Zheng, B., Li, H., Alsaadi, F.E., Zeng, N. (2023). AGGN: Attention-based glioma grading network with multi-scale feature extraction and multi-modal information fusion. Computers in Biology and Medicine, 152: 106457. https://doi.org/10.1016/j.compbiomed.2022.106457
[21] Zhang, J., Zhou, H., Niu, Y., Lv, J., Chen, J., Cheng, Y. (2021). CNN and multi-feature extraction based denoising of CT images. Biomedical Signal Processing and Control, 67: 102545. https://doi.org/10.1016/j.bspc.2021.102545
[22] Lu, Y., Wu, X., Liu, P., Li, H., Liu, W. (2023). Rice disease identification method based on improved CNN-BiGRU. Artificial Intelligence in Agriculture, 9: 100-109. https://doi.org/10.1016/j.aiia.2023.08.005
[23] Dubey, S.R., Singh, S.K., Chaudhuri, B.B. (2022). Activation functions in deep learning: A comprehensive survey and benchmark. Neurocomputing, 503: 92-108. https://doi.org/10.1016/j.neucom.2022.06.111
[24] Cao, Y., Zhao, Z., Huang, Y., Lin, X., Luo, S., Xiang, B., Yang, H. (2023). Case instance segmentation of small farmland based on Mask R-CNN of feature pyramid network with double attention mechanism in high resolution satellite images. Computers and Electronics in Agriculture, 212: 108073. https://doi.org/10.1016/j.compag.2023.108073
[25] Yang, J., Awais, M., Hossain, A., Yee, L., Haowei, M., Mehedi, I.M., Iskanderani, A.I.M. (2023). Thoughts of brain EEG signal-to-text conversion using weighted feature fusion-based multiscale dilated adaptive DenseNet with attention mechanism. Biomedical Signal Processing and Control, 86: 105120. https://doi.org/10.1016/j.bspc.2023.105120
[26] Li, J., Wang, Q., Xiong, C., Zhao, L., Cheng, W., Xu, X. (2024). AMFF-Net: An attention-based multi-scale feature fusion network for allergic pollen detection. Expert Systems with Applications, 235: 121158. https://doi.org/10.1016/j.eswa.2023.121158
[27] Jia, X., Du, S., Guo, Y., Huang, Y., Zhao, B. (2021). Multi-attention ghost residual fusion network for image classification. IEEE Access, 9: 81421-81431. https://doi.org/10.1109/ACCESS.2021.3079435
[28] Siddharth, S.C., Singh, U., Kaul, A., Jain, S. (2019). A database of leaf images: Practice towards plant conservation with plant pathology. Mendeley Data, V1. https://doi.org/10.17632/hb74ynkjcn.1
[29] Yang, F., Liang, F., Lu, L., Yin, M. (2022). Dual attention-guided and learnable spatial transformation data augmentation multi-modal unsupervised medical image segmentation. Biomedical Signal Processing and Control, 78: 103849. https://doi.org/10.1016/j.bspc.2022.103849
[30] Beddiar, D.R., Oussalah, M., Muhammad, U., Seppänen, T. (2023). A deep learning based data augmentation method to improve COVID-19 detection from medical imaging. Knowledge-Based Systems, 280: 110985. https://doi.org/10.1016/j.knosys.2023.110985
[31] Singh, S., Singh, H., Bueno, G., Deniz, O., Singh, S., Monga, H., Hrisheekesha, P.N., Pedraza, A. (2023). A review of image fusion: Methods, applications and performance metrics. Digital Signal Processing, 104020. https://doi.org/10.1016/j.dsp.2023.104020
[32] Kannammal, G.R., Sivamalar, P., Santhi, P., Vetriselvi, T., Kalpana, V., Nithya, T.M. (2022). Prediction of quality in production using optimized hyper-parameter tuning based deep learning model. Materials Today: Proceedings, 69: 703-709. https://doi.org/10.1016/j.matpr.2022.07.133
[33] Shawki, N., Nunez, R.R., Obeid, I., Picone, J. (2021). On automating hyperparameter optimization for deep learning applications. In 2021 IEEE Signal Processing in Medicine and Biology Symposium (SPMB), Philadelphia, PA, USA, pp. 1-7. https://doi.org/10.1109/SPMB52430.2021.9672266
[34] Tian, Y., Su, D., Lauria, S., Liu, X. (2022). Recent advances on loss functions in deep learning for computer vision. Neurocomputing, 497: 129-158. https://doi.org/10.1016/j.neucom.2022.04.127
[35] Xu, C., Lu, C., Liang, X., Gao, J., Zheng, W., Wang, T., Yan, S. (2015). Multi-loss regularized deep neural network. IEEE Transactions on Circuits and Systems for Video Technology, 26(12): 2273-2283. https://doi.org/10.1109/TCSVT.2015.2477937
[36] Nie, Y., De Santis, L., Carratù, M., O’Nils, M., Sommella, P., Lundgren, J. (2020). Deep melanoma classification with k-fold cross-validation for process optimization. In 2020 IEEE International Symposium on Medical Measurements and Applications (MeMeA), Bari, Italy, pp. 1-6. https://doi.org/10.1109/MeMeA49120.2020.9137222
[37] Doshi, K., Yilmaz, Y. (2020). Road damage detection using deep ensemble learning. In 2020 IEEE International Conference on Big Data (Big Data), Atlanta, GA, USA, pp. 5540-5544. https://doi.org/10.1109/BigData50022.2020.9377774
[38] Hou, L., Xue, J., Lu, K., Hao, L., Rahman, M.M. (2019). A single-stage multi-class object detection method for remote sensing images. In 2019 IEEE Visual Communications and Image Processing (VCIP), Sydney, NSW, Australia, pp. 1-4. https://doi.org/10.1109/VCIP47243.2019.8965940
[39] Benbrahim, H., Behloul, A. (2021). Fine-tuned Xception for image classification on tiny Imagenet. In 2021 International Conference on Artificial Intelligence for Cyber Security Systems and Privacy (AI-CSP), El Oued, Algeria, pp. 1-4. https://doi.org/10.1109/AI-CSP52968.2021.9671150
[40] Jing, C., Cao, S., Shen, Y., Wang, S. (2021). GoogLeNet-like Model for pedestrian attribute detection in surveillance environment. In 2021 7th International Conference on Computer and Communications (ICCC), Chengdu, China, pp. 787-791. https://doi.org/10.1109/ICCC54389.2021.9674698
[41] Chen, F., Wei, J., Xue, B., Zhang, M. (2022). Feature fusion and kernel selective in Inception-v4 network. Applied Soft Computing, 119: 108582. https://doi.org/10.1016/j.asoc.2022.108582