Triveni D. Dhamale*![]() | Sheetal U. Bhandari
| Sheetal U. Bhandari![]() | Varsha K. Harpale
| Varsha K. Harpale![]() | Durgesh Nandan
| Durgesh Nandan![]()
© 2024 The authors. This article is published by IIETA and is licensed under the CC BY 4.0 license (http://creativecommons.org/licenses/by/4.0/).
OPEN ACCESS
Autism spectrum disorder (ASD) is becoming a crucial issue in ages 6 to 17. This disease causes a neurological state that affects social interactions and communication abilities. ASD introduces depression, anxiety, hyperacidity, etc. It may lead to severe disorders in the patients. So, its diagnosis is essential in the early stages. Brain MRI is the popular diagnostic tool used for the detection of ASD. Moreover, with technological advancements, many sophisticated and proven techniques need to be developed for ASD detection. Advanced machine learning and Deep Convolution Neural Networks (DCNN) have attracted the attention of researchers for various applications such as image classification, automotive software engineering, and speech recognition, enabling significant progress in neuroscience. The DL supports improved computational intricacy, the ability to handle larger data, and the high efficiency of the algorithm. However, the DCNN is a well-known algorithm most commonly used for neuro-imaging applications due to the requirement of extensive hyperparameter tuning, data scarcity problems, and inadequate feature representation. This paper discusses ASD detection with functional magnetic resonance imaging (fMRI) using parallel DCNN (PDCNN). The PDCNN helps to acquire distinctive features with different filter kernels at parallel layers to describe the distinct local connectivity features of fMRI images and improve ASD detection accuracy. Also, a Generative Adversarial Network (GAN) is employed for data augmentation, which helps to generate synthetic realistic MRI samples by learning the fundamental distribution of the inputs to diminish the data imbalance problem. The performance of the proposed system is evaluated with a multisite dataset named the Autism Brain Imaging Exchange (ABIDE-I). The suggested PDCNN gives an accuracy of 90.63%, precision of 0.96, recall of 0.87, and F1-score of 0.92. The suggested PDCNN provides improved results and utilizes fewer trainable parameters than the traditional methods.
ABIDE-I, autism spectrum disorder, data augmentation, deep learning, Deep Convolution Neural Network, fMRI, generative adversarial neural network
According to the World Health Organization, ASD affects one child in 160, with a probable incidence of anxiety, attention, mental stress, and depression deficit hyperactivity disorder [1]. Mostly, children from 6 to 17 years of age have ASD, a neurological condition that impairs social interaction and communication abilities. The term ASD defines a group of neurological and mental ability development diseases. A few initial symptoms of ASD include abnormal social interaction and emotional control, limited interest, redundant behaviors, and hypo-reactivity or hyper-reactivity to sensory stimuli [2, 3].
Many autistic people face challenges in learning, growing, controlling, interacting, or specific basic living skills. ASD places a significant financial burden on society and the families of sufferers. An early and precise diagnostic framework is required to separate ASD subjects from normal controls. Non-invasive and neuroimaging approaches have recently attracted researchers to contribute to the additional diagnosis of ASD. For the detection of ASDs, a variety of structural and functional brain imaging modalities are frequently utilized, including structural MRI (sMRI) [4], fMRI [5], diffusion MRI [6], electroencephalography (EEG) [7], magnetoencephalography (MEG) [8], and electrocardiography (ECG) [9]. Structural MRI explores the structural characteristics of the brain. Early age ASD identification is crucial, but it will help children with ASD improve their communication skills and social awareness, thus improving their quality of life [10, 11]. An early diagnosis plays an important role in illness management and proper treatment. Creating a model based on interactions between functional or structural brain regions is crucial in diagnosing neurological illnesses, including epilepsy, Alzheimer's, and autism [12-14]. The fMRI is employed to examine the brain and its structures, which recognizes linked changes in the blood oxygen level-dependent (BOLD) signals from the various parts of the brain. The functional connection between different brain areas that affect global brain networks has been demonstrated to be disrupted by ASD.
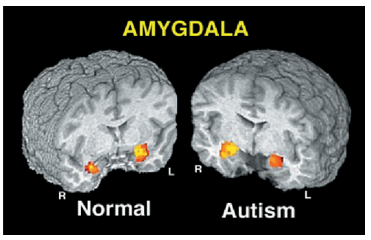
Figure 1 shows the MRI images of an average person and autism patient. For both the autism and normal groups, there was sizable bilateral activity in the amygdala in the familiar face versus fixation condition. The stranger versus fixation comparison and the stranger versus typical face comparison revealed no discernible amygdala activity in either group.
Figure 1. MRI images of a normal person and an autism patient [15]
As a result, the primary objective of the research is to categorize individuals with ASD and healthy controls using brain patterns of functional connectivity [16]. The early detection of ASD can help to provide the proper medical and psychological treatment to the patients. The traditional ASD detection schemes include behavioral analysis and monitoring, which is tedious, time-consuming, and depends upon the expert's knowledge. The vast growth in the population and ASD screening has led to an automatic ASD detection scheme that is faster, more efficient, and more reliable [17].
In categorization and representation learning, the usage of CNN has garnered much interest recently [18]. CNNs are robust classifiers performing well in various applications with significant free parameters [19]. Additionally, CNN models can handle many free parameters and have improved feature extraction accuracy. The CNN model consists of the convolutional, fully connected, normalization, and pooling layers. The CNN model can analyze brain biomarkers in individuals with ASD using fMRI. The CNN models better represent spatial and spectral features from the MRI images, which help to characterize the minor variations in the brain region due to autism. CNN can provide a better balance between the local and global features of the MRI images. However, the effectiveness of the CNN is limited due to extensive hyper-parameter tuning, more significant trainable parameters, data scarcity problems, poor feature discrimination, etc. [20, 21].
The limitations of current methods, such as extensive hyperparameter tuning and data scarcity problems, present the need for a more efficient and accurate ASD detection method. This paper proposes a novel methodology using parallel deep learning networks (PDCNN) to address these challenges.
In the last decade, various DL techniques have been employed for ASD detection using sMRI and fMRI because of their better distinctive properties to characterize functional and structural characteristics of brain MRIs. Heinsfeld et al. [22] explored deep neural network (DNN), which uses anti-correlation between the posterior and anterior regions of the brain for ASD detection. It used a 2-stacked denoising auto-encoder (SDA) for pre-training and DNN for classification to boost the generalization capability and subjectivity in larger datasets for ASD detection systems. The ASD subject has larger anti-correlation in the Supra-marginal and Paracingulate Gyrus regions. Kong et al. [23] presented an ASD detection scheme based on DNN with A.E., which utilized connectivity maps as input to A.E. It used gray matter volume and destrieux atlas for separating cortial regions to detect ASD. Sherkatghanad et al. [24] presented a parallel CNN that used correlation features of rs-fMRI for ASD detection. It has significantly contributed to ASD detection accuracy, but its performance is limited due to a high trainable parameter (4,398,802) and data scarcity problems.
Wang et al. [25] combined Ensemble Learning (E.L.) Multilayer Perceptron (MLP) classifier for ASD detection. The features are acquired using multi-atlas deep feature characterization of fMRI using SDA. Using multiple classification schemes and deep learning-based feature representation leads to a high computational burden on the system. Dvornek et al. [26] used time series fMRI for ASD detection where the long short-term memory (LSTM) based recurrent neural network is used to identify the distinctiveness in the ordinary and ASD samples. High variability in an anatomical region hugely affects the network's performance. Soussia et al. [27] proposed an ASD detection strategy based on T1-weighted MRI based on High-Order Morphological Network Construction (HON) and a supervised ensemble classifier. It used structural information from different cortical areas to design a morphological brain network (MBN). Faria et al. [28] presented DNN that used functional connectivity features for ASD detection. It provided an accuracy of 88.00% on the ABIDE dataset.
Further, Eslami et al. [29] investigated the ASD-DiagNet framework based on correlation features for ASD detection, including an autoencoder for capturing lower dimensional patterns from the functional connectivity features. It used the Extended Frobenius Norm (EROS) for the data augmentation to increase the dataset size and found that data augmentation helped to improve the ASD detection accuracy by 3%. The summary of various recent schemes utilized for ASD detection is presented in Table 1. It focuses on the methodology for ASD detection, dataset, performance metrics, and total trainable parameters used for the deep learning framework.
Table 1. Comparative analysis of previous ASD detection methods
|
Author and Year |
Method |
Dataset |
Accuracy (%) |
Total Trainable Parameters |
|
Wang et al. [25] (2020) |
MLP and EL |
ABIDE-I |
74.52 |
- |
|
Heinsfeld et al. [22] (2018) |
DNN |
ABIDE-I |
70 |
- |
|
Dvornek et al. [26] (2017) |
RNN-LSTM |
ABIDE-I |
68.50 |
- |
|
Rajat et al. [30] (2020) |
3D CNN |
ABIDE-I |
62.00 |
257585 |
|
Sherkatghanad et al. [24] (2020) |
Parallel CNN |
ABIDE-I |
70.22 |
4398802 |
|
Faria Subah et al. [28] (2021) |
DCNN |
ABIDE-I |
88 |
- |
Deep learning-based ASD detection techniques have significantly improved over ML-based ASD detection techniques. However, the performance of the DL architecture is limited because of extensive hyper-parameter tuning, more significant trainable parameters, data scarcity problems, poor feature discrimination, etc. This paper presents autism spectrum disorder detection using the novel PDCNN and generative adversarial neural network (GAN).
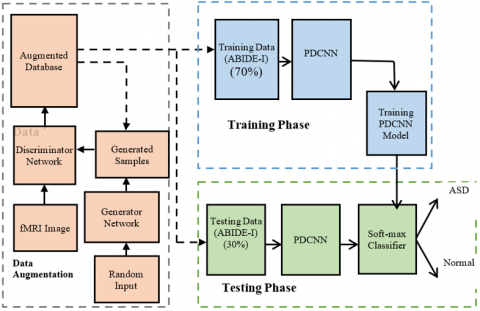
Figure 2 explores the process flow of the suggested ASD detection scheme that includes data augmentation, training, and testing phases to classify normal and ASD patients. The significant offerings of the suggested ASD scheme are summarized as follows:
The arrangement of the remaining article is as follows: Section II describes information regarding the recent trends in ASD using deep learning. Section III gives a detailed description of the dataset and data augmentation using the GAN and PDCNN framework. Further, section IV delivers the discussions on simulation outcomes. Lastly, it offers the concise findings of the work and provides future scope.
Figure 2. Process flow of the proposed method
3.1 Dataset: ABIDE-I
The ABIDE, a collaborative project including neuroimaging and phenotypic data acquired from 1,112 individuals, is the most popular data-driven technique for diagnosing autism and exploring its biomarkers. ABIDE-I dataset is a global multisite database comprising 1,112 samples of phenotypic data and structural, resting-state fMRI from 16 sites, including 539 people with ASD and 573 others [31]. The proposed system uses preprocessed fMRI images from the ABIDE-I dataset. The images are resized to 128×128 pixels for computational simplicity.
3.2 Data augmentation using GAN
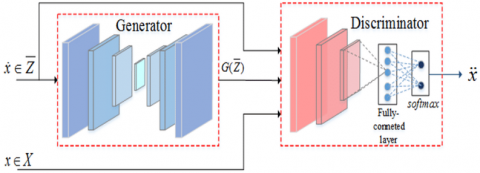
The availability of ASD MRI images is challenging due to inadequate resources, unavailability of experts for assessing MRI images, ethical issues, etc. The lower and uneven samples in the training dataset lead to data scarcity and often result in poor ASD accuracy. Thus, data augmentation is essential to create the synthetic dataset for ASD detection. The following Figure 3 shows the GAN network.
Figure 3. GAN generator and discriminator working [29]
The GAN creates the synthetic data samples from the available samples and increases the dataset's number of samples. It consists of a generator (GN) and discriminator network (DN). The GAN is an unsupervised deep learning architecture. The GN generates the enhanced sample by accepting the arbitrary input. The DN compares the original sample to an enhanced sample produced by the GN to distinguish an authentic sample from a fraudulent one. The original fMRI images are utilized as the input to the GAN network in the deliberate effort to expand the database. The GAN is trained for 500 epochs with an initial learning rate of 0.01 and batch size of 128. The predicted absolute error E(GN, DN) for the GN and DN is given by Eq. (1).
$E(G N, D N)=\frac{1}{2} E_{x \sim P t}[1-D N(x)]+\frac{1}{2} E_{x \sim P Z}[D N(G N(z))]$ (1)
During the training of GAN, GN tries to lessen the error whereas DN aims to increase the error in training and synthetic samples using Eq. (2).
$\min _{G N}\left(\max _{D N} E(G N, D N)\right)$ (2)
Table 2. Original and augmented dataset (ABIDE-I –fMRI)
|
Database Site |
Original Dataset |
Augmented Dataset |
||||
|
ASD |
TD |
Total |
ASD |
TD |
Total |
|
|
Caltech |
21 |
17 |
38 |
100 |
100 |
200 |
|
KKI |
20 |
35 |
55 |
100 |
100 |
200 |
|
SDSU |
12 |
24 |
36 |
100 |
100 |
200 |
|
Leuven |
30 |
34 |
64 |
100 |
100 |
200 |
|
Trinity |
24 |
25 |
49 |
100 |
100 |
200 |
|
MaxMun |
23 |
34 |
57 |
100 |
100 |
200 |
|
USM |
58 |
43 |
101 |
100 |
100 |
200 |
|
NYU |
105 |
79 |
184 |
100 |
100 |
200 |
|
OHSU |
13 |
15 |
28 |
100 |
100 |
200 |
|
Yale |
28 |
28 |
56 |
100 |
100 |
200 |
|
Olin |
20 |
16 |
36 |
100 |
100 |
200 |
|
Pitt |
31 |
26 |
57 |
100 |
100 |
200 |
|
SBL |
14 |
16 |
30 |
100 |
100 |
200 |
|
Stanford |
21 |
19 |
40 |
100 |
100 |
200 |
|
UCLA |
56 |
43 |
99 |
100 |
100 |
200 |
|
UM |
68 |
77 |
145 |
100 |
100 |
200 |
|
Total |
544 |
531 |
1075 |
1600 |
1600 |
3200 |
GN(z) signifies the GN output, z denotes the random noise factor, DN(x) represents the DN output, x represents the training sample, Pt denotes the likelihood of real MRI data, and Pz represents the likelihood of artificial MRI. A total of 100 synthetic images are created per class for every site using GAN to overcome the data scarcity, as described in Table 2. The Adam optimization algorithm trains the GAN algorithm for 200 epochs. The cross-entropy function is used for the loss evaluation during training, and the initial learning rate is set to 0.001.
3.3 PDCNN architecture
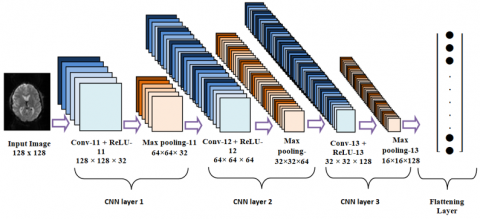
The sequential DCNN uses cascaded layers of the CNN layers with uniform convolution filter size. However, different filter sizes can help capture the fMRI image's various local and global characteristics, which can be missed in sequential DCNN. Also, increasing the layer in sequential DCNN may lead to a vanishing gradient problem and a poor detection rate [32-35].
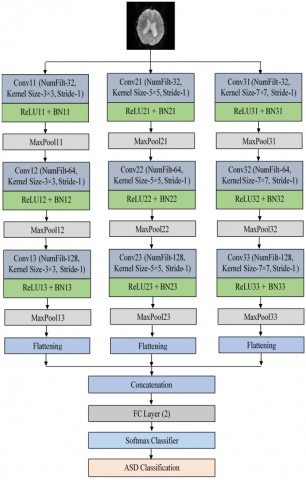
Thus, the proposed PDCNN includes 3 parallel arms of a sequential DCNN with different filter sizes to combine the attributes captured by various filters. Each parallel arm encompasses three layered DCNNs that include the convolution layer (Conv), rectified linear unit (ReLU), batch normalization (BN) layer, and maximum pooling layer (MaxPool) as illustrated in Figure 2. The first, second, and third parallel arm of the PDCNN uses a convolution filter with a size of 3×3, 5×5, and 7×7, respectively. However, every sequential DCNN at the parallel arm uses 32, 64, and 128 convolution filters in each CNN layer.
The original image with 128×128 pixels dimensions is fed to three parallel arms. The output of the third MaxPool layer of all three parallel arms is assembled in vector, which is further provided to a fully connected layer (FC) that connects each neuron of the parallel and sequential arm and help in boosting the connectivity and correlation between different global and local features of the fMRI image. Lastly, the Softmax classifier layer (Softmax) is employed to classify regular and ASD patients.
3.4 Deep convolutional neural network
The CNN has shown good spatial representation capability for biomedical images. It offers high-order abstract-level features and assists in capturing hierarchical features. Each DCNN layer includes Conv, BN, ReLU, and MaxPool layers. Increasing the Conv layers boosts the feature distinctiveness of the fMRIs.
A. Convolution Layer
In the Conv layer, the fMRI is converse with a filter size of w × w, as given in Eqs. (3) and (4). It transforms the input brain fMRI into high-dimensional feature maps. Because of its high level of abstraction, this layer is frequently known as a hidden feature extractor.
$c(x, y)=i m * f$ (3)
$C(x, y)=\sum_{i=1}^{r o w} \sum_{j=1}^{c o l} i m(x-i, y-j) . f(i, j)$, (4)
where, im denotes the original picture, C denotes the Conv layer output, and f represents the Conv filter kernel. Eq. (5) can determine the Conv layer output's dimensions while accounting for padding and striding.
$D_{\text {out }}=\left[\frac{D_{\text {in }}-2 P-w}{s}+1\right]$ (5)
Here, the filtered measurements are w. The parameters p and s are padding sizes in pixels, striding value in pixels, and initial and output image dimensions, respectively.
Eq. (6) provides the Conv layer output's multidimensional dimensions.
$[r o w, c o l, k] *\left[w, w, N_f\right]=\left\{\frac{r o w+2 p-w}{s}+1, \frac{c o l+2 p-w}{s}+1, N_f\right\}$, (6)
where, $N_f$ indicates the number of image channels, w depicts the dimension of the filter, row represents the fMRI’s width, col denotes the image's height, $N_f$ denotes the number of Conv filters, and S means the stride value. Before training, the Conv filter weights are set randomly and then changed to their optimal value using learning algorithms like the Adam optimizer, stochastic gradient descent (SGD), RMSProp, and mini-batch gradient descent (MBGD).
4.1 Performance and evaluation metrics
The proposed ASD detection scheme is simulated using MATLAB R2018b on a personal computer with a core i5 processor with 8 GB RAM, 2.64 GHz speed, and a Windows operating system. Various quantitative and qualitative criteria validate the suggested scheme's results. Eqs. (14)-(17) describe precision, recall, accuracy, and F1-score, where TP=True Positives, TN=True Neatives, FP= False Positives, and FN= False Negatives. Accuracy signifies the total number of accurate predictions over complete predictions, including TP, TN, FP, and FN. Precision gives the true positive predictions over total positive predictions, and recall signifies the negative predictive values. F1-score is the relative parameter consisting of precision and recall values.
Precision $=\frac{\mathrm{TP}}{\mathrm{TP}+\mathrm{FP}}$ (14)
Recall $=\frac{\mathrm{TN}}{\mathrm{TN}+\mathrm{FN}}$ (15)
$\operatorname{Accuracy}(\%)=\frac{\mathrm{TP}+\mathrm{TN}}{\mathrm{TP}+\mathrm{TN}+\mathrm{FP}+\mathrm{FN}} \times 100$ (16)
$\mathrm{F} 1-$ Score $=\frac{2 * \text { Precision } * \text { Recall }}{\text { Precision }+ \text { Recall }}$ (17)
4.2 Parameter configurations
Table 3 describes trainable parameters and activation maps of the various layers. For ASD detection, the suggested PDCNN offered 93120, 257472, and 504000 trainable parameters for three parallel arms with 3×3 filter, 5×5 filter, and 5×5 filter, respectively. The proposed PDCNN uses 920130 trainable parameters overall. Table 3 provides the parameter configurations of the proposed PDCNN architecture, which depicts the filter dimensions, padding value, striding value, activation map, and total trainable parameters for each parallel arm of the proposed PDCNN. The first, second, and third parallel arms of the proposed PDCNN consist of 93120, 52288, and 50400 trainable parameters, respectively, and result in total trainable parameters of 920130.
4.3 Simulation results and discussions
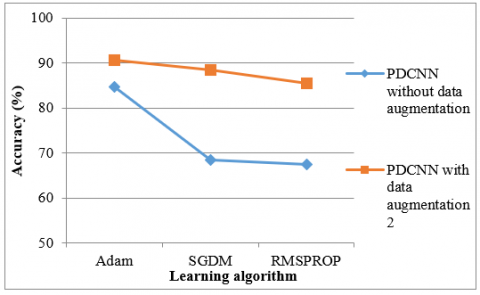
The outcomes of the PDCNN are assessed for the diverse learning techniques, such as Adam, SGDM, and RMSPROP, with an initial learning rate of 0.01, as described in Table 4. The data augmentation using GAN helps to improve the F1-score, which shows the balance between the qualitative (precision) and quantitative results of ASD detection. The performance evaluation for different learning shows that the Adam optimizer provides superior accuracy (90.63%) compared with SGDM (88.50) and RMSPROP (85.50%). Figure 4 illustrates the performance proposed by PDCNN for accuracy for different learning rates.
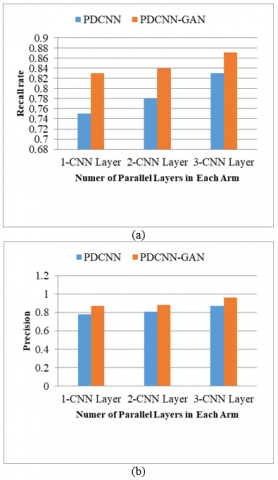
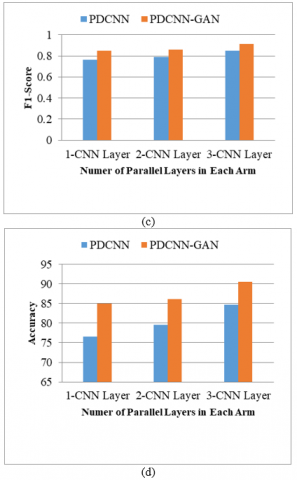
The outcomes of the PDCNN are estimated for the different layers of CNN in each parallel arm, as described in Figure 5. It is noted that the overall performance of ASD detection increases as the number of layers in each parallel arm increases. The three CNN layers use 32, 64, and 128 filters, respectively, and increasing the filter number helps improve the feature distinctiveness and connectivity. The PDCNN with one CNN, two CNN, and three CNN layers in each parallel arm provides an accuracy of 84.96%, 86.14%, and 90.63%, respectively, for ASD detection for Adam optimizer. Increasing the layer beyond three layers results in a more considerable increase in trainable parameters and shows minor improvement in the results; therefore, the parallel arms are limited to a three-layered structure. The increase in the parallel layers with different filters at every parallel arm helps to improve the feature distinctiveness of the fMRI images. It provides a better local description of the local fine, medium, and coarse texture with smaller (3×3), medium (5×5), and larger (7×7) convolution filter windows. The larger layers assist in improving the brain image's local and global connectivity and correlation features.
Table 5 shows the effect of the initial learning rate on the ADAM optimizer, which provides superior results compared with the SGDM and RMSPROP optimizers. The PDCNN-Adam offers an accuracy of 90.63% for an initial learning rate of 0.01. It shows that the high learning rate value (0.5) converges the model quickly but results in lesser accuracy (78.76%). However, a lower value means takes more time to learn the model and adds a computational burden on the system as it provides an accuracy of 86.14%.
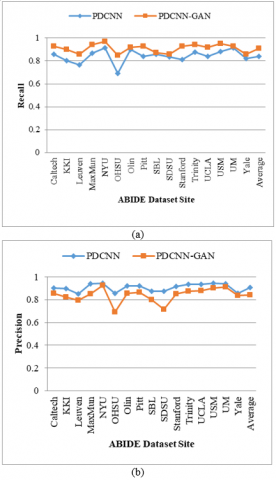
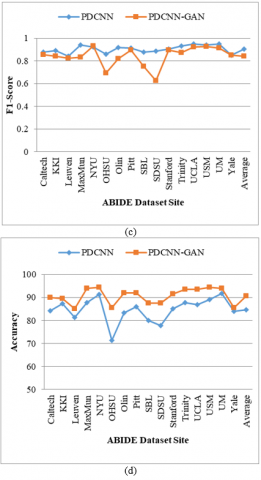
The PDCNN’s results for individual sites from the ABIDE dataset are illustrated in Figure 6 for PDCNN and PDCNN-GAN with three parallel arms. It is observed that sites OHSU, Pitt, and SBL show poor F1 scores because of an imbalance between precision and recall rates due to lower training samples than other sites. However, the proposed PDCNN-GAN helps minimize the class imbalance issue due to varying dataset sizes and helps to improve the F1 score for all the sites. The PDCNN-GAN provides a higher accuracy of 94.50% for the NYU and USM sites, whereas it gives a lower accuracy of 85.00% for the Leuven site.
Figure 4. Proposed PDCNN architecture for ASD detection
Figure 5. Parallel CNN layers of the proposed scheme
Table 3. Proposed PDCNN configurations
|
Layer |
Filter Dimensions |
Padding |
Stride |
Activation Map |
Total Trainable Parameters |
|
Input Image |
- |
- |
- |
128×128× 1 |
- |
|
Conv-11 |
3×3×32 |
[1,1] |
[1,1] |
128×128× 32 |
320 |
|
BN-11 |
|
|
|
128×128× 32 |
64 |
|
ReLU-11 |
|
|
|
128×128× 32 |
- |
|
MaxPool-11 |
- |
- |
[2,2] |
64×64× 32 |
- |
|
Conv-12 |
3×3×64 |
[1,1] |
[1,1] |
64×64× 64 |
18496 |
|
BN-12 |
|
|
|
64×64× 64 |
128 |
|
ReLU-12 |
|
|
|
64×64× 64 |
- |
|
MaxPool-12 |
- |
- |
[2,2] |
32×32× 64 |
- |
|
Conv-13 |
3×3×128 |
[1,1] |
[1,1] |
32×32×128 |
73856 |
|
BN-13 |
|
|
|
32×32×128 |
256 |
|
ReLU-13 |
|
|
|
32×32×128 |
- |
|
MaxPool-13 |
|
|
|
16×16×128 |
- |
|
Conv-21 |
5×5×32 |
[1,1] |
[1,1] |
128×128× 32 |
832 |
|
BN-21 |
|
|
|
128×128× 32 |
64 |
|
ReLU-21 |
|
|
|
128×128× 32 |
- |
|
MaxPool-21 |
- |
- |
[2,2] |
64×64× 32 |
- |
|
Conv-22 |
5×5×64 |
[1,1] |
[1,1] |
64×64× 64 |
51264 |
|
BN-22 |
|
|
|
64×64× 64 |
128 |
|
ReLU-22 |
|
|
|
64×64× 64 |
- |
|
MaxPool-22 |
- |
- |
[2,2] |
32×32× 64 |
- |
|
Conv-23 |
5×5×128 |
[1,1] |
[1,1] |
32×32×128 |
204928 |
|
BN-23 |
|
|
|
32×32×128 |
256 |
|
ReLU-23 |
|
|
|
32×32×128 |
- |
|
MaxPool-23 |
|
|
|
16×16×128 |
- |
|
Conv-31 |
7×7×32 |
[1,1] |
[1,1] |
128×128× 32 |
1600 |
|
BN-31 |
|
|
|
128×128× 32 |
64 |
|
ReLU-31 |
|
|
|
128×128× 32 |
- |
|
MaxPool-31 |
- |
- |
[2,2] |
64×64× 32 |
- |
|
Conv-32 |
7×7×64 |
[1,1] |
[1,1] |
64×64× 64 |
100416 |
|
BN-32 |
|
|
|
64×64× 64 |
128 |
|
ReLU-32 |
|
|
|
64×64× 64 |
- |
|
MaxPool-32 |
- |
- |
[2,2] |
32×32× 64 |
- |
|
Conv-33 |
7×7×128 |
[1,1] |
[1,1] |
32×32×128 |
401536 |
|
BN-33 |
|
|
|
32×32×128 |
256 |
|
ReLU-33 |
|
|
|
32×32×128 |
- |
|
MaxPool-33 |
|
|
|
16×16×128 |
- |
|
F.C. (2 layers) |
- |
- |
- |
1×1× 2 |
65538 |
|
SoftMax |
- |
- |
- |
1×1× 2 |
- |
Table 4. Performance comparison of proposed PDCNN for various learning algorithms
|
Method |
Learning Algorithm |
Without Data Augmentation |
With Data Augmentation |
||||||
|
Precision |
Recall |
F1-score |
Accuracy |
Precision |
Recall |
F1-score |
Accuracy |
||
|
DCNN |
Adam |
0.78 |
0.75 |
0.76 |
76.56 |
0.87 |
0.83 |
0.85 |
84.96 |
|
PDCNN-2 Layers |
0.81 |
0.78 |
0.79 |
79.53 |
0.89 |
0.88 |
0.89 |
88.50 |
|
|
PDCNN-3 Layers |
0.87 |
0.83 |
0.85 |
84.74 |
0.96 |
0.87 |
0.92 |
90.63 |
|
|
DCNN |
SGDM |
0.61 |
0.61 |
0.61 |
60.84 |
0.69 |
0.65 |
0.67 |
67.26 |
|
PDCNN-2 Layers |
0.66 |
0.65 |
0.65 |
65.30 |
0.87 |
0.83 |
0.85 |
84.96 |
|
|
PDCNN-3 Layers |
0.69 |
0.69 |
0.69 |
68.56 |
0.91 |
0.86 |
0.88 |
88.50 |
|
|
DCNN |
RMSPROP |
0.64 |
0.61 |
0.63 |
62.98 |
0.70 |
0.73 |
0.72 |
73.80 |
|
PDCNN-2 Layers |
0.66 |
0.65 |
0.66 |
65.21 |
0.83 |
0.85 |
0.84 |
85.20 |
|
|
PDCNN-3 Layers |
0.69 |
0.65 |
0.67 |
67.44 |
0.84 |
0.85 |
0.84 |
85.50 |
|
Table 5. Comparison of PDCNN-based ASD with the previous state of arts
|
Author and Year |
Method |
Accuracy (%) |
Total Trainable Parameters |
|
Wang et al. [25] (2020) |
MLP and EL |
74.52 |
- |
|
Heinsfeld et al. [22] (2018) |
DNN |
70 |
- |
|
Dvornek et al. [26] (2017) |
RNN-LSTM |
68.50 |
- |
|
Rajat et al. [30] (2020) |
3D CNN |
62.00 |
257585 |
|
Sherkatghanad et al. [24] (2020) |
Parallel CNN |
70.22 |
4398802 |
|
Subah et al. [28] (2021) |
DCNN |
88 |
- |
|
Proposed Method |
PDCNN (2L)-GAN |
88.60 |
416130 |
|
PDCNN (3L)-GAN |
90.63 |
920130 |
Figure 6. Performance of proposed PDCNN for different learning algorithms
The results of the PDCNN for the distinct numbers of the CNN layers is provided in Figure 7. The outcomes are analyzed for CNN's one, two, and three layers. It is noted that the three-layered framework provides better feature representation and accuracy. The outcomes of the PDCNN are also analyzed for the individual sites from the ABIDE-I dataset, as shown in Figure 8.
Figure 7. Performance comparison of proposed PDCNN-based ASD for different numbers of CNN layers in each parallel arm a) Recall b) Precision c) F1-score d) Accuracy
Figure 8. Performance comparison for an individual site of ABIDE-I dataset a) Recall b) Precision c) F1-score d) Accuracy
The results of PDCNN are compared with previous ASD detection schemes, which have used the ABIDE dataset for the experimental evaluations, as described in Table 5. The proposed method outpaces existing deep learning-based ASD detection systems regarding overall accuracy.
Rajat et al. [30] investigated the 3D-CNN that used 257585 trainable parameters but resulted in a lower accuracy of 62.00%. The parallel CNN presented by Sherkatghanad et al. utilized 4398802 trainable parameters and provided 70.22% accuracy in ASD detection on the ABIDE-I dataset. The proposed PDCNN can train with fewer trainable parameters (920130) and attain superior accuracy than the existing DL-based state-of-the-art. The suggested PDCNN requires 416130 and 920130 trainable parameters for two and three parallel layers, respectively.
ASD is a severe disease in the later stages, giving rise to high depression and anxiety and may lead to severe health problems. Hence, its detection is to be done in the early stages. Researchers have proposed different methodologies for its detection. Many researchers for the detection of ASD present traditional CNN. The dataset samples in other publicly available databases for experimentation are of limited sizes. There are certain constraints to employing CNN, such as extensive hyper-parameter tuning, data scarcity, etc. Limited dataset samples could give rise to overfitting during the training of neural networks. Hence, it is necessary to enhance the sample size of the dataset.
Thus, a novel methodology is proposed and implemented in this work that utilizes PDCNN for detection purposes and GAN for data augmentation to increase sample sizes of datasets.
The PDCNN assists in acquiring a better correlation between the connectivity and correlation features of fMRI images for ASD detection with the help of a parallel arm with variable filter size. The proposed PDCNN achieved remarkable ASD detection accuracy with fewer trainable parameters than the traditional state-of-the-art.
The accuracies of the models proposed by different researchers range from 62% to 88%, with trainable parameters not less than 1268160. The proposed PDCNN provides improved accuracy of 90.63% and 920130 trainable parameters, significantly improving over traditional state-of-the-art CNN methodologies. The proposed PDCNN is less complex, lightweight, and faster than the previous state of the arts. The GAN-based data augmentation helps to tackle the data scarcity difficulty arising from lower and unequal training samples in the data sets.
In the future, the results of the PDCNN could be improved for massive data to increase ASD detection accuracy. Also, the system's performance could be analyzed in real scenarios by collecting actual dataset samples to generalize the proposed methodology. The effectiveness of the PDCNN can be studied for various genders and age groups. The PDCNN method can further be used to classify the grades of detected ASD and explore the risk and severity of the disease.
The datasets analyzed for this study are available at the ABIDE-I repository [31].
The authors declare no conflict of interest.
[1] Autism spectrum disorder. https://www.who.int/news-room/fact-sheets/detail/autism-spectrum-disorders, accessed on January 5, 2022.
[2] de Belen, R.A.J., Bednarz, T., Sowmya, A., Del Favero, D. (2020). Computer vision in autism spectrum disorder research: A systematic review of published studies from 2009 to 2019. Translational Psychiatry, 10(1): 333. https://doi.org/10.1038/s41398-020-01015-w
[3] Radhakrishnan, M., Boruah, S., Ramamurthy, K. (2022). EEG-based anomaly detection for autistic kids – a pilot study. Traitement du Signal, 39(3): 1005-1012. https://doi.org/10.18280/ts.390327
[4] Walsh, M.J., Wallace, G.L., Gallegos, S.M., Braden, B.B. (2021). Brain-based sex differences in autism spectrum disorder across the lifespan: A systematic review of structural MRI, fMRI, and DTI findings. NeuroImage: Clinical, 31: 102719. https://doi.org/10.1016/j.nicl.2021.102719
[5] Dichter, G.S. (2012). Functional magnetic resonance imaging of autism spectrum disorders. Dialogues in Clinical Neuroscience, 14(3): 319-351. https://doi.org/10.31887/DCNS.2012.14.3/gdichter
[6] Conti, E., Mitra, J., Calderoni, S., Pannek, K., Shen, K.K., Pagnozzi, A., Rose, S., Mazzotti, S., Scelfo, D., Tosetti, M., Muratori, F. (2017). Network over‐connectivity differentiates autism spectrum disorder from other developmental disorders in toddlers: A diffusion MRI study. Human Brain Mapping, 38(5): 2333-2344. https://doi.org/10.1002/hbm.23520
[7] Sinha, T., Munot, M.V., Sreemathy, R. (2022). An efficient approach for detection of autism spectrum disorder using electroencephalography signal. IETE Journal of Research, 68(2): 824-832. https://doi.org/10.1080/03772063.2019.1622462
[8] Barik, K., Watanabe, K., Bhattacharya, J., Saha, G. (2022). A fusion-based machine learning approach for autism detection in young children using magnetoencephalography signals. Journal of Autism and Developmental Disorders, 53: 4830-4848. https://doi.org/10.1007/s10803-022-05767-w
[9] Bagirathan, A., Selvaraj, J., Gurusamy, A., Das, H. (2021). Recognition of positive and negative valence states in children with autism spectrum disorder (ASD) using discrete wavelet transform (DWT) analysis of electrocardiogram signals (ECG). Journal of Ambient Intelligence and Humanized Computing, 12: 405-416. https://doi.org/10.1007/s12652-020-01985-1
[10] Guo, X., Wang, J., Wang, X., Liu, W., Yu, H., Xu, L., Li, H., Wu, J., Dong, M., Tan, W., Chen, W. (2021). Diagnosing autism spectrum disorder in children using conventional MRI and apparent diffusion coefficient-based deep learning algorithms. European Radiology, 32: 761-770. https://doi.org/10.1007/s00330-021-08239-4
[11] Frewer, V., Gilchrist, C.P., Collins, S.E., Williams, K., Seal, M.L., Leventer, R.J., Amor, D.J. (2021). A systematic review of brain MRI findings in monogenic disorders strongly associated with autism spectrum disorder. Journal of Child Psychology and Psychiatry, 62(11): 1339-1352. https://doi.org/10.1111/jcpp.13510
[12] Haweel, R., AbdElSabour Seada, N., Ghoniemy, S., ElBaz, A. (2021). A review on autism spectrum disorder diagnosis using task-based functional MRI. International Journal of Intelligent Computing and Information Sciences, 21(2): 23-40. https://dx.doi.org/10.21608/ijicis.2021.75525.1090
[13] Bhangale, K., Mohanaprasad, K. (2022). Speech emotion recognition using mel frequency log spectrogram and deep convolutional neural network. In: Sivasubramanian, A., Shastry, P.N., Hong, P.C. (eds) Futuristic Communication and Network Technologies. VICFCNT 2020. Lecture Notes in Electrical Engineering, vol 792. Springer, Singapore. https://doi.org/10.1007/978-981-16-4625-6_24
[14] Dekhil, O., Ali, M., Haweel, R., Elnakib, Y., Ghazal, M., Hajjdiab, H., Fraiwan, L., Shalaby, A., Soliman, A., Mahmoud, A., Keynton, R., Casanova, M.F., Barnes, G.B., El-Baz, A. (2020). A comprehensive framework for differentiating autism spectrum disorder from neurotypicals by fusing structural MRI and resting state functional MRI. Seminars in Pediatric Neurology, 34: 100805. https://doi.org/10.1016/j.spen.2020.100805
[15] Pierce, K., Haist, F., Sedaghat, F., Courchesne, E. (2004). The brain response to personally familiar faces in autism: Findings of fusiform activity and beyond. Brain, 127(12): 2703-2716. https://doi.org/10.1093/brain/awh289
[16] Li, X., Zhang, K., He, X., Zhou, J., Jin, C., Shen, L., Gao, Y., Tian, M., Zhang, H. (2021). Structural, functional, and molecular imaging of autism spectrum disorder. Neuroscience Bulletin, 37: 1051-1071. https://doi.org/10.1007/s12264-021-00673-0
[17] Katuwal, G.J., Baum, S.A., Michael, A.M. (2018). Early brain imaging can predict autism: Application of machine learning to a clinical imaging archive. BioRxiv. https://doi.org/10.1101/471169
[18] Bhangale, K.B., Kothandaraman, M. (2023). Speech emotion recognition using the novel PEmoNet (Parallel Emotion Network). Applied Acoustics, 212: 109613. https://doi.org/10.1016/j.apacoust.2023.109613
[19] Bhangale, K., Kothandaraman, M. (2023). Speech emotion recognition based on multiple acoustic features and deep convolutional neural network. Electronics, 12(4): 839. https://doi.org/10.3390/electronics12040839
[20] Chattopadhyay, A., Maitra, M. (2022). MRI-based brain tumor image detection using CNN based deep learning method. Neuroscience Informatics, 2(4): 100060. https://doi.org/10.1016/j.neuri.2022.100060
[21] Bhangale, K.B., Kothandaraman, M. (2022). Survey of deep learning paradigms for speech processing. Wireless Personal Communications, 125(2): 1913-1949. https://doi.org/10.1007/s11277-022-09640-y
[22] Heinsfeld, A.S., Franco, A.R., Craddock, R.C., Buchweitz, A., Meneguzzi, F. (2018). Identification of autism spectrum disorder using deep learning and the ABIDE dataset. NeuroImage: Clinical, 17: 16-23. https://doi.org/10.1016/j.nicl.2017.08.017
[23] Kong, Y., Gao, J., Xu, Y., Pan, Y., Wang, J., Liu, J. (2019). Classification of autism spectrum disorder by combining brain connectivity and deep neural network classifier. Neurocomputing, 324: 63-68. https://doi.org/10.1016/j.neucom.2018.04.080
[24] Sherkatghanad, Z., Akhondzadeh, M., Salari, S., Zomorodi-Moghadam, M., Abdar, M., Acharya, U.R., Khosrowabadi, R., Salari, V. (2020). Automated detection of autism spectrum disorder using a convolutional neural network. Frontiers in Neuroscience, 13: 1325. https://doi.org/10.3389/fnins.2019.01325
[25] Wang, Y., Wang, J., Wu, F.X., Hayrat, R., Liu, J. (2020). AIMAFE: Autism spectrum disorder identification with multi-atlas deep feature representation and ensemble learning. Journal of Neuroscience Methods, 343: 108840. https://doi.org/10.1016/j.jneumeth.2020.108840
[26] Dvornek, N.C., Ventola, P., Pelphrey, K.A., Duncan, J.S. (2017). Identifying autism from resting-state fMRI using long short-term memory networks. In: Wang, Q., Shi, Y., Suk, HI., Suzuki, K. (eds) Machine Learning in Medical Imaging. MLMI 2017. Lecture Notes in Computer Science, vol 10541. Springer, Cham. https://doi.org/10.1007/978-3-319-67389-9_42
[27] Soussia, M., Rekik, I. (2018). Unsupervised manifold learning using high-order morphological brain networks derived from T1-w MRI for autism diagnosis. Frontiers in Neuroinformatics, 12: 70. https://doi.org/10.3389/fninf.2018.00070
[28] Subah, F.Z., Deb, K., Dhar, P.K., Koshiba, T. (2021). A deep learning approach to predict autism spectrum disorder using multisite resting-state fMRI. Applied Sciences, 11(8): 3636. https://doi.org/10.3390/app11083636
[29] Eslami, T., Mirjalili, V., Fong, A., Laird, A.R., Saeed, F. (2019). ASD-DiagNet: A hybrid learning approach for detection of autism spectrum disorder using fMRI data. Frontiers in Neuroinformatics, 13: 70. https://doi.org/10.3389/fninf.2019.00070
[30] Thomas, R.M., Gallo, S., Cerliani, L., Zhutovsky, P., El-Gazzar, A., van Wingen, G. (2020). Classifying autism spectrum disorder using the temporal statistics of resting-state functional MRI data with 3D convolutional neural networks. Frontiers in Psychiatry, 11. https://doi.org/10.3389/fpsyt.2020.00440
[31] Craddock, C., Benhajali, Y., Chu, C., Chouinard, F., Evans, A., Jakab, A., Khundrakpam, B.S., Lewis, J.D., Li, Q., Milham, M., Yan, C. (2013). The Neuro Bureau preprocessing initiative: Open sharing of preprocessed neuroimaging data and derivatives. Frontiers in Neuroinformatics, 7: 27.
[32] Zhang, Y., Li, H., Zheng, Y., Yao, S., Jiang, J. (2021). Enhanced DNNs for malware classification with GAN-based adversarial training. Journal of Computer Virology and Hacking Techniques, 17: 153-163. https://doi.org/10.1007/s11416-021-00378-y
[33] Radhakrishnan, M., Ramamurthy, K., Choudhury, K.K., Won, D., Manoharan, T.A. (2021). Performance analysis of deep learning models for detection of autism spectrum disorder from EEG signals. Traitement du Signal, 38(3): 853-863. https://doi.org/10.18280/ts.380332
[34] Mohi ud Din, Q., Jayanthy, A.K. (2022). Wavelet scattering transform and deep learning networks based autism spectrum disorder identification using EEG signals. Traitement du Signal, 39(6): 2069-2076. https://doi.org/10.18280/ts.390619
[35] Radhakrishnan, M., Ramamurthy, K., Kothandaraman, A., Madaan, G., Machavaram, H. (2021). Investigating EEG signals of autistic individuals using detrended fluctuation analysis. Traitement du Signal, 38(5): 1515-1520. https://doi.org/10.18280/ts.380528