Bharati Sanjay Ainapure![]() | Bhargav Appasani*
| Bhargav Appasani*![]() | Adriana-Gabriela Schiopu
| Adriana-Gabriela Schiopu![]() | Mihai Oproescu
| Mihai Oproescu![]() | Nicu Bizon
| Nicu Bizon![]()
© 2024 The authors. This article is published by IIETA and is licensed under the CC BY 4.0 license (http://creativecommons.org/licenses/by/4.0/).
OPEN ACCESS
COVID-19 is one of the deadly diseases that affected the global health system. It is difficult to diagnose COVID-19, as it shows the symptoms of the common cold. Therefore, effective screening techniques play a significant role in the timely detection of this disease. Existing techniques such as real-time reverse transcriptase-polymerase chain reaction (RT-PCR), require a considerable amount of time for processing, typically taking up to 48 hours to produce results. This delay can be detrimental, as the virus can spread rapidly during this waiting period. X-ray images are also used for this purpose due to their accessibility, speed, non-invasiveness, cost-effectiveness, ability to visualize lung tissues, and rapid deploy ability. This research proposes a convolutional neural network (CNN) to detect COIVD-19 based on chest X-ray images. The model's uniqueness lies in its ability to harness the power of convolutional layers for feature extraction without the need for complex segmentation techniques. The convolutional layers of the CNN filter slide across the input image, performing element-wise multiplication and accumulation to create feature maps. These maps highlight relevant patterns, edges, and textures present in the image. This can help in predicting the infection and its severity. With the proposed model an accuracy of 99% was achieved, and it attempts to balance computational efficiency and accuracy. Further, a web interface is developed so that users can use this model to obtain easy and accurate predictions. The proposed model aims to reduce the workload of healthcare workers and provide timely results to a patient so that further actions can be taken quickly.
convolutional neural network, COVID-19, X-ray image, accuracy, confusion matrix, web-based model
COVID-19 is a disease caused by the SARS-CoV-2 coronavirus, first detected in Wuhan, China in December 2019. It quickly spread globally and was declared a pandemic by world health organization (WHO) in 2020. The virus is transmitted through close contact and there are now several variants worldwide. COVID-19 infection can enter the body through respiratory tracts, and attacks the human respiratory system, especially the lungs [1, 2]. Infections can range from mild to severe, like heart attack, respiratory failure, Pneumonia, and liver problems, causing death if not treated properly.
The primary symptoms of COVID-19 include a sore throat, fever, cough, cold, body ache, breathing trouble, loss of smell and taste, congestion, fatigue, etc., that are similar to common cold. Some of the available diagnosis methods are the rapid antigen test [3], and the Reverse Transcription Polymerase Chain Reaction (RT-PCR) test [4, 5]. Further deep investigation can be done using computed tomography (CT) scans [6, 7], X-ray imaging [8] and serological tests [9]. RT-PCR is widely used for detecting COVID-19, but it comes with certain limitations:
1. It requires specialized equipment and trained personnel, limiting its accessibility, especially in remote or resource-constrained areas.
2. The process is time-consuming, often taking hours to deliver results, which hampers timely patient management in critical situations.
3. Additionally, false negatives can occur due to variations in sample collection, handling, or low viral load, leading to potential misdiagnosis and disease transmission.
Indeed, CT scans offer enhanced image details that aid medical professionals in identifying infections and abnormalities. However, their benefits must be weighed against significant concerns. CT scans involve radiation exposure, potentially posing risks to patient safety. Moreover, the resource-intensive demands of CT scans, including the need for specialized equipment and trained personnel, can limit accessibility. Additionally, the excessive costs associated with CT scans can hinder widespread adoption. Therefore, accurate and early detection of the virus in the human body is a significant challenge for medical practitioners. Advanced technologies like machine learning algorithms can help healthcare workers to detect COVID-19 in its initial stage. This can stop the fast spread of the virus. Numerous deep learning models, including deep convolutional networks [10-12], have been proposed to address COVID-19 detection using images. However, these models rely heavily on extensive datasets for training, which can introduce certain drawbacks, such as overfitting, lack of interpretability, uncertain outcomes, biases in data, concerns about generalization to different scenarios, etc.
This research focuses on applying machine learning, particularly Convolutional Neural Networks (CNNs), to COVID-19 detection using chest X-ray images. X-ray imaging, being non-invasive and widely available, offers an opportunity to screen patients and triage cases based on severity rapidly. The CNN model's ability to learn complex image features and patterns makes it an asset in identifying COVID-19-specific abnormalities. By leveraging this technology, the research aims to contribute to developing a robust and efficient diagnostic tool that can facilitate early detection, aid healthcare practitioners in making informed decisions, and improve patient outcomes.
The significant contributions of this paper include:
Furthermore, the paper is presented in 4 sections. Section 2 presents the literature review. The implementation methodology is described in Section 3. The comparison study and results are discussed in Section 4.
Many researchers have proposed artificial intelligence, deep learning, and machine learning-based detection mechanisms to help the medical community in the early detection of COVID-19. Such systems can decrease the spread rate of COVID-19. These systems are built by creating intelligent models using coronavirus datasets like blood reports, X-rays, CT scans, RT-PCR tests, and clinical reports. This section presents the COVID-19 predictions based on the work proposed by different authors.
COVID-19 disease was predicted using urine and blood samples and RT-PCR reports as a dataset [13, 14]. The model was trained on distinctive features extracted from samples. Various machine learning algorithms like Random Forest (RF), K-nearest neighbour (KNN), Logistic Regression (LR), Support Vector Machine (SVM), extreme gradient boosting (XGB), Deep Forest algorithms, Extra Tree Classifier (ETC) were used to predict the COVID-19, its severity, and prognosis. The proposed models were trained and tested using 450 COVID-19 patients' data. These models were successful in estimating the risk of developing further severe symptoms in patients. The models built using ETC and KNN have achieved a maximum accuracy of 98.77%. One common issue in research papers is a limited sample size, which can affect the generalization of the findings. If data is insufficient, then models may give biased and skewed results.
COVID-19 image classification was done using pre-trained deep Convolutional Neural Networks like ResNet and MobileNet. The models were trained using 7592 X-ray and CT scan images sourced from the ImageNet datasets. The research used fine-tuned hyperparameters and weights on networks. These models are designed to resolve the gradient vanishing problem. The COVID-19 X-ray images were classified into three categories: viral Pneumonia, tuberculosis, and bacterial Pneumonia using MobileNet. The CT scan images were classified into non-COVID and COVID-19 using a modified version of ResNet. The modified version of the MobileNet model has achieved an accuracy of 99.6%, which is the highest among all models. The system's drawback lies in that as the problem complexity increases [15], the architectural complexity also rises, leading to a slowdown in the model's performance [15].
Using chest X-rays images, a CNN was implemented to identify COVID-19 disease. A total of 6,342 images were used to train the model. Hyperparameter tuning was done to generalize the model during the validation phase. Some pre-trained networks, like ResNet, etc., were used to build the model and compared with CNN, and it was found that the model had performed well with an accuracy of 96.74%. Apart from this, a web-based application was built for users. As this model was trained using low-resolution images, this can cause the CNN model to miss key features crucial to the model. Therefore, the miss classification rate is higher, leading to less accuracy [16].
COVID-19 disease was also identified using the feature fusion method. The research gathered a total of 4099 COVID-19 chest X-rays from Kaggle. Among these, 3278 X-rays were used in the training set, and the remaining 821 X-rays constituted the validation (test) set. The dataset comprises images of both COVID-19 patients and healthy individuals. This diversity in the dataset allows for training and evaluating the model's performance on different cases and helps to ensure its robustness in distinguishing between COVID-19 and healthy chest X-rays. In this architecture, each network was built using three fully connected layers. Fusion methods used in this proposed work were effective in detecting COVID-19 images.
The Fusion method architecture's accuracy was achieved by combining pre-trained CNN networks such as VGG19, InceptionResNetV2, Xception, ResNet152, and DenseNet201. This fusion approach resulted in an impressive accuracy of 96%, highlighting the effectiveness of leveraging multiple pre-trained networks to enhance the model's performance in detecting COVID-19 images. Despite its success, potential drawbacks include increased computational complexity, challenges in interpretability, and a higher risk of overfitting, demanding careful consideration in real-world applications [17].
Raspberry Pi microcontroller embedded with the Linux operating system was used to diagnose the coronavirus disease. The local binary pattern (LBP) and multi-channel fractional-order Legendre-Fourier moments (MFrLFMs) algorithms were used in this approach to extract global and local features from CT scans and X-ray images. This research utilized 1,696 X-ray images and 2,842 CT scan images, consisting of COVID and non-COVID lung images, as part of their dataset. This system works in four steps: 1. extracting local features of the image; 2. extracting the image global features 3. Identifying the most important features by combining local and global features 4. Applying the binary classifier to specific features to determine whether the input images contain coronaviruses. The advantages of this system are low cost, less computational power, and memory. However, limitations such as small sample size, model complexity, hardware constraints, lack of external validation, and ethical considerations should be considered when interpreting the results and practical implications of the study. Further research and improvements are needed to enhance the model's performance and clinical relevance [18].
A deep neural network-based automated computer-aided diagnostic (CAD) system was implemented to identify COVID-19 disease. The system was modeled using the ImageNet dataset of normal, COVID-19, and Pneumonia chest X-ray images. The proposed algorithm was evaluated using a dataset of 860 images comprising 260 COVID-19 cases, 300 healthy cases, and 300 pneumonia cases. These images were used to investigate the algorithm's performance in differentiating between COVID-19, healthy, and pneumonia cases. The work trained the fifteen pre-trained CNN models to find a suitable model. A transfer learning technique was applied to COVID-19 X-ray images for feature extraction and classification. The VGG19 model achieves the highest classification accuracy of 89.3%. Such systems were prone to low performance in the case of low-contrast images [19].
COVID-19 disease was detected using deep learning-based CovidNet architecture. The architecture accepts greyscale images. In this study, the model was trained using 1266 chest X-ray images. Among these, 321 chest X-ray images were from COVID-19-positive patients, 500 were from patients with Pneumonia, and 445 were from healthy individuals. The image features are visualized with the help of occlusion sensitivity maps. Further, this model has fed the extracted features to classification classifiers such as SVM, FR, and KNN. On top of this, the Bayesian optimization approach was used to optimize the classifiers. The model was able to achieve 96.84% accuracy. This architecture has some disadvantages: 1. increasing the complexity by employing so many methods 2. The use of fewer training datasets may affect performance three due to complex structures increasing in time complexity [20].
COVID-19 was detected using an automated deep-learning model. The study used a chest X-ray images dataset of 10,192 healthy and 3616 COVID-19 patients. The initial X-ray images dataset was augmented and balanced to increase the sample size to 26,000 healthy and 26,000 COVID-19. The pre-trained CNN models like MobileNetV2, DenseNet, EfficientNetB7, VGG16, VGG19, ResNet101, InceptionV3, NFNet, ResNet50, GoogLeNet, and AlexNet were modified to build classification models. MobileNetV2 was able to obtain a higher accuracy of 97%. Data augmentation in this system may lead to high prediction errors, slow the training process, and model overfitting [21].
A Chest X-ray image-based deep learning approach was used to identify and analyze COVID-19 disease. Pre-trained networks like ResNet, Xception, and InceptionV3 were used and analyzed for accuracy. The model was trained with a chest X-ray image dataset size of 6432. These images were collected from Kaggle, which is an open-source dataset repository. Of these three networks, Xception has the highest accuracy of 97.97%. This model was created only for research purposes and did not implement its deep learning network [22].
We concluded from the research that early detection of COVID-19 is necessary for doctors to treat patients effectively. Considering this as a significant contribution, the proposed research has developed a customized deep-learning approach to detect COVID-19 disease in the initial stage.
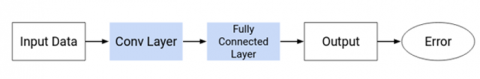
The proposed architecture uses CNN to build the model. The high-level design of the study is shown in Figure 1. CNN is a deep learning-based algorithm that accepts images as input. The network assigns biases and learnable weights to the objects in the images. As a result, images in CNN can be distinguished from one another. The architecture of the CNN is similar to how neurons are connected in the human brain. CNN needs less time for image preprocessing as compared to other classification methods. CNN effectively captures temporal and spatial relationships in an image using appropriate filters. The architecture performs a better fit to the image dataset because of the reduced number of parameters involved and the reusability of weights. The kernel or filter, part of CNN, is involved in convolution operations and is usually denoted by the letter 'K’. The image that CNN accepts has the dimensions:
Image Dimension $=$ Height $\times$ Breadth $\times$ Number of channel (1)
The convolution used in the model is mathematically represented by an asterisk (*) sign. The expression used to represent convolution is as follows:
$Z=X \times f$ (2)
where, ‘f’ is the filter and ‘X’ is an input image used in CNN.
Figure 1. High-level architecture of the proposed system
Less weighted features of images, such as edges, color, gradient orientation, etc., are captured by ConvLayer, the first layer in CNN. The spatial size of the convolved feature of the image is reduced with the help of the pooling layer. This is necessary to process the data through dimensionality reduction to lower the computational power. In general, two types of pooling are used: maximum and average. Maximum pooling returns the maximum value from the kernel-covered portion of the image. Average pooling produces the average of all the values from the kernel-covered portion of the image. The fully connected layer identifies the non-linear combinations of the high-level features of the image. These features represent the output of the convolutional layer.
The proposed model consists of three convolution layers. In each layer, the Rectified Linear Activation Unit (ReLU) activation function and max pooling are applied. The model is kept light to make it easy for low-space systems to run efficiently. The following mathematical equation represents the ReLu function:
$f(x)=\max (0, x)$ (3)
where, 'x' is the input value. Thus, the output is in the range from 0 to infinity. The RELU activation function, is used in this model, as it is less computationally intensive. Another important property of ReLU is sparsity. This property outputs true zero values for negative input. Further, the network holds one or more true zero values at the hidden layer.
When it comes to a deep learning algorithm, a couple of hyperparameters need to be set correctly. The loss function is one among them. The model can be improved during training by optimizing the loss or cost. A model should always output the minimum loss. The model performance is better when there is minimum loss. The model loss is measured using the cross-entropy loss function. One of the objectives of the proposed model is to make the output as near as possible to the desired output, i.e., the truth value. To reduce the cross-entropy loss, the model weights are iteratively adjusted during training. In this way, our model kept learning, resulting in a trained model. Cross-entropy is represented using the following equation:
Loss $=-\sum_{i=1}^{\text {Output Size }} y_i \times \log \left(\widehat{y}_l\right)$ (4)
where, $\hat{y}_i$ is the $i^{\text {th }}$ output scalar value, and $y_i$ is its corresponding target. The number of output scalar values is used to represent the output size of the model. This loss is used to distinguish two discrete probability distributions from each other. Here $y_i$ presents the probability of occurrence of an event. If the sum of all is 1, then exactly one event has occurred. As distribution gets closer, the model loss will become less, and the minus sign represents the value.
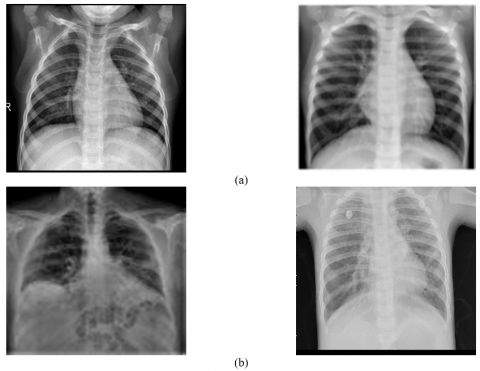
Data is the most critical element when solving problems using Deep Learning. The data used in this study consisted of image data (Lung-Xray) from both COVID-positive and COVID-negative patients. The dataset was collected from two sources, Kaggle [23] and Github [24], resulting in a total of 2940 images. Of these, 1576 images were COVID-negative, and 1364 were COVID-19-positive, as depicted in Figure 2. These images were utilized to train the model, and the dataset comprised grayscale lung images of both normal individuals and COVID patients.
Before training the model, data augmentation and enhancing techniques were applied to the original dataset. Image augmentations, including horizontal flip, rotation, width shift, and height shift, were applied to all the extracted data from the original dataset. Data augmentation is carried out using Python, and parameters are shown in Table 1.
Table 1. Data augmentation details
|
Augmentation Parameters |
Value |
|
Rescale |
1/255 |
|
Rotation range |
30 |
|
Width shift |
0.1 |
|
Height shift |
0.1 |
|
Horizontal Flipp |
“yes” |
Figure 2. (a) Non-COVID (b) COVID X-ray images
Figure 3. Proposed deep learning model architecture
After the augmentation, the data points used were 8216, consisting of positive and negative values. Further, histogram equalization was applied on dataset using the OpenCV library. Each data point is of the size (100, 100, and 1). The set is further shuffled and partitioned into validation and training sets. A total of 511,650 trainable parameters are used in the model.
The model is accessible using a web interface programmed using TensorFlow. Flask is used to create a web interface. Flask is a lightweight web framework for Python, which allows you to create a web application to serve your model's predictions. The model consists of three convolutional layers, with filters 128, 32, and 16, each with filter size 3×3. This helps in extracting features from the X-ray image. The most interesting part of this system is the activation map that is obtained after detection, which suggests the parts of the lungs in the image that are affected. This can help in predicting the infection and its severity.
As shown in Figure 3, the model is a sequential convolutional network. The input layer, with an input image of the dimensions (100, 100, and 1), is the first layer in the proposed approach. A convolutional layer, the next layer that applies a (3×3) kernel and stride value of one, is used to extract features from the input. The convolutional connections involve applying convolutional operations to input data using learnable filters (kernels). These filters slide over the input data, and the convolution operation calculates dot products between the filter and local patches of the input. This process generates feature maps that capture different features in the input. Neurons in the feature maps are connected to a specific receptive field in the input. The result of the preceding layer is then forwarded to the next convolutional layer. All convolutional layers in this model use the result of the previous layer as input. Before input can be passed to the next convolutional layer, max-pooling is applied, which down-samples the results of the previous layer. In our model, we apply the (3×3) filter and extract features using 32 convolutional units in the 2nd convolutional layer. The spatial information to the image is added using padding. A default padding value is used in this model.
Then the result is passed into the dense layers by applying the maximum pooling and flattening. The flattening layer converts the multidimensional convolutional layer output to a one-dimensional output that is called a dense layer. The proposed work used two dense layers. The first dense layer comprises 128 neurons, and the second has 64 neurons. The number of dense layers has been determined after the hyperparameter tuning of the model. The Adam optimizer is used to maintain the adaptive learning rate in the model. In this architecture, the convolutional and max-pooling layers extract hierarchical features from the input data, and the fully connected layers make the final classification decision at the end. The dropout layers introduce regularization to prevent overfitting. The architecture concludes with the output layer, which produces class probabilities for the two classes of the binary classification problem.
The model was trained using 20 epochs; for every epoch, model loss, accuracy, and validation loss were calculated. The softmax activation function is applied in the output layer to predict whether the input image was of a COVID-positive or COVID-negative patient. Finally, the computational efficiency of the model is measured using: FLOPs (Floating Point Operations), parameters, memory usage, and inference time.
4.1 Experimental setup
The tools and technologies used in the creation of the models are Visual Studio Code by Microsoft as our primary Integrated Development Environment (IDE). The entire project is programmed in the Python language. The main deep learning frameworks used are TensorFlow with the Keras API, Pandas, NumPy, sklearn, pickle, and matplotlib. Further, to include the web-based features in the system, we created the User Interface (UI) using the FLASK library. The dataset is a collection of COVID-positive and COVID-negative chest X-ray images. The total data points collected were 5216.
4.2 Model evaluation
Standard metrics such as accuracy, F1-score, specificity, recall, and sensitivity are used to measure the model performance. For evaluation, we need four very important values from our predictions. True positives (TP) are the COVID-positive images that were correctly predicted as COVID positives. True negatives (TN) are COVID-negative images that were correctly identified as COVID-negative. The COVID-negative images that were incorrectly identified to be COVID-positive are called False Positive (FP) and false negatives (FN) are COVID-positive samples that were incorrectly predicted to be COVID-negative.
Accuracy defines the number of class labels identified correctly and is presented using the following equation:
Accuracy $=(T N+T P) /(T N+T P+F P+F N)$ (5)
Specificity is the metric used to monitor true negative predictions made by the model. It is the relationship between the true negative predictions given by the model and the total number of negative assessments.
Specificity $=T N /(F P+T N)$ (6)
The sensitivity of the model measures the true positive predictions. The metric presents the ratio of true positive assessments to the number of correct negative and false positive assessments.
Sensitivity $=T P /(F N+T P)$ (7)
The F1 score is used to present the harmonic mean of precision and recall. The F1 score will reach to maximum when precision becomes equal to recall. The purpose of using an F1 score is to maintain the balance between precision and recall.
$F 1-$ Score $=2 \times \frac{\text { RECALL } \times \text { PRECISION }}{\text { PRECISION }+ \text { RECALL }}$ (8)
Computational efficiency for the proposed model is measured using the following metrics:
1. Floating Point Operations (FLOPs): This metric helps to understand the computational workload of the model using the following equation:
For each convolutional layer:
The number of FLOPs per output pixel = (filter size) × (filter size) × (input channels)
Total FLOPs for the layer = (number of output channels) × (output height) × (output width) × (FLOPs per output pixel)
For each fully connected layer:
The number of FLOPs = (input size) × (output size)
2. Parameters: This refers to the learnable weights and bias of the model. It is given below:
For each convolutional layer:
The number of parameters = (filter size) × (filter size) × (input channels) × (output channels) + (output channels)
For each fully connected layer:
The number of parameters = (input size) × (output size) + (output size)
3. Memory: This specifies the amount of memory required to store the parameters. This is measured in terms of MB.
4. Inference time: This is the time required to complete the training. The proposed model required 20 epochs to complete the training as follows:
Time required= Time required for one epoch × total no. of epochs.
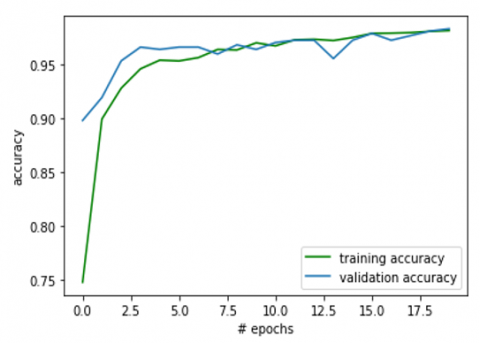
The model's accuracy on the validation set is 97.51 percent, as shown in Figure 4. The training and testing accuracy trends are increasing in the same trend that shows us that there is no over or underfitting of the model on the data. The graph also shows that the model has saturated after eight epochs. The accuracy graph also shows that it has not over-learned the data it was trained on and has comparable skills on both the validation and training datasets.
Figure 4. Accuracy of the model during validation
Figure 5 shows the trend in which the loss of the model is decreasing. The loss is 0.05 on the validation set. The loss graph further shows the model has comparable performance on both training and validation datasets. If these plots start to depart consistently, it might be an indicator to stop training the model.
Figure 5. Model loss during training and validation
Table 2. Model evaluation scores
|
Model Evaluation Metrics |
Precision |
Recall |
F1-Score |
Specificity |
Sensitivity |
Support |
Accuracy |
|
0 (Negative) |
1.00 |
0.99 |
0.99 |
0.99 |
-- |
3491 |
-- |
|
1 (Positive) |
0.97 |
0.99 |
0.98 |
-- |
0.97 |
3491 |
-- |
|
Accuracy |
-- |
-- |
-- |
-- |
-- |
4694 |
0.99 |
|
Macro Average |
0.99 |
0.99 |
0.99 |
-- |
-- |
4694 |
-- |
|
Weighted Average |
0.99 |
0.99 |
0.99 |
-- |
-- |
4694 |
-- |
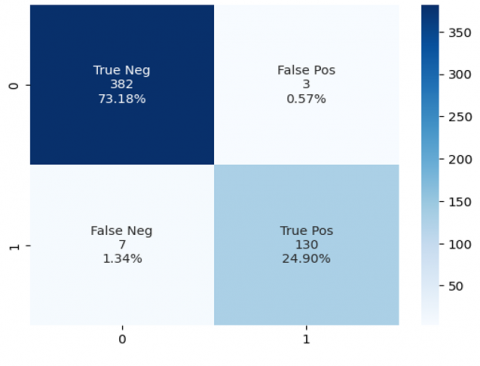
Following are the metrics that help us evaluate the model in a better way. These are the performance scores of the model and are calculated using metrics such as true negatives, false negatives, true positives, and false positives. You can see no class imbalance between the two of our classes (negative and positive). The accuracy of the model is good. The recall and precision values are shown in Table 2. The overall testing loss and accuracy are 0.058 and 0.975, respectively.
Figure 6 shows the confusion matrix, which is calculated using 522 testing data points.
Figure 6. Model performance using the confusion matrix
Table 3 shows the FLOPs and parameters in each layer of the proposed model.
Table 3. Computational efficiency parameters and their values
|
Layer |
No. of FLOPs |
No. of Parameters |
|
Conv2D |
3,556,864 |
1280 |
|
Conv2D_1 |
3,810,816 |
73,792 |
|
Conv2D_2 |
1,746,880 |
18,464 |
|
Dense_1 |
8,192 |
8,256 |
|
Dense_2 |
128 |
130 |
Therefore, the proposed model used 9,532,480 FLOPs and 510,650 parameters for training. The total memory usage includes parameters, activations, and some overhead for model structure trained using 32-bit single precision float value. For simplicity, we will assume 1 MB for other overhead: Total Memory Usage = 2.04 MB (Parameters) + 4.80 MB (Activations) + 1 MB (Overhead) =7.84 MB.
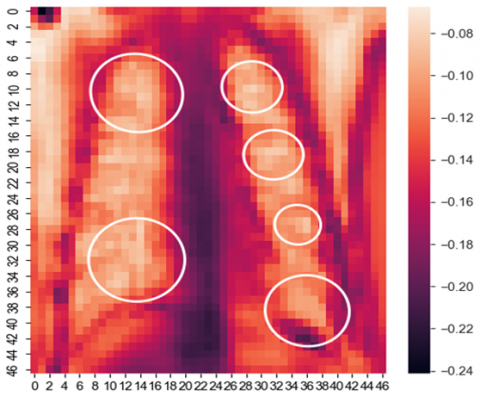
Figure 7. COVID-19 infection severity shown by the model
A special technique is used to print out the model attention supporting the model prediction, which is represented in Figure 7. It represents what pixels in the predictions are made, which help the doctor better understand the patient's severity before going for any major tests in the case of a positive patient. In the picture above, the indicator bar on the left gives us the idea that the brighter the pixel, the greater the impact on the model prediction.
Figure 8. Web-based UI of the model
Table 4. Training summary of the model
|
Layer (Type) |
Output Shape |
Param # |
|
conv2d (Conv2D) |
(None, 98, 98, 128) |
1280 |
|
activation (Activation) |
(None, 98, 98, 128) |
0 |
|
max_pooling2d (MaxPooling2D) |
(None, 49, 49, 128) |
0 |
|
conv2d_1 (Conv2D) |
(None, 47, 47, 64) |
73792 |
|
activation_1 (Activation) |
(None, 47, 47, 64) |
0 |
|
max_pooling2d_1 (MaxPooling2) |
(None, 23, 23, 64) |
0 |
|
conv2d_2 (Conv2D) |
(None, 21, 21, 32) |
18464 |
|
activation_2 (Activation) |
(None, 21, 21, 32) |
0 |
|
max_pooling2d_2 (MaxPooling2) |
(None, 10, 10, 32) |
0 |
|
flatten (Flatten) |
(None, 3200) |
0 |
|
dropout (Dropout) |
(None, 3200) |
0 |
|
dense (Dense) |
(None, 128) |
409728 |
|
dropout_1 (Dropout) |
(None, 128) |
0 |
|
dense_1 (Dense) |
(None, 64) |
8256 |
|
dropout_2 (Dropout) |
(None, 64) |
0 |
|
dense_2 (Dense) |
(None, 2) |
130 |
Table 5. State-of-art comparative analysis with the proposed system
|
Ref. |
Technique/Methods/ Datasets |
Accuracy |
Precision |
Specificity |
Sensitivity |
F1- Score |
|
[24] |
Technique:
|
98.14% 88.89% 96.29% |
95% 1% 1% |
--
|
--
|
95% 74% 98% |
|
[25] |
Technique: Transfer learning using ResNet50, DenseNet-121, ResNet18, and SqueezeNet Dataset size: 5000 images of Chest X-ray. |
-- |
-- |
90% |
98% |
-- |
|
[26] |
Methods: Convolutional Neural Networks and transfer learning Dataset: 4292 pneumonia-infected (1502 viral and 2790 bacterial), 1583 normal, 225 COVID-19-infected preprocessed and original public X-ray images |
98.50% |
-- |
99.18% |
93.84% |
-- |
|
[27] |
Method: Transfer learning-DenseNet20 Dataset: 8644 X-ray images |
92.19% |
-- |
-- |
-- |
-- |
|
[28] |
Technique: CVDNet –Deep CNN. Dataset size: Chest X-ray images containing 219 COVID-19, 1341 normal, and 1345 viral pneumonia. |
97.20% for detecting COVID-19 and 96.69% for three-class classification: COVID-19, normal and viral pneumonia. |
-- |
-- |
-- |
-- |
|
[29] |
Technique: parallel-dilated convolutional neural network Dataset: 2905 chest X-ray images |
96.58% |
96.58% |
-- |
96.59% |
96.59% |
|
[30] |
Method: ML, DL and CNN Dataset: 392 chest X-ray images |
classification accuracy: 96.43% and validation accuracy: 98.33% |
-- |
-- |
-- |
-- |
|
[31] |
Method: Deep CNN |
98.062% |
-- |
-- |
-- |
-- |
|
Proposed work |
Method: Deep CNN Dataset: 2940 X-ray images |
99% |
1 |
99% |
97% |
99% |
A simple, easy-to-use user interface (UI) is created. Figure 8 shows the UI. After selecting an appropriate X-ray image from the computer and clicking on the predict button, the user can check the infected areas by clicking the check infections button. Table 4 shows a training summary of the model.
Table 5 describes the state-of-art comparison analysis of the proposed work. Compared to other proposed techniques, our CNN model has given better classification accuracy in detecting COVID-positive and COVID-19-negative X-ray images. The performance of the current work is compared with those of other proposed approaches in terms of accuracy, recall, specificity, sensitivity, and F1-Score. The transfer learning techniques are used in most of the studies to detect COVID-19 using X-ray images [25-27]. Pre-trained transfer learning networks like ResNet50, DenseNet-121, ResNet18, SqueezeNet, VGG16, VGG19, InceptionV3, MobileNet-V2, and DenseNet201 are used to build the models. In all these cases, model accuracy was above 90%, which is very good, but the goal is to meet the accuracy level near 100%. In summary, our suggested approach has a substantially greater prediction success rate than the models of individuals.
The proposed CNN model offers significant advantages over the existing strategies for COVID-19 diagnosis. It achieves a remarkable accuracy of 99%, surpassing many existing models, leading to more reliable results with reduced false positives and false negatives. The model's key differentiators lie in its lightweight design, optimized data augmentation, and hyperparameters. The model accelerates training and inference by employing convolutional layers for efficient feature extraction without complex segmentation, contributing to faster diagnosis. Moreover, its interpretability through activation maps aids medical practitioners in understanding disease severity and making informed decisions. Overall, the model's accuracy enhancement, architectural optimizations, and improved interpretability makes it a practical and advanced solution for accurate and timely COVID-19 diagnosis.
Future research can focus on external validation across multiple datasets. The model efficiency can be further improved using transfer learning and multimodal integration. Collaboration with medical experts, regulatory bodies, and healthcare institutions is required to ensure the model's robustness and generalizability. The deployment of the proposed CNN model involves challenges like data quality and diversity, clinical validation, interpretable predictions, ethical and privacy concerns, hardware limitations, integration with clinical workflows, regulatory approvals, human-machine collaboration, scalability, bias mitigation, resource constraints, cost considerations, user training and acceptance, and long-term sustainability.
[1] Wang, L., Wang, Y., Ye, D., Liu, Q. (2020). Review of the 2019 novel coronavirus (SARS-CoV-2) based on current evidence. International Journal of Antimicrobial Agents, 55(6): 105948. https://doi.org/10.1016/j.ijantimicag.2020.105948
[2] Rahimi, B., Vesal, A., Edalatifard, M. (2020). Coronavirus and Its effect on the respiratory system: Is there any association between pneumonia and immune cells. Journal of Family Medicine and Primary Care, 9(9): 4729-4735. https://doi.org/10.4103/jfmpc.jfmpc_763_20
[3] Nagura-Ikeda, M., Imai, K., Tabata, S., et al. (2020). Clinical evaluation of self-collected saliva by quantitative reverse transcription-PCR (RT-qPCR), direct RT-qPCR, reverse transcription–loop-mediated isothermal amplification, and a rapid antigen test to diagnose COVID-19. Journal of Clinical Microbiology, 58(9): 10-1128. https://doi.org/10.1128/jcm.01438-20
[4] Sheikhzadeh, E., Eissa, S., Ismail, A., Zourob, M. (2020). Diagnostic techniques for COVID-19 and new developments. Talanta, 220: 121392. https://doi.org/10.1016/j.talanta.2020.121392
[5] Fang, Y., Zhang, H., Xie, J., Lin, M., Ying, L., Pang, P., Ji, W. (2020). Sensitivity of chest CT for COVID-19: comparison to RT-PCR. Radiology, 296(2): E115-E117. https://doi.org/10.1148/radiol.2020200432
[6] Udugama, B., Kadhiresan, P., Kozlowski, H.N., Malekjahani, A., Osborne, M., Li, V.Y., Chen, H., Mubareka, S., Gubbay, J.B., Chan, W.C. (2020). Diagnosing COVID-19: The disease and tools for detection. ACS Nano, 14(4): 3822-3835. https://doi.org/10.1021/acsnano.0c02624
[7] Chen, S.G., Chen, J.Y., Yang, Y.P., Chien, C.S., Wang, M.L., Lin, L.T. (2020). Use of radiographic features in COVID-19 diagnosis: Challenges and perspectives. Journal of the Chinese Medical Association, 83(7): 644-647. https://doi.org/10.1097/JCMA.0000000000000336
[8] Chamorro, E.M., Tascón, A.D., Sanz, L.I., Vélez, S.O., Nacenta, S.B. (2021). Radiologic diagnosis of patients with COVID-19. Radiología (English Edition), 63(1): 56-73. https://doi.org/10.1016/j.rxeng.2020.11.001
[9] Bastos, M.L., Tavaziva, G., Abidi, S.K., et al. (2020). Diagnostic accuracy of serological tests for covid-19: systematic review and meta-analysis. Bmj, 2020: 370. https://doi.org/10.1136/bmj.m2516
[10] Dong, H., Zhu, B., Zhang, X., Kong, X. (2022). Use data augmentation for a deep learning classification model with chest X-ray clinical imaging featuring coal workers' pneumoconiosis. BMC Pulmonary Medicine, 22(1): 1-14. https://doi.org/10.1186/s12890-022-02068-x
[11] Monshi, M.M.A., Poon, J., Chung, V., Monshi, F.M. (2021). CovidXrayNet: Optimizing data augmentation and CNN hyperparameters for improved COVID-19 detection from CXR. Computers in Biology and Medicine, 133: 104375. https://doi.org/10.1016/j.compbiomed.2021.104375
[12] Jebaleela, R.S., Rajakumar, G., Kumar, T.A., Arunmozhiselvi, S. (2022). An optimized CNN based automated COVID-19 lung infection identification technique from CT images. In Novel AI and Data Science Advancements for Sustainability in the Era of COVID-19, Academic Press, pp. 253-276. https://doi.org/10.1016/B978-0-323-90054-6.00010-6
[13] Yao, H., Zhang, N., Zhang, R., Duan, M., Xie, T., Pan, J., Peng, E., Huang, J., Zhang, Y., Xu, X., Xu, H., Zhou, F., Wang, G. (2020). Severity detection for the coronavirus disease 2019 (COVID-19) patients using a machine learning model based on the blood and urine tests. Frontiers in Cell and Developmental Biology, 8: 683. https://doi.org/10.3389/fcell.2020.00683
[14] AlJame, M., Imtiaz, A., Ahmad, I., Mohammed, A. (2021). Deep forest model for diagnosing COVID-19 from routine blood tests. Scientific Reports, 11(1): 16682. https://doi.org/10.1038/s41598-021-95957-w
[15] Jia, G., Lam, H.K., Xu, Y. (2021). Classification of COVID-19 chest X-Ray and CT images using a type of dynamic CNN modification method. Computers in Biology and Medicine, 134: 104425. https://doi.org/10.1016/j.compbiomed.2021.104425
[16] Bacellar, G.C., Chandrappa, M., Kulkarni, R., Dey, S. (2021). Covid-19 chest x-ray image classification using deep learning. medRxiv, 2021-07. https://doi.org/10.1101/2021.07.15.21260605
[17] Ji, D., Zhang, Z., Zhao, Y., Zhao, Q. (2021). Research on classification of COVID-19 chest x-ray image modal feature fusion based on deep learning. Journal of Healthcare Engineering, 2021: 6799202. https://doi.org/10.1155/2021/6799202
[18] Hosny, K.M., Darwish, M.M., Li, K., Salah, A. (2021). COVID-19 diagnosis from CT scans and chest X-ray images using low-cost Raspberry Pi. Plos One, 16(5): e0250688. https://doi.org/10.1371/journal.pone.0250688
[19] Rahaman, M.M., Li, C., Yao, Y., Kulwa, F., Rahman, M.A., Wang, Q., Qi, S., Kong, F., Zhu, X., Zhao, X. (2020). Identification of COVID-19 samples from chest X-Ray images using deep learning: A comparison of transfer learning approaches. Journal of X-ray Science and Technology, 28(5): 821-839. https://doi.org/10.3233/XST-200715
[20] Aminu, M., Ahmad, N.A., Noor, M.H.M. (2021). Covid-19 detection via deep neural network and occlusion sensitivity maps. Alexandria Engineering Journal, 60(5): 4829-4855. https://doi.org/10.1016/j.aej.2021.03.052
[21] Akter, S., Shamrat, F.J.M., Chakraborty, S., Karim, A., Azam, S. (2021). COVID-19 detection using deep learning algorithm on chest X-ray images. Biology, 10(11): 1174. https://doi.org/10.3390/biology10111174
[22] Jain, R., Gupta, M., Taneja, S., Hemanth, D.J. (2021). Deep learning based detection and analysis of COVID-19 on chest X-ray images. Applied Intelligence, 51: 1690-1700. https://doi.org/10.1007/s10489-020-01902-1
[23] CoronaHack -Chest X-Ray-Dataset | Kaggle. https://www.kaggle.com/praveengovi/coronahack-chest-xraydataset, accessed on 5 Feb., 2022.
[24] Eljamassi, D.F., Maghari, A.Y. (2020). COVID-19 detection from chest X-ray scans using machine learning. In 2020 International Conference on Promising Electronic Technologies (ICPET), Jerusalem, Palestine, pp. 1-4. https://doi.org/10.1109/ICPET51420.2020.00009
[25] Minaee, S., Kafieh, R., Sonka, M., Yazdani, S., Soufi, G.J. (2020). Deep-COVID: Predicting COVID-19 from chest X-ray images using deep transfer learning. Medical Image Analysis, 65: 101794. https://doi.org/10.1016/j.media.2020.101794
[26] Sekeroglu, B., Ozsahin, I. (2020). Detection of COVID-19 from chest X-ray images using convolutional neural networks. SLAS TECHNOLOGY: Translating Life Sciences Innovation, 25(6): 553-565. https://doi.org/10.1177/2472630320958376
[27] Manokaran, J., Zabihollahy, F., Hamilton-Wright, A., Ukwatta, E. (2021). Detection of COVID-19 from chest x-ray images using transfer learning. Journal of Medical Imaging, 8(S1): 017503. https://doi.org/10.1117/1.JMI.8.S1.017503
[28] Ouchicha, C., Ammor, O., Meknassi, M. (2020). CVDNet: A novel deep learning architecture for detection of coronavirus (Covid-19) from chest x-ray images. Chaos, Solitons & Fractals, 140: 110245. https://doi.org/10.1016/j.chaos.2020.110245
[29] Chowdhury, N.K., Rahman, M.M., Kabir, M.A. (2020). PDCOVIDNet: A parallel-dilated convolutional neural network architecture for detecting COVID-19 from chest X-ray images. Health Information Science and Systems, 8(1): 27. https://doi.org/10.1007/s13755-020-00119-3
[30] Meem, A.T., Khan, M.M., Masud, M., Aljahdali, S. (2022). Prediction of Covid-19 based on chest X-Ray images using deep learning with CNN. Computer Systems Science & Engineering, 41(3): 1223-1240. http://dx.doi.org/10.32604/csse.2022.021563
[31] Alshahrni, M.M., Ahmad, M.A., Abdullah, M., Omer, N., Aziz, M. (2023). An intelligent deep convolutional network based COVID-19 detection from chest X-rays. Alexandria Engineering Journal, 64: 399-417. https://doi.org/10.1016/j.aej.2022.09.016