Kiran Napte![]() | Anurag Mahajan*
| Anurag Mahajan*![]() | Shabana Urooj
| Shabana Urooj![]()
© 2023 IIETA. This article is published by IIETA and is licensed under the CC BY 4.0 license (http://creativecommons.org/licenses/by/4.0/).
OPEN ACCESS
Precise liver segmentation in Computed Tomography (CT) scans plays a pivotal role in numerous biomedical applications, spanning surgical planning, postoperative assessment, and pathological detection of hepatic diseases. The task, however, is fraught with challenges due to the inherent complexities of liver morphology, including indistinct boundaries, irregular shapes, and complex architecture. Consequences of under-segmentation and over-segmentation of the liver in CT images can lead to inaccurate localizations and diagnoses of liver diseases, underscoring the necessity for accurate segmentation. This study introduces an Encoder-Decoder Convolutional Neural Network, termed ESP-UNet, which is designed to reduce under-segmentation and over-segmentation, thereby enhancing the accuracy of liver segmentation. The proposed ESP-UNet employs Kirsch's filter to bolster the texture and edge information of liver images, thus aiding in improved segmentation performance. The efficacy of the ESP-UNet segmentation technique was evaluated using the LiTS dataset, with performance metrics including accuracy, Dice Score Coefficient (DSC), Volume Overlapping Error (VOE), and Relative Volume Difference (RVD). The algorithm yielded impressive results, with a Dice Score of 0.959, a VOE of 0.089, a Jaccard Index (JI) of 0.921, and an RVD of 0.09. Despite requiring a larger number of trainable parameters and an increased network complexity due to the parallel UNet, the proposed ESP-UNet not only enhances liver segmentation but also has the potential to improve the detection of liver cancer at the image borders. A comparison with existing state-of-the-art liver segmentation techniques revealed that ESP-UNet offers superior performance, validating its potential as a useful tool in the diagnosis and treatment of liver diseases.
automatic liver segmentation, deep learning, image segmentation, liver cancer detection, medical image segmentation
Cancer is the second most common cause of death worldwide, according to the WHO. The World Health Organization (WHO) reports that 8.8 million people died from it in 2015, with liver cancer accounting for 788,000 of those deaths [1]. The liver is the body's biggest gland. The liver digests, detoxifies, and metabolisms. Liver cancers are classified as primary or secondary. Primary liver cancer begins in liver tissue. Primary liver cancer includes hemangioma and hepatocellular carcinoma (HCC). HCC is the most prevalent liver cancer caused by liver tissue malignant cell development. Blood vessels form a hepatic hemangioma [2]. Secondary metastatic liver cancer occurs when cancer spreads from another bodily organ [3]. The liver's texture and shape alter due to an abnormality. Liver, vascular, and tumor excision and segmentation are needed for illness diagnosis. Due to liver homogeneity, poor contrast, form, and adjoining abdominal organs, proper liver segmentation is difficult. Medical imaging methods including CT, MRI, and US may identify liver disorders [4]. The last decade saw the adoption of statistical, threshold-based, fuzzy logic-based, clustering, artificial neural network (ANN) models, and machine learning-based (ML) ALS schemes [5]. Hand-crafted features have lesser interconnectivity, feature distinctiveness, and correlation to original image features. The conventional ML classifier’s effectiveness is highly reliant on these features which quality and distinctiveness can be easily degraded by noise, blur, illumination variance, etc.
This paper presents liver segmentation using edge-strengthening parallel UNet to improve the segmentation performance of the boundary area of the liver. The chief contributions of this article are summarized as follows:
In recent years, deep learning (DL) becomes extremely popular for medical image segmentation because of its ability to deal with complex segmentation problems, accurate segmentation, ability to work for the datasets, etc. Vadali et al. [6] suggested a model for analyzing liver cancer using a support vector machine (SVM) algorithm in MATLAB. The proposed model works in four stages, image resizing, segmentation using stage level set scheme to remove an unwanted area, post-pra processing, and classification stage. In the last stage, the VM is used for the classification of images into benign and malignant. The proposed model achieved a Precision rate of 86.7%. Mouhni et al. [7] highlight the recent surge in using Deep Neural Network algorithms, particularly CNNs, for medical imaging. They point out the challenge of acquiring large datasets, especially for rare diseases. To address this, they introduced Federated Learning (FL) as a potential solution, allowing multicenter dataset training without breaching data privacy. The study offers a comprehensive review of FL in medical image analysis and its associated strategies. Later, Dutta and Dubey [8] proposed a model based on MRI images. The watershed technique was utilized to separate cancer cells from an MRI scan image, and Otsu's method was used to improve the image. The wavelet transform method is used to extract features. The wavelet transform has a multi-resolution analytic that can analyze pictures with varied resolution units. In 2020, Dong et al. [9] proposed a model using Hybridized Fully Convolutional Neural Network (HFCNN) for liver segmentation and tumor detection. The model involves training various layers of HFCNN. The system uses a 2D CT image as input. The proposed framework has shown a high accuracy of 97.22% for liver volume measurements and a 0.92 average dice coefficient. Abdulgani and Al Ahmad [10] anticipated an unsupervised method for cancer detection. Here classification using optical measurement is utilized that interact differently with light as various cells has distinct composition. In the proposed work optical measurement is combined with complex schemes for the classification of cancer cells. In this approach, six different kinds of cells including cancer cells were assessed based on transmission characteristics. The optical response of individual cells was modeled with some parameters such as damping factor, frequency, amplitude, etc. The parameters are extracted using Prony method. Further, Xi et al. [11] proposed deep patch CNN for segmentation and detecting High-resolution cancer. High-resolution medical images cannot be directly given as input to neural networks, because the large size of these images will require very high computing ability and large training time. Therefore, medical images are first compressed and then given as input to the neural networks. Compressing medical images causes the loss of some critical information that may be essential for detecting any anomalies in medical images. The author offers a novel method for building abnormality detectors to address this issue, which involves integrating pre-trained deep CNNs with class activation mappings and area proposal networks after optimizing them on image patches focused on clinical abnormalities. On a mammography dataset, the deep patch classifier produced an average classification accuracy of 92.53% as opposed to 81.55% for a conventional method based on manually created features. On an ultrasound liver imaging data set, the integrated detector was evaluated for anomaly detection and received a mean precision of 0.60. Later, Xi et al. [12] proposed a novel microcantilever biosensor for detecting liver cancer. Cantilever sensors, out of all the biomarker sensors, are the most appealing choice for real-world applications because of their low cost, high sensitivity, quick response, and mobility. Static and dynamic modes are available for cantilever-based sensors. The mass loading causes a shift in resonance frequency, which the lever senses. Cantilever is capable of measuring sensitivity in the fem to gram to atto gram range. Subsequently, Sekaran et al. [13] proposed a framework that uses a DL strategy named CNN, embedded with Gaussian Mixtmaximizationd and Expectation maximization (EM) algorithm to predict pancreatic cancer from liver CT images. This model was able to predict the cancer spread in the pancreas. The experiment was carried out using a cancer imaging archive (TCIA) which consists of approximately 19000 images. The project was named Fishman Afterward with high accuracy. Afterward, Khan and Loganathan [14] proposed a system (AutoLiv) for the automatic segmentation of liver tumors. The authors utilized CT images as the input to the system and then applied a threshold-based slope differentiation technique [SDD] for segmentation. Upon the segmented image, alternative fuzzy c-means clustering [AFCM] is applied to detect the tumor. The proposed system is implemented using MATLAB and then compared with the existing benchmarks. Fan et al. [15] investigated multi-scale context nested UNet (MSN-Net) for ALS which helped to decrease the semantic gap and gradient vanishing problem. It decomposes the low and high levels to enhance the distinctiveness of the network. Bai et al. [16] anticipated multi-scale candidate generation (MCG), active contour model (ACM) and 3D fractal residual network (3D FRN) for ALS to tackle the problem of location, size and shape variation of liver tumor. It outperformed the traditional ALS approaches but was restricted due to poor performance for borderline tumor detection and multiple tumor detection. Li et al. [17] explored hybrid densely linked UNet (H-DenseUNet) for ALS that resulted in a DSC of 0.93. The H-DenseUNet structure is more complex and needs higher trainable parameters because of the use of parallel training.
From the review of various recent liver segmentation techniques, it is observed that deep learning-based approaches outperform conventional region-based and intensity-based methods. However, the results of these methods are greatly dependent on structure, contrast, noise, borders, shape, and imaging technique of liver images as very few samples are generally available for training. The inaccurate border segmentation of the liver leads to an inappropriate diagnosis of liver disease and imprecise localization of the liver. The conventional deep learning techniques provide inferior results for the less dataset. Very less concentration is given to the border segmentation of the liver which plays an important role in the location of the liver in abdominal CT images. Thus, there is a need to provide effective liver segmentation which can deal with non-uniform illumination conditions, piercing borders, under-segmentation, and over-segmentation.
The rest of the article is arranged as follows: Section 2 provides a brief discussion of the proposed methodology of liver segmentation. Further, Section 3 elaborates on the experimental results and discussions. Lastly, Section 4 provides a succinct conclusion and offers direction for future enhancement.
The intricate structure, poor contrast, blurred edges and noise in abdomenal CT images leads to improper segmentation of Liver. The proposed method provides the ESP-Unet for minimizing the under-segmentation and over-segmentation to improve borderline liver segmentation. Therefor it is necessary to focus on border segmentation of liver to limit under segmentation and over segmentation thus It uses Kirsch’s filter for edge strengthening and border line segmentation of liver along with Unet. The Unet is capable of handling larger resolution images and best suited for multilabelled object segmentation.
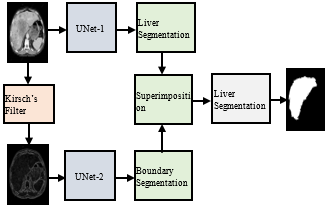
Figure 1 illustrates the process of proposed ESP-UNet liver segmentation. The proposed ESP-UNet consists of two UNet in parallel arms. The first UNet-1 considers the abdominal CT image as input and segments the liver objects from the image. The second UNet-2 accepts Kirsch’s filtered gradient image as input and provides the border segmentation of the liver from the abdominal CT image. The first Unet provides overall segmentation of the liver object whereas the second UNet with Kirsch’s filter provides the border segmentation of the liver. Further, the output of both UNets that provides liver segmentation and liver border segmentation respectively are superimposed together using the x-or operation to minimize the effect of the under-segmentation and over-segmentation. The final segmentation results consist of the liver area that lies within the boundary of the liver obtained using UNet-2. The proposed ESP-UNet aims to provide precise liver segmentation that limits under-segmentation and over-segmentation because of poor border segmentation of the liver in CT images.
Figure 1. Overall flow diagram of the proposed system
A. Kirsch’s Filter
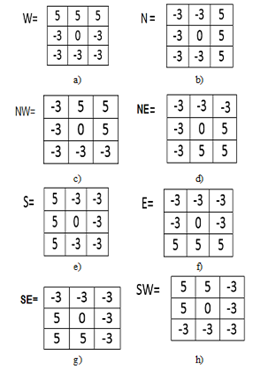
Kirsch’s filter is non-linear edge detection which provides the edge concentration in eight directions. It computes the gradients in 8 compass directions as North (N), West (W), East (E), South (S), South-West (SW), North-West (NW), South-East (SE), and North-East (NE) as illustrated in Figure 2 [18].
These Kirsch’s kernels convolved with the liver image using Eq. (1).
$K_m(n, k)=\sum_{i=-1}^1 \sum_{j=-1}^1 i m(n+i, k+j). F m(i, j)$ (1)
where, Km(n,k) represents Kirsch’s gradient image, Fm is Kirsch’s filter kernel, im(n+i,k+j) denotes a Grayscale image. Here, n and k stand for total rows and columns. Eq. (2) is utilized to estimate the resultant gradient strength in eight directions.
$\begin{gathered}\mathrm{K}_{\max }(\mathrm{n}, \mathrm{k})= \max \left(\mathrm{K}_1(\mathrm{n}, \mathrm{k}), \mathrm{K}_2(\mathrm{n}, \mathrm{k}), \mathrm{K}_3(\mathrm{n}, \mathrm{k}), \ldots, \mathrm{K}_8(\mathrm{n}, \mathrm{k})\right)\end{gathered}$ (2)
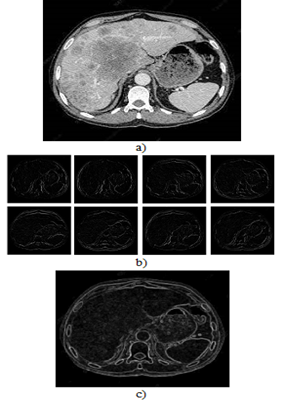
Kirsch’s edge detector retains the edge details and provides better edge accuracy, edge thickness, and less sensitivity to internal and external noise. The edge descriptors for the original liver image using Kirsch’s filter are given in Figure 3.
Figure 2. Kirsch’s filter kernels in eight directions a) West b) North c) North-West d) North-East e) South f) East g) South-East h) South-West
Figure 3. Visualizations of Kirsch’s Filter a) Original Liver Image b) Kirsch’s filter gradient (8 directions) c) Overall Kirsch’s gradient
Figure 4. Flow diagram of proposed liver segmentation using UNet [19]
Table 1. Configuration parameters of UNet
|
Layer |
Activation |
Filter Size |
Number of Filters |
Stride |
Padding |
|
Input Image |
256×256×1 |
- |
|
- |
- |
|
Conv+ReLU |
256×256×64 |
3×3 |
64 |
[1, 1] |
[1,1] |
|
Conv+ReLU |
256×256×64 |
3×3 |
64 |
[1, 1] |
[1,1] |
|
MaxPool |
128×128×64 |
2×2 |
- |
[2, 2] |
[0,0] |
|
Conv+ReLU |
128×128×128 |
3×3 |
128 |
[1, 1] |
[1,1] |
|
Conv+ReLU |
128×128×128 |
3×3 |
128 |
[1, 1] |
[1,1] |
|
MaxPool |
64×64×128 |
2×2 |
- |
[2, 2] |
[0,0] |
|
Conv+ReLU |
64×64×256 |
3×3 |
256 |
[1, 1] |
[1,1] |
|
Conv+ReLU |
64×64×256 |
3×3 |
256 |
[1, 1] |
[1,1] |
|
MaxPool |
32×32×256 |
2×2 |
- |
[2, 2] |
[0,0] |
|
Conv+ReLU |
32×32×512 |
3×3 |
512 |
[1, 1] |
[1,1] |
|
Conv+ReLU |
32×32×512 |
3×3 |
512 |
[1, 1] |
[1,1] |
|
Dropout |
32×32×512 |
- |
- |
- |
- |
|
MaxPool |
16×16×512 |
2×2 |
- |
[2, 2] |
[0,0] |
|
Conv+ReLU |
16×16×1024 |
3×3 |
1024 |
[1, 1] |
[1,1] |
|
Conv+ReLU |
16×16×1024 |
3×3 |
1024 |
[1, 1] |
[1,1] |
|
Dropout |
16×16×1024 |
- |
- |
- |
- |
|
Transposed Conv+ReLU |
32×32×512 |
2×2 |
512 |
|
|
|
Depth Concatenation |
32×32×1024 |
- |
- |
- |
- |
|
Conv+ReLU |
32×32×512 |
3×3 |
512 |
[1, 1] |
[1,1] |
|
Conv+ReLU |
32×32×512 |
3×3 |
512 |
[1, 1] |
[1,1] |
|
Transposed Conv+ReLU |
64×64×256 |
2×2 |
256 |
[1, 1] |
[1,1] |
|
Depth Concatenation |
64×64×512 |
- |
- |
- |
- |
|
Conv+ReLU |
64×64×256 |
3×3 |
256 |
[1, 1] |
[1,1] |
|
Conv+ReLU |
64×64×256 |
3×3 |
256 |
[1, 1] |
[1,1] |
|
Transposed Conv+ReLU |
128×128×128 |
2×2 |
256 |
[1, 1] |
[1,1] |
|
Depth Concatenation |
128×128×256 |
- |
- |
- |
- |
|
Conv+ReLU |
128×128×128 |
3×3 |
256 |
[1, 1] |
[1,1] |
|
Conv+ReLU |
128×128×128 |
3×3 |
256 |
[1, 1] |
[1,1] |
|
Transposed Conv+ReLU |
256×256× 64 |
2×2 |
256 |
[1, 1] |
[1,1] |
|
Depth Concatenation |
256×256× 128 |
- |
- |
- |
- |
|
Conv+ReLU |
256×256× 64 |
3×3 |
256 |
[1, 1] |
[1,1] |
|
Conv+ReLU |
256×256× 64 |
3×3 |
256 |
[1, 1] |
[1,1] |
|
Conv |
256×256× 2 |
3×3 |
256 |
[1, 1] |
[0,0] |
|
Softmax |
256×256× 2 |
- |
- |
- |
- |
B. UNet Segmentation
The structure of UNet is similar to the English alphabet ‘U’. It consists of three essential parts such as the contraction, the bottleneck, and the expansion parts given in Figure 4 [18]. The contraction part consists of the repetitive use of two convolution layers with a 3×3 filter size. At every layer, the kernel size is doubled to improve the local and global feature representation capability of the complex abdominal CT images. Rectified Linear Unit (ReLU) layer to improve the non-linear properties of the convolution feature map following each convolution layer. The pair of convolution layers is followed by a maximum pooling layer with a stride of 2×2 pixels to select the imperative features and to tackle the problem of over-fitting. The bottleneck layer encompasses two convolution layers with a 3×3 filter size that combines the contraction and expansion section of the network. Each block of the expansion layer is a crucial part of the UNet which consists of pair of convolution layers with a 3×3 filter size followed by a 2×2 up-sampling layer. After every expansion block, the convolutions layers get halved to maintain the symmetry of the network. In UNet, the number of blocks in contraction is equal to the number of expansion blocks. The copy and crop block helps to retain the original dimensions of the image when the depth of the network increased. The copy operation is used to copy the image whose depth not increase and the crop operation is used to crop the image whose depth is already increased [19-22].
The UNet frameworks used in ESP-Net consists of four pair of convolution layers in the contraction layer with an increasing number of filters that improves feature representation of the liver image and helps to acquire the detailed representation of the local and global features of liver CT image. The contraction blocks consist of 64, 128, 256, and 512 convolutional filters in four layers respectively along with stride and padding of one pixel. The bottleneck layer includes 1024 convolutional filters. The expansion block consists of 512, 256, 128, and 64 convolution filters in each layer along with an up-sampling block. The different parameter configuration of UNet is provided in Table 1.
The Stochastic gradient descent with momentum (SGDM) optimization is employed for the learning of UNet architecture along with the leaning rate of 0.05. The hyper-parameters considered for the learning of UNet are described in Table 2.
Table 2. Hyper-parameters of UNet learning
|
Parameter |
Specification |
|
Learning Algorithm |
Stochastic gradient descent with momentum (SGDM) optimization |
|
Initial Learning Rate |
0.05 |
|
Maximum Epochs |
150 |
|
Mini-batch Size |
16 |
|
Regularization |
L2 Regularization |
|
Gradient Threshold |
0.05 |
|
Momentum |
0.9 |
The suggested ESP-UNet is simulated using Python 3.8 and the OpenCV toolbox on a Nvidia GPU having 512 Tensor-core, 16 GB RAM, and 32 GB graphics, and a Windows operating system. The proposed method is validated using the LiTS dataset [23], which includes 131 CT volumes with varied tissue abnormalities, contrast liver size and tumor levels. The performance of the proposed algorithm is evaluated using a binary mask of segmented liver (LS) image and ground truth (GT) images based on accuracy, DSC, VOE, JI and RVD. The DSC provides information regarding complete ALS from abdominal images that range between 0 (no overlap) and 1 (complete overlap). Eq. (3) is used to compute the DSC.
$D S C(L S, G T)=\frac{2 \times(L S \cap G T)}{|L S|+|G T|}$ (3)
The RVD signifies the changes that occurred between the segmented liver image and GT that lies between 0 (Good segmentation) and 1 (worst segmentation). The RVD is computed using Eq. (4).
$R V D(L S, G T)=\frac{|G T|-|L S|}{|L S|}$ (4)
The VOE represents an overlapping error between the segmented liver image and GT that lies between 0 to 1. Zero value represents better segmentation. The VOE is computed using Eq. (5).
$V O E(L S, G T)=1-\frac{2 \times(L S \cap G T)}{|L S|+|G T|}$ (5)
The JI measures the similarity between ground truth and segmented image. The JI is computed using Eq. (6).
$J I(L S, G T)=\frac{D S}{2-D S}$ (6)
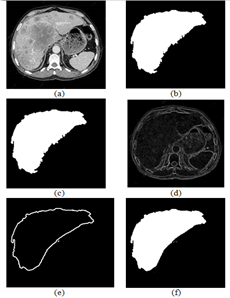
The visualization of the results of the proposed ESP-UNet is illustrated in Figure 5. The original liver image is used for liver object segmentation and Kirsch’s gradient image obtained using eight directional filters is used for the borderline liver segmentation.
Figure 5. Visualization of results of proposed ESP-UNet segmentation a) Liver CT image b) Liver segmentation using UNet-1 c) GT for Liver d) Kirsch’s filter output e) Final segmented liver image
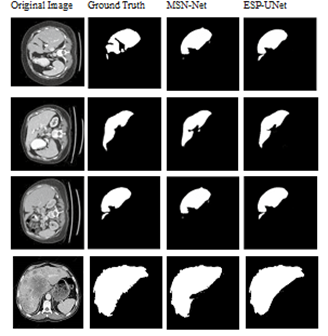
The segmentation outcomes of the ESP-Net for sample images from the LiTS dataset are illustrated in Figure 6. It is noted that the proposed ESP-UNet provides superior performance compared with MSN-Net [15] and provides sharper border segmentation compared with the previous approach.
Figure 6. Segmentation results of ESP-Net
The performance of the ESP-UNet technique is compared with the earlier traditional state of arts for ALS such as ACM-ResNet [16], H-DenseNet [17], and MSN-Net [15] as described in Table 3.
Table 3. Performance comparison of proposed ESP-UNet with previous techniques
|
Author and Year |
Method |
DSC |
VOE |
JI |
RVD |
Trainable Parameters |
|
Bai et al. (2019) [16] |
ACM-ResNet |
0.67 |
0.324 |
0.50 |
0.194 |
_ |
|
Li et al. (2018) [17] |
H-DenseUNet |
0.937 |
0.116 |
0.88 |
-0.010 |
_ |
|
Fan et al. (2020) [15] |
MSN-Net |
0.9424 |
0.04 |
0.89 |
- |
9.12M |
|
Proposed Method |
ESP-UNet |
0.959 |
0.039 |
0.921 |
0.09 |
~30M |
The proposed ESP-UNet provides 1.76%, 2.34% and 43.13% improvement in DSC compared with recent MSN-Net, H-DenseUNet, and ACM-ResNet respectively based on liver segmentation on the LiTS dataset. The ESP-UNet provides 95.99% overlapping of the segmented liver and GT image. The suggested ESP-UNet improves the borderline segmentation of the liver that avoids the under-segmentation and over-segmentation of the liver. This results in the proposed edge strengthening based on Kirsch’s operator and UNet gives significant improvement in VOE (2.5%- 87.96%) over the traditional techniques. Therefore, the ESP-UNet provides a VOE of 0.039 which has shown noteworthy improvement over MSN-Net (0.04), H-DenseUNet (0.116), and ACM-ResNet (0.324) for the LiTS dataset. The ESP-UNet-based encoder-decoder network supports diminishing under and over-segmentation by limiting the segmentation with the help of border segmentation of liver objects using Kirsch’s filter and UNet. When the results of ESP-UNet are compared based on JI it provides an improvement of 3.48%, 4.65%, and 84.2% over MSN-Net, H-DEnseUNet, ACM-ResNet respectively. The ESP-UNet provides the RVD of 0.09 which shows better segmentation compared with as H-DenseUNet (-0.01) and ACM-ResNet (0.194). Thus, it observed that the proposed ESP-UNet segmentation scheme is capable of providing better segmentation in complex CT images that considers the border of the liver object to limit the under and over-segmentation problem in the traditional liver segmentation techniques. The proposed scheme needs a training time of 128min and a segmentation time of 1.8 min. However, the parallel structure of ESP-UNet increases the complexity and total trainable parameters (~30M) of the proposed framework. The larger trainable parameters decrease the implementation flexibility of the proposed architecture on standalone medical diagnosis devices with limited resources. The effectiveness of the ESP-UNet is estimated for the LiTS dataset having limited samples. However, the performance of the proposed ESP-UNet can be varied for the larger dataset.
In summary, this article presents Encoder-Decoder Convolutional Neural Network with Edge-Enhanced Features for Liver Segmentation (ESP-UNet). The novel ESP-UNet combines liver segmentation along with liver boundary segmentation to minimize the under-segmentation and over-segmentation of the liver which improves borderline area segmentation. It focused on the edge strengthening of the liver image using Kirsch’s filter and UNet-2 to segment the border of the liver image. The segmented border is further used for limiting the under-segmentation and over-segmentation of liver segmented using UNet-1. The consequences of the offered ESP-UNet are estimated on the LiTS dataset based on various performance metrics such as DSC, VOE, JI, and RVD. The proposed approach provides the dice score of 0.959, VOE of 0.089, JI of 0.921, and RVD of 0.09. The suggested ESP-UNet provides better segmentation compared with traditional techniques such as MSN-Net, H-DEnseUNet, and ACM-ResNet, etc. The ESP-UNet provides an improvement of 1-43% in DSC, 2.5%-87.96% in VOE, 3-84% in JI and 3-53% in RVD over the traditional segmentation techniques such as MSN-Net, H-DEnseUNet and ACM-ResNet for LiTS dataset.
The limitation of the suggested ESP-UNet is increased complexity, huge total trainable parameters and larger training as well as segmentation time due to the use of two parallel UNet architectures. The extensive hyper-parameter needs such as a number of convolution and deconvolution layers, filter size, learning rate, learning algorithm, etc. to be manually decided. In the future, the suggested algorithm can be improved by minimizing the network complexity by using lightweight deep learning architecture. Further, efficient optimization techniques can be utilized for the selection of the optimal hyper-parameters of the ESP-UNet. In the future, the effectiveness of the suggested ESP-UNet can be validated for the larger and real-time dataset.
Princess Nourah bint Abdulrahman University Researchers Supporting Project Number (PNURSP2023R79), Princess Nourah bint Abdulrahman University, Riyadh, Saudi Arabia.
[1] World Health Organization. Cancer. http://www.who.int/mediacentre/factsheets///fs297/en/, accessed on 15 January, 2023.
[2] Napte, K., Mahajan, A. (2022). Deep learning based liver segmentation: A review. Revue d'Intelligence Artificielle, 36(6): 979-984. https://doi.org/10.18280/ria.360620
[3] Gandikota, H.P., Abirami, S., Kumar, M.S. (2023). An enhanced approach to liver disease classification: implementing convolutional neural network with attention layer gated recurrent unit. Ingénierie des Systèmes d’Information, 28(4): 1029-1037. https://doi.org/10.18280/isi.280423
[4] Priyadarsini, S., Selvathi, D. (2012). Survey on segmentation of liver from CT images. 2012 IEEE International Conference on Advanced Communication Control and Computing Technologies, Ramanathapuram, India, pp. 25-32. https://doi.org/10.1109/ICACCCT.2012.6320777
[5] Nasser, A.R., Mahmood, A.M. (2021). Cloud-based Parkinson’s disease diagnosis using machine learning. Mathematical Modelling of Engineering Problems, 8(6): 915-922. https://doi.org/10.18280/mmep.080610
[6] Vadali, S., Deekshitulu, G.V.S.R., Murthy, J.V.R. (2019). Analysis of liver cancer using data mining SVM algorithm in MATLAB. Advances in Intelligent Systems and Computing, 816: 163-175. https://doi.org/10.1007/978-981-13-1592-3_12
[7] Mouhni, N., Elkalay, A., Chakraoui, M., Abdali, A., Ammoumou, A., Amalou, I. (2022). Federated learning for medical imaging: An updated state of the art. Ingénierie des Systèmes d’Information, 27(1): 143-150. https://doi.org/10.18280/isi.270117
[8] Dutta, A., Dubey, A. (2019). Detection of liver cancer using image processing techniques. In 2019 International Conference on Communication and Signal Processing (ICCSP), Chennai, India, pp. 0315-0318. https://doi.org/10.1109/ICCSP.2019.8698033
[9] Dong, X., Zhou, Y.Z., Wang, L.T., Peng, J.F., Lou, Y.B., Fan, Y.Q. (2020). Liver cancer detection using hybridized fully convolutional neural network based on deep learning framework. IEEE Access, 8: 129889-129898. https://doi.org/10.1109/ACCESS.2020.3006362
[10] Abdulgani, A.F., Al Ahmad, M. (2020). Label-Free normal and cancer cells classification combining Prony’s method and optical techniques. IEEE Access, 8: 32882-32890. https://doi.org/10.1109/ACCESS.2020.2973468
[11] Xi, P.C., Guan, H.T., Shu, C., Borgeat, L., Goubran, R. (2020). An integrated approach for medical abnormality detection using deep patch convolutional neural networks. The Visual Computer, 36(9): 1869-1882. https://doi.org/10.1007/s00371-019-01775-7
[12] Xi, X.F., Wang, L., Sheng, V.S., Cui, Z.M., Fu, B.C., Hu, F.Y. (2020). Cascade U-ResNets for simultaneous liver and lesion segmentation. IEEE Access, 8: 68944-68952. https://doi.org/10.1109/ACCESS.2020.2985671
[13] Sekaran, K., Chandana, P., Krishna, N.M., Kadry, S. (2020). Deep learning convolutional neural network (CNN) with Gaussian mixture model for predicting pancreatic cancer. Multimedia Tools and Applications, 79(15): 10233-10247. https://doi.org/10.1007/s11042-019-7419-5
[14] Khan, Z., Loganathan, R. (2020). AutoLiv: Automated liver tumor segmentation in CT images. In 2020 International Conference on Smart Technologies in Computing, Electrical and Electronics (ICSTCEE), Bengaluru, India, pp. 151-156. https://doi.org/10.1109/ICSTCEE49637.2020.9277076
[15] Fan, T., Wang, G.L., Wang, X., Li, Y., Wang, H.R. (2021). MSN-Net: A multi-scale context nested U-Net for liver segmentation. Signal, Image and Video Processing, 15(6): 1089-1097. https://doi.org/10.1007/s11760-020-01835-9
[16] Bai, Z.Q., Jiang, H.Y., Li, S.Q., Yao, Y.D. (2019). Liver tumor segmentation based on multi-scale candidate generation and fractal residual network. IEEE Access, 7: 82122-82133. https://doi.org/10.1109/ACCESS.2019.2923218
[17] Li, X.M., Chen, H., Qi, X.J., Dou, Q., Fu, C.W., Heng, P.A. (2018). H-DenseUNet: hybrid densely connected UNet for liver and tumor segmentation from CT volumes. IEEE Transactions on Medical Imaging, 37(12): 2663-2674. https://doi.org/10.1109/TMI.2018.2845918
[18] Tatli, U., Budak, C. (2023). Biomedical image segmentation with modified U-Net. Traitement du Signal, 40(2): 523-531. https://doi.org/10.18280/ts.400211
[19] Ronneberger, O., Fischer, P., Brox, T. (2015). U-Net: convolutional networks for biomedical image segmentation. Lecture Notes in Computer Science, 9351: 234-241. https://doi.org/10.1007/978-3-319-24574-4_28
[20] Siddique, N., Paheding, S., Elkin, C.P., Devabhaktuni, V. (2021). U-net and its variants for medical image segmentation: A review of theory and applications. IEEE Access, 9: 82031-82057. https://doi.org/10.1109/ACCESS.2021.3086020
[21] Bhangale, K.B., Kothandaraman, M. (2022). Survey of deep learning paradigms for speech processing. Wireless Personal Communications, 125(2): 1913-1949. https://doi.org/10.1007/s11277-022-09640-y
[22] Bhangale, K.B., Desai, P., Banne, S., Rajput, U. (2022). Neural style transfer: reliving art through artificial intelligence. In 2022 3rd International Conference for Emerging Technology (INCET), Belgaum, India, pp. 1-6. https://doi.org/10.1109/INCET54531.2022.9825254
[23] Bilic, P., Christ, P., Li, H.B., et al. (2019). The liver tumor segmentation benchmark (LiTs). Medical Image Analysis, 84: 102680. https://doi.org/10.1016/j.media.2022.102680