Lingli Zhang![]() | Wenjun Huang
| Wenjun Huang![]() | Boping Zhang*
| Boping Zhang*![]() | Pengfei Han
| Pengfei Han![]()
© 2023 IIETA. This article is published by IIETA and is licensed under the CC BY 4.0 license (http://creativecommons.org/licenses/by/4.0/).
OPEN ACCESS
The pervasive usage of Wireless Sensor Networks (WSNs) across various sectors - including environmental monitoring, intelligent transportation, healthcare, and security surveillance - necessitates efficient mechanisms for real-time image transmission. The ability to deliver timely and accurate visual information is essential for effective decision-making in these applications. Current techniques for real-time image transmission and compression in WSNs, unfortunately, fail to adequately consider the energy limitations of sensor nodes, often leading to premature energy exhaustion and consequently destabilizing the network's overall reliability. This study presents an investigation into an innovative joint encoding strategy for real-time image transmission and compression in WSNs, proposed to address these limitations. When compared with decoding schemes individually optimized for each user's channel conditions, it is demonstrated that the proposed method achieves a comparable quality of image reconstruction. Furthermore, this study introduces a post-processing network model, designed to mitigate compression artifacts, facilitating superior image reconstruction quality even at high compression ratios and low bit rates. Experimental results underscore the effectiveness of this new approach.
wireless sensor networks, real-time image, image transmission, image compression
The rapid progression of Wireless Sensor Networks (WSNs) technology has extended its applications in various fields, significantly augmenting the demand for real-time image transmission and compression [1-4]. Comprising of numerous low-cost, low-power sensor nodes with computational and communicational abilities, WSNs have found widespread use in areas such as environmental monitoring, security surveillance, smart transportation, and healthcare [5-10]. Real-time image transmission in WSNs carries substantial importance as it delivers timely and accurate information to users, aiding in precise decision-making [11-16].
However, due to the specificities of WSNs, real-time image transmission faces an array of challenges. Primarily, wireless sensor nodes typically have a limited energy source, making energy efficiency crucial for extending network lifespan. Moreover, bandwidth constraints of WSNs result in lower data transmission rates [17]. Furthermore, the limited computational ability of sensor nodes cannot support complex image processing and compression algorithms [18-22]. Therefore, to implement real-time image transmission and compression in WSNs, these challenges need to be surmounted to ensure efficient utilization of energy, bandwidth, and computational resources.
While existing methods for real-time image transmission and compression have, to some extent, addressed these issues, they still have certain shortcomings [23-25]. On the one hand, many current methods overlook the energy constraints of sensor nodes, leading to premature energy exhaustion and affecting network stability and reliability. On the other hand, existing compression methods might introduce significant compression distortion while reducing the image data volume, thereby degrading image quality. Additionally, some algorithms are excessively complex and unsuitable for wireless sensor nodes with limited computational capabilities.
Hence, this work aims to investigate a real-time image transmission and compression algorithm based on WSNs. The algorithm takes into account the characteristics of WSNs, addressing the drawbacks and deficiencies of current methods. The second chapter of the study constructs a novel joint source-channel coding scheme, the reconstructed image quality of which is comparable to a coding-decoding scheme optimized for each user's channel condition. The third chapter presents a post-processing network model that resolves the compression artifacts, enabling superior reconstruction quality for real-time images even under high compression ratios at low bit rates. The effectiveness of the proposed method is validated through experimental results.
In scenarios of real-time image processing based on wireless sensor networks, channel conditions within these networks are prone to changes due to influences such as path loss, shadowing, multipath fading, interference, and noise. Traditional separated coding schemes could be heavily impacted when the actual channel conditions diverge from the optimized conditions. Joint source-channel coding schemes are designed with an adaptive signal-to-noise ratio capability, equipping them to adapt to varying channel states and effectively respond to changes in channel conditions.
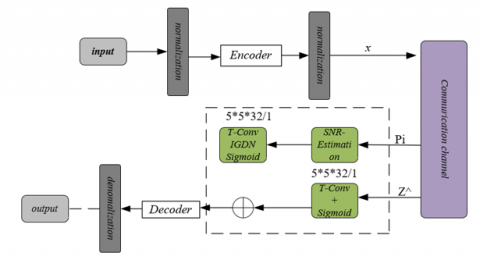
In multi-user scenarios where each user's channel conditions may vary significantly, joint source-channel coding schemes have the advantage of requiring only a single trained model to adapt to all channel states. This implies that the same decoder can be deployed on different user ends, thereby reducing the burden of deployment and maintenance, and lowering system complexity. The reconstructed image quality offered by the joint source-channel coding scheme proposed in this study is nearly equivalent to that of encoding and decoding schemes optimized for each user's channel conditions. This indicates that while ensuring adaptability and versatility, the scheme can maintain high image quality, meeting the demands of real-time image transmission. Figure 1 presents the architecture of the signal-to-noise ratio adaptive enhancement model.
In the context of real-time image processing based on wireless sensor networks, a signal-to-noise ratio adaptive model is designed, adopting an autoencoder structure and employing multiple convolutional layers for feature extraction and compressed representation. The model is capable of autonomously learning to extract useful information from the original images. Utilizing the PReLU activation function, which has strong non-linear fitting capabilities, helps enhance the model's expressive power. By adjusting the number of convolution filters in the final layer, the bandwidth compression ratio can be flexibly optimized to accommodate varying channel conditions. This facilitates more efficient image transmission within the constraints of limited bandwidth resources. Adding an average power constraint normalization layer after the output of the last convolutional layer can restrict the power of the encoded signal, reducing energy consumption and catering to the low-energy requirements of sensor nodes in wireless sensor networks.
Figure 1. Signal-to-noise ratio adaptive enhancement model
Figure 2. Encoder/Decoder structure
The encoder/decoder structure of the signal-to-noise ratio adaptive model developed in this study is depicted in Figure 2. To enhance decoding performance, the decoder uses pilot signals sent by the transmitting end to estimate the signal-to-noise ratio, enabling adaptive adjustment of the decoding process based on channel conditions. In order to take into account the impact of the signal-to-noise ratio for more precise decoding, the estimated signal-to-noise ratio by the decoder is expanded into a signal-to-noise ratio map of the same dimensions as the merged data. The real and imaginary parts of the complex channel output samples are merged, simplifying the decoder's handling of complex channel outputs and improving computational efficiency. Using transposed convolution layers can achieve upsampling and feature restoration of encoder outputs, effectively restoring the original image. The addition of pilot signals to channel outputs as the input to the transposed convolution layer enhances decoding performance. The use of the Sigmoid function as the activation function in the final transposed convolution layer restricts the output within the range of [0, 1], consistent with the range of the normalized input image, simplifying the restoration of the original image. The expression of the Sigmoid function is given below:
$\delta \left( Z \right)=\frac{1}{1+{{e}^{-z}}}$ (1)
Due to the convolution operation in the encoding process, the image resolution is reduced. Therefore, to restore the original image resolution, up-sampling of the feature maps is needed at the decoding end using transposed convolution layers. This is crucial for real-time image processing scenarios, as we need to ensure that the decoded image maintains the same spatial dimensions (height and width) as the original image to preserve the integrity of image information. The up-sampling process of the transposed convolution layers retains the spatial information of the original image, which is essential for real-time image processing applications (such as object detection, segmentation, etc.) that often require precise analysis of spatial locations and dimensions in images.
To recover the operations performed by the encoder at the decoding end, the decoder's structure is typically symmetrical to the encoder's structure. The hyperparameters (such as kernel size, stride, and padding) of the remaining transposed convolution layers in the decoder, except for the final convolution layer (used to produce the final output image), are consistent with the corresponding convolution layers in the encoder. This helps recover spatial information and feature hierarchy layer by layer during the decoding process. Meanwhile, in real-time image processing scenarios, computing resources and bandwidth are limited. Therefore, when setting model hyperparameters, there is a need to balance computational complexity and performance. Larger kernels, smaller strides, and appropriate padding can improve model performance but also increase computational complexity. When selecting hyperparameters, the trade-offs should be made according to specific application scenarios and resource constraints to achieve the best performance.
In the encoding and decoding networks of wireless sensor networks for real-time image transmission, this paper adopts the PReLU activation function, which adds a linear term su to the negative value input. The expression of the nonlinear activation function d is given by the following equation for input tu in the u-th channel, with the slope controlled by su:
$d\left( {{t}_{u}} \right)=\left\{ \begin{align} & {{t}_{u}},{{t}_{u}}>0 \\ & {{s}_{u}}{{t}_{u}},{{t}_{u}}\le 0 \\ \end{align} \right.$ (2)
To further enhance the performance of real-time image transmission, this paper constructs an enhanced model based on the original baseline model. This includes adding generalized split normalization layers and their inverse transformation layers to the encoding and decoding networks. Assuming that the feature map input of the u-th layer is represented by zu, the parameters to be learned are represented by αu and εu, and the core formula is given by the following equation:
${{t}_{u}}=\frac{{{z}_{u}}}{{{\left( \alpha _{u}^{2}+\sum{{{\varepsilon }_{u}}}\times z_{u}^{2} \right)}^{\frac{1}{2}}}}$ (3)
In real-time image processing scenarios of wireless sensor networks, bandwidth resources are limited, so image compression is required during the encoding process. The proposed signal-to-noise ratio (SNR) adaptive model in this paper adjusts the bandwidth compression ratio by changing the number of filter channels c in the last convolution layer of the encoder, thus achieving different degrees of compression. This method can effectively reduce the demand for transmission bandwidth while ensuring image quality. To facilitate comparison with the baseline model, the network parameter settings of the proposed SNR adaptive model (such as the filter size, number, and stride in the encoder and decoder networks) are kept consistent with the baseline model. This helps to accurately evaluate the performance advantages and disadvantages of the SNR adaptive model under the same conditions.
The baseline model trains and tests corresponding models for different SNR values. In contrast, the proposed SNR adaptive model adapts the encoding and decoding processes to different SNR scenarios with bandwidth compression ratios of 1/12 and 1/6. This adaptive capability helps improve the robustness and performance of the model in real-time image processing applications.
The source bandwidth in this paper is defined as the dimension of the input real-time transmission image, represented by b. The channel bandwidth is defined as the dimension of the complex channel input, represented by j. The bandwidth compression ratio E is calculated by the following equation:
$E=\frac{j}{b}$ (4)
However, in the actual image transmission process, the encoder output data will be divided into two parts. This paper considers them as the real and imaginary parts of the complex number and merges the j-value complex noise channel input samples. The following equation gives the relationship between j and v:
$j=\frac{8\times 8\times v}{2}=32\times v$ (5)
By combining the above two equations, we have the following relationship between v and the bandwidth compression ratio:
$E=\frac{j}{b}=\frac{32\times v}{32\times 32\times 3}=\frac{v}{96}$ (6)
The mean squared error between the original input image and the reconstructed image is defined as the model's loss function. Assuming the number of samples is represented by B, the function expression is given by the following equation:
$M=\frac{1}{B}\sum\limits_{u=1}^{B}{f\left( {{z}_{u}},{{{\hat{z}}}_{m}} \right)}$ (7)
This section elaborates on the constraints within wireless sensor networks where limited bandwidth necessitates the compression of images during transmission. The subsequent quality loss and artifacts produced due to this compression form a significant challenge. A post-processing network model is proposed to address the issue of compression artifacts, aiming to achieve superior reconstruction quality under high compression ratios at low bit rates. A Convolutional Neural Network (CNN) post-processing network with a large receptive field is introduced, allowing for the capture of more extensive contextual information which aids in the precise restoration of compressed image details. Furthermore, the use of multi-scale features facilitates the processing of images at various scales, enhancing the robustness and performance of the model when dealing with different scales and complexities of image tasks.
A residual structure is adopted to facilitate the effective training of the proposed post-processing network. The utilization of the residual structure assists in mitigating problems related to gradient vanishing and gradient explosion, easing the training process and consequently improving model performance. The post-processing network employs an end-to-end training approach, learning the mapping relationship directly from compressed images to high-quality images. This end-to-end training simplifies the model training process, while concurrently enabling automatic learning of features throughout the network that contribute to improving the reconstruction quality. Figure 3 presents the logical steps of the real-time image compression algorithm.
In the context of real-time image processing based on wireless sensor networks, three enhancement modules are incorporated into the constructed post-processing network. This is to prevent excessive network depth when processing full-resolution images, thereby reducing computational costs. Within the wireless sensor network, computational resources are typically scarce; hence, a relatively shallow network structure is advantageous for saving computational resources and enhancing real-time performance. Each enhancement module contains two multi-scale residual blocks, employing convolution kernels of different sizes (e.g., 5x5, 3x3, 1x1), enabling the network to capture image features at various scales. This multi-scale feature enhances the performance of the network in handling image tasks of different scales and complexities. Following the convolution layers, a Leaky ReLU activation function is applied. Compared to the traditional ReLU activation function, Leaky ReLU offers a non-zero gradient in the negative region, assisting in addressing the problem of gradient vanishing and improving the stability of model training. At the end of the post-processing network, a 1x1 convolution adjusts the number of image channels, followed by a global residual learning to obtain the enhanced quality image. Global residual learning aids the network in directly learning the difference between compressed images and high-quality images, thereby improving the quality of the reconstructed image. The proposed post-processing network can be easily integrated into the entire compression system and optimized efficiently in an end-to-end manner. This end-to-end training simplifies the model training process, while concurrently enabling automatic learning of features throughout the network that contribute to improving the reconstruction quality. Figure 4 demonstrates the framework of the post-processing network model.
Figure 3. Logical steps of the real-time image compression algorithm
Figure 4. Framework of the post-processing network model
The multiple scale residual block under discussion encompasses convolution kernels of diverse dimensions, aiding in the extraction of image features across varied scales. In applications pertaining to real-time image processing, the presence of structures and details at multiple scales within an image can be better captured by the multiple scale residual block, thereby enhancing image reconstruction quality. Concurrently, as network depth augments, there may be a gradual loss of features during transmission, leading to underutilization. This issue can be mitigated by the multiple scale residual block, which effectively extracts and utilizes features of different scales, improving model performance. Figure 5 depicts the structure of a multiple scale residual block.
Two branches featuring convolution kernels of differing sizes are present within a multiple scale residual block, and information across these branches can be shared. Given that the network's weights are represented by q and bias by n, the computation process is expressed as follows:
${{S}_{1}}=\delta \left( q_{5\times 5}^{1}*z+{{n}_{1}} \right)$ (8)
${{N}_{1}}=\delta \left( q_{3\times 3}^{1}*z+{{n}_{1}} \right)$ (9)
${{S}_{2}}=\delta \left( q_{5\times 5}^{2}*\left[ {{S}_{1}},{{N}_{1}} \right]+{{n}_{2}} \right)$ (10)
${{N}_{2}}=\delta \left( q_{3\times 3}^{2}*\left[ {{N}_{1}},{{S}_{1}} \right]+{{n}_{2}} \right)$ (11)
${S}'=\delta \left( q_{3\times 3}^{3}*\left[ {{S}_{1}},{{N}_{2}} \right]+{{n}_{3}} \right)$ (12)
Notably, the superscripts and subscripts of weights symbolize the convolution layers and their corresponding kernel sizes, while the fusion operations are represented by [S1, S2], [N1, S1], and [S2, N2]. The slope of the function when z<0 is controlled by N-S, and a Leaky ReLU function is utilized as the activation function, expressed by Eq. (13):
$Leaky\operatorname{Re}LU\left( z \right)=\left\{ \begin{align} & z,if\ z\ge 0 \\ & N\_S\times z,otherwise \\\end{align} \right.$ (13)
Residual learning is employed for each multi-scale residual block in this study to achieve greater network execution efficiency. Suppose the output of the multiple scale residual block is denoted by z', the computation formula for the multiple scale residual block is given by Eq. (14):
${z}'={S}'=z$ (14)
Dilated convolution is capable of expanding the model's receptive field without increasing the number of network parameters to be learned or altering the size of input features. This allows the model to learn larger-scale feature correlations while maintaining relatively low computational complexity, contributing to improved image reconstruction quality. In real-time image processing scenarios based on wireless sensor networks, the issue of compression artifacts not being entirely removed by neighborhood information may arise. Dilated convolution can learn feature correlations within a wider range, assisting in the elimination of compression artifacts, and consequently enhancing image reconstruction quality.
The real-time image to be transmitted, z, is considered as a function z: X2→E, with the convolution kernel j of size (2e+m)×(2e+m) represented by j: Ψe→E, where Ψe={-e, e}2∩X2. Assuming two-dimensional indexing is expressed by o, a, y∈X2, the definition of the convolution operator *f with dilatation coefficient f is given by Eq. (15):
$\left( U{{*}_{f}}j \right)\left( o \right)=\sum\nolimits_{a+fy=o}{U\left( a \right)j\left( y \right)}$ (15)
Compared to conventional convolution, when dilation factors are set at 1, 2, 4, ..., 2b-1, the receptive field of dilated convolution can reach (2b-1-1)×(2b-1-1).
Mean Square Error (MSE) is a commonly used metric to measure image reconstruction quality, quantifying pixel-level discrepancies between the reconstructed and original images. The use of MSE as one of the loss functions effectively guides the model to reduce pixel-level differences between the reconstructed and original images during training. Multi-Scale Structural Similarity (MS-SSIM) is an image quality assessment method based on human visual systems, measuring image similarity across different scales and structures. Implementing MS-SSIM as one of the loss functions aids the model in preserving the structural information of the original image during training, thereby improving the quality of the reconstructed image. MSE and MS-SSIM, measuring image reconstruction quality from the perspectives of pixel-level differences and structural similarity, respectively, are combined as the loss function. This approach facilitates a more comprehensive evaluation of model performance and assists in obtaining reconstructed images that perform well across multiple evaluation metrics.
Assume the output of the post-processing network and the original image are denoted by Z' and Z, respectively. If Peak Signal-to-Noise Ratio (PSNR) is chosen as the quality evaluation metric for real-time transmitted images, the optimization target of the post-processing network model can be established as follows:
$LOSS=\frac{1}{b}\sum\limits_{u=1}^{b}{{{\left( Z-{Z}' \right)}^{2}}}$ (16)
If MS-SSIM is selected as the quality evaluation metric for real-time transmitted images, considering that its value range is [0,1] and the higher the index value, the better, and the smaller the loss function value, the better, the optimization target of the post-processing network model can be set as follows:
$\begin{align} & MS\left( Z,{Z}' \right)={{\left[ {{1}_{L}}\left( Z,{Z}' \right) \right]}^{{{\beta }_{L}}}}\bullet \prod\limits_{k=1}^{L}{{{\left[ {{v}_{k}}\left( Z,{Z}' \right) \right]}^{{{\alpha }_{k}}}}{{\left[ {{a}_{k}}\left( Z,{Z}' \right) \right]}^{{{\varepsilon }_{k}}}}} \\ & {{M}_{LA-AAUL}}=1-MS\left( Z,{Z}' \right) \\\end{align}$ (17)
Figure 5. Multi-scale residual block structure diagram
Figure 6 depicts experimental results obtained on the test set across different models. From the figure, it can be inferred that the performance of varying models on the test set varies. The performance of the baseline model and the model presented in this study, across different Signal-to-Noise Ratio (SNR) conditions (trained at 0dB, 10dB, and 20dB, respectively), is charted. The chosen performance metric is the Peak Signal-to-Noise Ratio (PSNR) or a similar measure. It is discernible from the figure that the performance of all models improves with an increase in test SNR values. This is due to the fact that higher SNR values lead to less noise in the images, allowing the models to learn useful features more effectively. At lower test SNR values, the performance of the model presented in this study is comparable to the baseline model (trained at SNR=0dB), suggesting that this model exhibits superior performance under conditions of low SNR. At higher test SNR values, the model's performance surpasses the baseline model (trained at SNR=0dB), indicating stronger generalization ability under higher SNR conditions. Moreover, irrespective of the test SNR values, the performance of the model in this study outperforms the baseline models (trained at SNR=10dB and 20dB), demonstrating the model's robust performance across different SNR conditions.
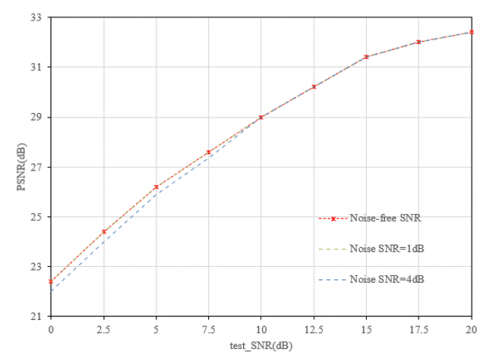
Figure 7 serves to evaluate the robustness of the Signal-to-Noise Ratio adaptive enhancement model. This figure presents the performance under different test SNR conditions, including no noise SNR, noise SNR=1dB, and noise SNR =4dB. The performance metric again chosen is the PSNR. It can be seen that the performance of the noiseless SNR increases with the rise of the test SNR, due to the lesser noise in the images under high SNR conditions, thereby making it easier for the model to learn useful features. The performance of the model with noise SNR=1dB is very close to that of the model with no noise SNR at every test SNR, which suggests that the SNR adaptive enhancement model possesses strong robustness under slight noise interference (such as 1dB). At lower test SNR (like 0 and 2.5), the performance of the model with noise SNR=4dB is slightly lower than that of the noiseless SNR. However, at higher test SNR values (like 10 and above), the performance of the model with noise SNR=4dB is close to that of the noiseless SNR, implying that the SNR adaptive enhancement model displays commendable robustness under a certain degree of noise interference (such as 4dB), particularly under high SNR conditions.
Figure 6. Experimental results obtained on the test set across different models
Figure 7. Robustness verification of signal-to-noise ratio adaptive enhancement model
Figure 8 allows for a comparison of the PSNR distortion curve for different algorithms. This figure demonstrates the performance of various image compression algorithms, including JPEG, JPEG2000, Hyperprior, WebP, BPG, H.264/AVC, and the model presented in this study, at different Bits per pixel (Bpp). PSNR serves as the performance metric. The graph reveals that the performance of JPEG is generally lower across all algorithms. This is primarily due to JPEG's use of a simple DCT (Discrete Cosine Transform) compression method, which may not be sufficient to capture the detailed information in the image. At lower Bpp, the performance of JPEG2000 and Hyperprior are similar, indicating their superior compression performance under lower bit rates. However, at higher Bpp, JPEG2000 outperforms Hyperprior. WebP and BPG exhibit good performance in the mid-Bpp range, indicating that they can maintain high image quality even under some degree of compression. H.264/AVC performs better at higher Bpp, suggesting good compression performance at high bit rates. Across all bit rates, the performance of the model presented in this study is generally superior to or close to the other algorithms, implying the model's ability to maintain high image quality at different compression ratios, thus demonstrating superior compression performance.
Figure 9 presents an evaluation of image quality and transmission performance under different signal-to-noise ratio (SNR) conditions across various channels. Figure 9(a) lists the performances of anti-counterfeiting channels and wireless road channels under different SNRs, using Peak Signal-to-Noise Ratio (PSNR) as a performance metric. As depicted in the figure, in anti-counterfeiting channels, PSNR gradually increases with a rise in SNR. This suggests that under higher SNR conditions, the noise in the channel is minimized, thus ensuring better image quality. The PSNR fluctuations in the wireless road channels are comparatively higher, lacking a clear trend of increasing with SNR. This can be attributed to the multiple complex interferences in the wireless road channels, leading to unstable PSNR performance. Under similar or close SNR conditions, the PSNR of the anti-counterfeiting channel typically surpasses that of the wireless road channel, indicating a superior signal fidelity in the image transmission process for anti-counterfeiting channels. In contrast, the wireless road channel's image quality might decline due to various disturbances.
Figure 9(b) illustrates the performances of anti-counterfeiting channels and wireless road channels under different SNRs, this time using Structural Similarity Index (SSIM) as the performance metric. As shown in the figure, the SSIM of anti-counterfeiting channels gradually rises with increasing SNR, indicating better image quality under higher SNR conditions due to less channel noise. However, the SSIM changes in wireless road channels are relatively more unstable, showing no apparent trend of increasing with SNR, likely due to complex interferences in these channels. When SNR conditions are similar or close, the SSIM of the anti-counterfeiting channel usually outperforms that of the wireless road channel. Again, this points towards superior signal fidelity in the image transmission process of the anti-counterfeiting channels, while image quality in the wireless road channel might suffer due to various interferences.
As indicated by Figure 10, analysis of different SNR scenarios regarding the Peak-to-Average Power Ratio (PAPR) can be undertaken, both prior to and following suppression. In Figure 10(a), Peak Signal-to-Noise Ratio (PSNR) performance is listed under varying Signal-to-Noise Ratios (SNRs), both before and after PAPR reduction. The graph indicates that the PSNR value increases after PAPR reduction under certain SNR conditions. This suggests that PAPR suppression techniques can improve image quality to a certain extent. However, under other SNR conditions, the PSNR value doesn't increase after PAPR reduction, likely due to the limited improvement these PAPR suppression techniques can bring about to image quality under these circumstances. As SNR increases, a gradual increase in PSNR values is observed, suggesting that a higher SNR ensures better image quality due to less noise in the channel.
Figure 8. Comparison of the PSNR distortion curve for different algorithms
Figure 9. Evaluation of image quality and transmission performance under different signal-to-noise ratio (SNR) conditions across various channels
Figure 10. Compression image quality evaluation and transmission performance under different SNR conditions before and after peak-to-average power ratio suppression
Furthermore, Figure 10(b) depicts Structural Similarity Index Measure (SSIM) performance under various SNRs, both before and after PAPR reduction. An improvement in the SSIM value under certain SNR conditions post PAPR suppression is seen. This suggests that PAPR suppression techniques can improve structural similarity of images to a certain extent. However, under other SNR conditions, the SSIM value does not increase after PAPR reduction, likely due to the limited improvement PAPR suppression techniques can bring about to structural similarity of images under these circumstances. As SNR increases, a gradual increase in SSIM values is observed, suggesting that a higher SNR ensures better structural similarity due to less noise in the channel.
In conclusion, there exist discrepancies in SSIM performance prior to and after PAPR suppression under different SNR scenarios. The potential improvement brought about by PAPR suppression techniques to image structural similarity might be more evident under certain SNR conditions and limited under others. In real communication systems, choosing an appropriate channel and optimizing channel parameters can contribute to enhancing image quality and transmission effectiveness.
This study conducted a study on real-time image transmission and compression algorithms based on wireless sensor networks. A new joint source-channel coding scheme has been constructed, and the quality of the reconstructed image of this scheme is close to the codec scheme optimized for each user's channel conditions. A post-processing network model has been proposed to solve the problem of compression artifacts in order to obtain a better quality of real-time images under high compression ratios and low bit rates. The validity of the proposed method has been confirmed by experimental results. Based on the experimental results, the following conclusions can be drawn:
(1) Under certain Signal-to-Noise Ratio (SNR) conditions, the PSNR (Peak Signal-to-Noise Ratio) and SSIM (Structural Similarity Index) values after Peak-to-Average Power Ratio (PAPR) suppression have improved, indicating that the image quality and structural similarity have been enhanced. However, under other SNR conditions, the PSNR and SSIM values after PAPR suppression did not show significant improvements, which could be due to the limited enhancement of image quality and structural similarity by PAPR suppression technology under these conditions.
(2) As the SNR increases, the PSNR and SSIM values show an overall increasing trend. This suggests that in situations with high SNR, there is less noise in the channel, which ensures better image quality and structural similarity.
(3) In actual communication systems, choosing the appropriate channel and optimizing channel parameters can help to improve image quality and transmission effects. At the same time, the application effect of PAPR suppression technology should be evaluated according to actual conditions in order to improve the performance of the image transmission system. The role of PAPR suppression technology in enhancing image quality and structural similarity may vary depending on the SNR.
These conclusions present the potential to further advance the field of real-time image transmission and compression, particularly in wireless sensor networks, and provides an empirical basis for future exploration.
[1] Wang, K., Yu, C.M., Ku, M.L., Wang, L.C., Jia, W.K. (2022). Joint shortest chain and fair transmission design for energy-balanced PEGASIS in WSNs. IEEE Internet of Things Journal, 10(8): 6803-6817. https://doi.org/10.1109/JIOT.2022.3227599
[2] Mei, X., Han, D., Chen, Y., Wu, H., Ma, T. (2023). Target localization using information fusion in WSNs-based Marine search and rescue. Alexandria Engineering Journal, 68: 227-238. https://doi.org/10.1016/j.aej.2023.01.028
[3] Yadav, P., Sharma, S.C., Singh, O., Rishiwal, V. (2023). Optimized localization learning algorithm for indoor and outdoor localization system in WSNs. Wireless Personal Communications, 130(1): 651-672. https://doi.org/10.1007/s11277-023-10304-8
[4] Benelhouri, A., Idrissi-Saba, H., Antari, J. (2023). An evolutionary routing protocol for load balancing and QoS enhancement in IoT enabled heterogeneous WSNs. Simulation Modelling Practice and Theory, 124: 102729. https://doi.org/10.1016/j.simpat.2023.102729
[5] Xu, B., Lu, M., Zhang, H. (2023). Multi-agent modeling and jamming-aware routing protocols for movable-jammer-affected WSNs. Sensors, 23(8): 3846. https://doi.org/10.3390/s23083846
[6] Yadav, R., Sreedevi, I., Gupta, D. (2023). Augmentation in performance and security of WSNs for IoT applications using feature selection and classification techniques. Alexandria Engineering Journal, 65: 461-473. https://doi.org/10.1016/j.aej.2022.10.033
[7] Chandnani, N., Khairnar, C.N. (2023). A reliable protocol for data aggregation and optimized routing in IoT WSNs based on machine learning. Wireless Personal Communications, 130(4): 2589-2622. https://doi.org/10.1007/s11277-023-10393-5
[8] Elsway, A.A., Khedr, A.M., Alfawaz, O., Osamy, W. (2023). Energy-aware disjoint dominating sets-based whale optimization algorithm for data collection in WSNs. Journal of Supercomputing, 79: 4318-4350. https://doi.org/10.1007/s11227-022-04814-8
[9] Chen, C., Guo, H., Wu, Y., Gao, Y., Liu, J. (2023). A novel two-factor multi-gateway authentication protocol for WSNs. Ad Hoc Networks, 141: 1-13. https://doi.org/10.1016/j.adhoc.2023.103089
[10] Kumar, J.D.S., Subramanyam, M.V., Kumar, A.P.S. (2023). A hybrid spotted hyena and whale optimization algorithm-based load-balanced clustering technique in WSNs. In Lecture Notes in Networks and Systems, 600: 797-809. https://doi.org/10.1007/978-981-19-8825-7_68
[11] Hou, L., Zhang, Q., Qu, H. (2021). Automatic reading recognition system of pointer meters using WSNs with on-sensor image processing. Engineering Research Express, 3(2): 025037. https://doi.org/10.1088/2631-8695/ac0510
[12] Hou, L., Qu, H. (2021). Automatic recognition system of pointer meters based on lightweight CNN and WSNs with on-sensor image processing. Measurement, 183: 109819. https://doi.org/10.1016/j.measurement.2021.109819
[13] Yang, H., Li, X., Wang, Z., Yu, W., Huang, B. (2016). A novel sensor deployment method based on image processing and wavelet transform to optimize the surface coverage in WSNs. Chinese Journal of Electronics, 25(3): 495-502. https://doi.org/10.1049/cje.2016.05.015
[14] Chefi, A., Soudani, A., Sicard, G. (2014). Hardware compression scheme based on low complexity arithmetic encoding for low power image transmission over WSNs. AEU-International Journal of Electronics and Communications, 68(3): 193-200. https://doi.org/10.1016/j.aeue.2013.08.006
[15] Abbas, S.T., Mohammed, H.J., Ahmed, J.S., Rashid, A.S., Alhayani, B., Alkhayyat, A. (2021). The optimization efficient energy cooperative communication image transmission over WSN. Applied Nanoscience, 13: 1665-1677. https://doi.org/10.1007/s13204-021-02100-2
[16] Perumal, B., Ganeshan, A., Jayagopalan, S., Preetha, K.S., Selamban, R., Elangovan, D., Balasubramani, S. (2023) Real time multi view image based fpc plant management with SS data security and low rate attack detection for efficient smart agriculture in WSN. Journal of Intelligent & Fuzzy Systems, 44(1): 91-100. https://doi.org/10.3233/JIFS-220594
[17] Huang, H., Li, Z. (2018). Real-time image transmission algorithm in WSN with limited bandwidth. International Journal of Online Engineering, 14(12): 57-71. https://doi.org/10.3991/ijoe.v14i12.9494
[18] Jiang, A., Zheng, L. (2018). An effective hybrid routing algorithm in WSN: Ant colony optimization in combination with hop count minimization. Sensors, 18(4): 1020. https://doi.org/10.3390/s18041020
[19] Sood, K., Sharma, K., Kumar, A. (2022). Enhanced DV-HOP node localization algorithm based on nearest neighbour distance and hop-count evaluation in WSNs. In 2022 IEEE International IOT, Electronics and Mechatronics Conference (IEMTRONICS), Toronto, ON, Canada, 1-7. https://doi.org/10.1109/IEMTRONICS55184.2022.9795788
[20] Li, G., Liu, Y., Wang, Y. (2014). Analysis of the count-min sketch based anomaly detection scheme in WSN. In 2014 IEEE 13th International Conference on Trust, Security and Privacy in Computing and Communications, Beijing, China, 961-966. https://doi.org/10.1109/TrustCom.2014.127
[21] Kumar, V., Yadav, S., Sandeep, D.N., Dhok, S.B., Barik, R.K., Singh, A.P., Srivastava, G. (2020). Optimal cluster count and coverage analysis in a Gaussian distributed WSNs using TESM. In Frontiers in Intelligent Computing: Theory and Applications: Proceedings of the 7th International Conference on FICTA (2018), 2: 335-345. https://doi.org/10.1007/978-981-13-9920-6_35
[22] Dessart, N., Hunel, P. (2012). Multi-paths individuals count algorithm over WSN. In 2012 International Conference on Wireless Communications in Underground and Confined Areas, Clermont-Ferrand, France, 1-6. https://doi.org/10.1109/ICWCUCA.2012.6402496
[23] Yu, X., Hu, M. (2019). Hop-count quantization ranging and hybrid cuckoo search optimized for DV-HOP in WSNs. Wireless Personal Communications, 108: 2031-2046. https://doi.org/10.1007/s11277-019-06507-7
[24] Tall, H., Chalhoub, G., Misson, M. (2018). W-ETX: Worst-case expected transmission count routing protocol for convergecast WSNs. In 2018 IFIP/IEEE International Conference on Performance Evaluation and Modeling in Wired and Wireless Networks (PEMWN), Toulouse, France, 1-6. https://doi.org/10.23919/PEMWN.2018.8548801
[25] Abdi, A., Boukerche, A., Rho, S. (2020). Leveraging topology and hop count for energy-efficient and reliable data collection in WSNs. Journal of Parallel and Distributed Computing, 139: 15-30.