Yanmei Jiao![]()
© 2023 IIETA. This article is published by IIETA and is licensed under the CC BY 4.0 license (http://creativecommons.org/licenses/by/4.0/).
OPEN ACCESS
Mechanical structures may exhibit defects during long-time high-temperature operation. Infrared image technology quickly and automatically detects mechanical structure defects, improves detection speed and accuracy, and reduces the workload of manual detection. Although high-temperature infrared image processing method has made significant progress in detecting the defects, it still has some shortcomings. Defect features in high-temperature infrared images may not be obvious and are mixed with background information, thus making it difficult to accurately identify and extract them. Therefore, this research studied the detection method of mechanical structure defects after high temperature based on image processing. Transform domain denoising method was used to decompose the transform domains of images, which distinguished signals and noises in the images. Adaptive Contrast Enhancement (ACE) algorithm was used to enhance the images. A feature fusion imaging detection framework for infrared and optical imaging of high-temperature mechanical structures was constructed, which improved the accuracy and reliability of defect detection. Deep neural network was combined with the heuristic fusion section, which further explored deep features in the images and improved the fusion effects. The proposed fusion features were processed using binary tree classification and hierarchical classifier, which accurately identified the abnormal defect regions in the infrared images of high-temperature mechanical structures. The experimental results verified that the proposed method was effective.
high temperature, mechanical structure defects, image legend, feature fusion
Mechanical structures in high-temperature environment are common in practical applications, such as rocket engines, gas turbines, and high-speed train braking system, which may exhibit defects, such as fatigue, deformation, and cracks, during long-time high-temperature operation [1, 2]. Infrared image technology can be used for non-contact detection of mechanical structures in high-temperature environment, by monitoring the health status of structures in real time, detecting potential safety hazards in advance, and avoiding accidents [3-8]. Infrared image technology quickly and automatically detects mechanical structure defects, improves detection speed and accuracy, and reduces the workload of manual detection. Timely detection and treatment of mechanical structure defects effectively extends the service life of equipment, and reduces maintenance costs and equipment replacement frequency [9-18]. It is of important research significance and broad application value to process infrared images of mechanical structures after high temperature and detect their defects, because it helps improve safety, efficiency, and reliability of equipment in various fields.
Due to issues, such as extended service life, environmental corrosion, and unreasonable construction, mechanical structures inevitably have local defects, which affect structural performance and may lead to structural failure. Zhang et al. [19] proposed a multivariable spatio-temporal regression model algorithm to identify local defects, based on structural vibration responses collected using sensor network. First, the study compared the identification results of the univariate regression model, the bivariate spatial regression model, and the bivariate spatio-temporal regression model. Then a multivariable spatio-temporal regression model was proposed, and the robustness of damage index was analyzed. Guo et al. [20] proposed a solar panel defect detection system, which automated the detection process and reduced the need of manual panel detection in large solar power plants. Edge detection was an important technology in digital image processing fields, such as image segmentation and feature extraction. Geometric features of defects were identified by effectively extracting defect edges in infrared images, because image edge contained rich information. Liu et al. [21] analyzed the detection performance of classical edge detection operators and proposed the fuzzy C-means clustering Canny operator algorithm to achieve defect edges in infrared images. The results showed that the algorithm had better performance than classical edge detection operators and identified the geometric features of defects more comprehensively and clearly. Diameters of the defects were calculated based on the image edge detection results. Vandone et al. [22] proposed an algorithm to analyze original thermal infrared images. Images were obtained using the non-destructive laser thermal imaging evaluation method, which aimed to detect the surface defects. Compared with existing methods, the proposed method had some advantages, such as defect detection process automation and better isolation of defect regions by increasing contrast. The algorithm was first verified by analyzing simulated thermal images, and then was confirmed by scanning the surface of carbon fiber reinforced plastics (CFRP) composite plates with induced defects in experiment.
Although high-temperature infrared image processing method has made significant progress in detecting mechanical structure defects, it still has some shortcomings. Infrared images in high-temperature environment may be affected by various interference factors, such as ambient light, smoke, and dust, resulting in low signal-to-noise ratio and affecting the accuracy of defect detection. Defect features in high-temperature infrared images may not be obvious and are mixed with background information, making it difficult to accurately identify and extract them. To overcome these shortcomings, advanced image processing technologies need to be introduced to improve the identification and extraction capability of defect features, such as deep learning and computer vision. At the same time, algorithm design needs to be optimized to reduce computational complexity and improve real-time performance. Therefore, this research studied the detection method of mechanical structure defects after high temperature based on image processing. First, transform domain denoising method was used to decompose the transform domains of images, and to distinguish signals and noises in the images in Chapter 2. ACE algorithm was used to enhance the images. Then a feature fusion imaging detection framework for infrared and optical imaging of high-temperature mechanical structures was constructed in Chapter 3, which improved the accuracy and reliability of defect detection. Deep neural network was combined with the heuristic fusion section, which further explored deep features in the images and improved the fusion effects. In addition, the proposed fusion features were processed using binary tree classification and hierarchical classifier in Chapter 4, which accurately identified the abnormal defect regions in the infrared images. Finally, the experimental results verified that the proposed method was effective.
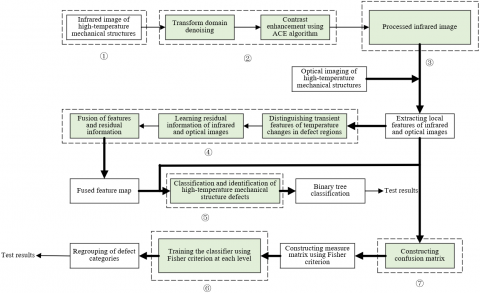
Figure 1 shows the flowchart of the mechanical structure defect detection method after high temperature proposed in this study. Due to the influence of various interference factors on the infrared images of high-temperature mechanical structures, the noise level was relatively high. Therefore, the transform domain denoising method was first used in this study, which decomposed the image into transform domains, and differentiated the signals and noises in the image. That is, the image was decomposed into different frequency sub-bands, which helped separate signals and noises. In addition, the noises were suppressed, which maintained the image's detailed information while removing noises. Let Fl(v,u) and F-l(v,u) be the high-pass filters, (vl,ul) and (-vl,-ul) be their corresponding center coordinates, respectively, and W be the number of notch filtering, then the following formula provided the expression of the transform domain denoising algorithm function:
$F(v, u)=\prod_{l=1}^W F_l(v, u) F_{-l}(v, u)$ (1)
Figure 1. Flowchart of detection method
For a N×M two-dimensional infrared image of high-temperature mechanical structures, the readability of image frequency domain was ensured in an ideal state based on frequency shift processing. With (M/2,N/2)(N/2,M/2) as the center of the frequency domain rectangle, frequency shift was achieved by multiplying it with (-1) Aa+b. The distance calculation formulas in the filter expression were provided as follows:
$C_l(v, u)=\left[\left(v-N / 2-v_l\right)^2+\left(u-M / 2-u_l\right)^2\right]^{\frac{1}{2}}$ (2)
$C_{-l}(v, u)=\left[\left(v-N / 2+v_l\right)^2+\left(u-M / 2+u_l\right)^2\right]^{\frac{1}{2}}$ (3)
Based on features of the infrared image, ACE algorithm needed to be used for contrast enhancement of the image, because the image had low contrast and did not have obvious defect features, making it difficult to directly and accurately detect them. ACE algorithm first divided the image into blocks, then calculated the contrast of each local region and adaptively adjusted based on the contrast value, and finally merged each local region to obtain the enhanced image. By adaptively adjusting the contrast of local regions, ACE algorithm improved the overall image contrast while maintaining local details, which helped highlight the defect features in the image, thus improving the accuracy and reliability of defect detection. The core of the ACE algorithm used in this study was the calculation of contrast gain. Let g(r,l) be the pixel values at point (r,l), N(i,j) be with (i,j) as the center, [2m+1,2n+1] be the local average value of the window size region, and ε(i,j) be the standard deviation of the image region, then the local average value and standard deviation of each data point in the image were calculated based on the following formulas:
$N(i, j)=\frac{1}{(2 m+1)(2 n+1)} \sum_{r=i-m}^{i+m} \sum_{l=j-n}^{j+n} g(r, l)$ (4)
$\varepsilon^2(i, j)=\frac{1}{(2 n+1)(2 m+1)} \sum_{s=i-m}^{i+m} \sum_{l=j-n}^{j+n}(g(r, l)-N(i, j))^2$ (5)
After obtaining the local average value and standard deviation, adaptive adjustments were made based on the contrast value of each local region. The contrast was increased for low-contrast regions, and was maintained or appropriately reduced for high-contrast ones, which helped maintain the overall effects of the image while highlighting details and defect features. Let N be the global average value, and β be the adjustable coefficient parameter, then the image enhancement formulas were provided as follows:
$h(i, j)=N(i, j)+H(g(i, j)-N(i, j))$ (6)
$H=\beta \frac{N}{\varepsilon(i, j)}, 0<\beta<1$ (7)
After adaptive contrast adjustment, the local regions merged into a complete image. At this time, the contrast and detailed information of the image were significantly enhanced. According to practical application requirements, parameters were adjusted to achieve the best enhancement effects, such as the size of local regions and contrast adjustment strategies.
Defects may lead to decreased structural performance of mechanical structures in high-temperature environment, and even cause structural damage, affecting their stability. At the same time, defects accelerate the wear and aging of mechanical structures in high-temperature environment, and may even cause accidents, such as fires and explosions, posing a threat to the safety of personnel and mechanical structures.
Quantitative evaluation of defects monitors the health status of mechanical structures in real time, identifies potential safety hazards in advance, and avoids accidents. Timely detection and treatment of defects helps reduce the maintenance and replacement costs of mechanical structures. Multi-physical imaging technology and deep learning method can be used to achieve automated and efficient defect detection and evaluation, and to make more reasonable mechanical structure maintenance plans. Combined with multiple imaging modes, such as infrared imaging and optical imaging, deep learning technology can be used for multimodal information fusion, which intelligently optimizes detection strategies and parameter adjustments, and effectively improves the accuracy and reliability of defect detection, thus helping ensure the safety of mechanical structures, extend the lifespan of mechanical equipment, improve production efficiency, and reduce enterprise operating costs, which has important practical significance and application value.
Figure 2. Schematic diagram of image feature extraction based on deep neural network
In order to integrate useful information of infrared and optical images, this study constructed a feature fusion imaging detection framework for infrared and optical imaging, which aimed to improve the accuracy and reliability of detecting high-temperature mechanical structure defects. Deep neural network was combined with the heuristic fusion section, which further explored deep features in the image and improved the fusion effects. Figure 2 shows a schematic diagram of image feature extraction based on deep neural network. As a deep learning method based on supervised learning, deep mode region learning trained neural network using labeled infrared and optical images, and learned local patterns and regional information in the images. Features were extracted layer by layer in a multi-layer network, which achieved high-level feature fusion of infrared and optical images. As a deep learning method based on unsupervised learning, deep residual fusion network (DRFN) learned feature representation in infrared and optical images using unsupervised learning methods, such as AutoEncoder or generative adversarial network (GAN). During the fusion process, deep residual network was used to learn residual information of infrared and optical images, thus achieving more precise feature fusion. This research studied the efficient fusion of infrared and optical imaging features of high-temperature mechanical structures based on two types of networks.
DRFN mainly included four parts, namely, input layer, feature extraction layer, fusion layer, and the classifier. Infrared thermal imager recorded the spatial distribution changes of surface temperature and temperature transient response of mechanical structures in high-temperature environment. From a mathematical perspective, let B¯ be the tensor containing spatial-transient information, Ma×Mb×M be the dimension, Ma×Mb be the corresponding space, and M be the corresponding transient state. Finally, the recorded infrared and optical images were input into the input layer together.
Composed of multiple convolutional and pooling layers, the feature extraction layer was used to extract local features of infrared and optical images. Before entering the feature extraction layer, this study separated the principal components of the thermal imaging sequence and used principal component analysis, which had the ability to automatically extract spatial and temporal patterns, to distinguish transient features of temperature changes in defect regions. In order to facilitate the calculation of principal component analysis, the three-dimensional tensor of input mechanical structure surface temperature needed to be converted into a two-dimensional matrix. Let U∈RMa×Mb×M be the entire thermal imaging video sequence, B(p)∈RC×M be the vectorized result of U∈RMa×Mb×M frame by frame, where C=Ma×Mb, B(p) be a mixture of observation results, An(p) be the thermal mode features of thermal imaging sequence, n=1,2,...,N be the corresponding sequence numbers of features separated by principal component analysis, and qn be the mixing parameter, then An(p) had regional features with different spatio-temporal distributions, which were correspondingly divided into various principal components. The expression of B(p), which was considered as a linear instantaneous mixed model, was provided as follows:
$B(p)=\sum_{n=1}^N q_n A_n(p)$ (8)
where, A’n(p)=[vec(A1(p)),vec(A2(p)),...,vec(AN(p))].
The fusion layer of DRFN fused the extracted infrared and optical image features, using weighted sum, feature cascading, or other feature fusion techniques. The classifier or regressor were used for defect detection or quantitative evaluation according to the fused features. Binary tree classification method and hierarchical classifier were used in this study, and introduced in the next chapter. DRFN constructed network structure using the deep learning framework PyTorch and used labeled infrared and optical images for training. During the training process, stochastic gradient descent (SGD) was used for weight update. After the training was completed, the network was applied to actual defect detection tasks of high-temperature mechanical structures.
Figure 3. Schematic diagram of DRFN structure
Architecture of DRFN mainly included four parts, namely, input layer, feature extraction layer, residual learning layer, and fusion layer. Figure 3 shows a schematic diagram of the DRFN structure. The input layer was used to receive infrared and optical images. Also composed of multiple convolutional and pooling layers, the feature extraction layer was used to extract feature representations of infrared and optical images. The residual learning layer learned residual information of infrared and optical images using deep residual network, such as ResNet. The fusion layer, which was designed based on L1 norm, fused the features extracted by the feature extraction layer with the residual information learned by the residual learning layer. The L1 norm of each point (a,b) was first calculated using the extracted transient features of temperature changes. Let Ψmi(i=1,...,l) be the high-dimensional features extracted by the encoder from the input image of the i-th imaging system, l≥2 be the number of imaging systems, m=1,2,...,M(M=64) be the sequence number of corresponding feature in the high-dimensional feature map, and M be the total amount of output features for each input image. Based on the regional average operator in the L1 norm graph, the activity level evaluation graph Ni(a,b) corresponding to each input image was calculated, which obtained:
$N_i(a, b)=\frac{\sum_{x=a-1}^{a+1} \sum_{y=b-1}^{b+1}\left\|\Psi_i^{i: M}(x, y)\right\|_1}{9}$ (9)
Let Qi(a,b) be the weighted mask of each input image, then Qi(a,b) was further calculated:
$Q_i(a, b)=\frac{N_i(a, b)}{\sum_{j=1}^l N_j(a, b)}$ (10)
Let Ψmg(a,b) be the fused feature map, then it was calculated using the following formula:
$\Psi_g^m(a, b)=\sum_{i=1}^l Q_i(a, b) \Psi_i^m(a, b)$ (11)
Figure 4. Schematic diagram of encoder structure
After infrared and optical images were fused, the feature map was finally processed to reconstruct the fusion image. DRFN built network structure using PyTorch and used unlabeled infrared and optical images for training. During the training process, AutoEncoder was used for feature representation and residual information learning. After the training was completed, the network was applied to actual defect detection tasks of high-temperature mechanical structures. Figure 4 shows a schematic diagram of the encoder structure.
In order to identify and classify multiple abnormal defect regions that may exist in the infrared image of high-temperature mechanical structures, image cropping and segmentation techniques needed to be used first to divide the original image into single suspicious region. Then contour image and single suspicious region image were used as the basis for classification and identification of high-temperature mechanical structural defects.
For the feature fusion results in the previous section, global and regional fusion features, which were helpful for classification and identification, needed to be further selected from high-temperature mechanical structure image. Finally, binary tree classification and hierarchical classifier were used to process these features, which accurately identified the abnormal defect regions in the infrared image of high-temperature mechanical structures.
Binary tree classification is a classification method based on tree structure, where each non-leaf node represents a judgment condition, and the dataset is divided into two parts according to the conditions. This classification method is easy to understand and implement, and splits based on the importance of features, which helps identify key features.
After building binary tree structure, the number of levels in the binary tree was determined. The multi-classification problem of classifying and identifying high-temperature mechanical structure defect image was decomposed into a series of binary classification subproblems, that is, the problems of "hot spots" and "cold spots" on the surface of high-temperature mechanical structures.
In the infrared image of high-temperature mechanical structures, occurrence of "hot spots" and “cold spots" usually meant that the temperature distribution on the structure surface was uneven, may indicating potential problems in the structure. Specifically, the hot spots in the infrared image indicated that the temperature of certain region was relatively high, which may mean that the parts in the mechanical structures rubbed or wore during movement, resulting in hot stars and increased local temperature. Damaged bearing or poor lubrication, and excessive load borne by the mechanical structures may also lead to increased local temperature.
Cold spots in infrared image indicated relatively low temperature in certain region, which may mean excessive heat dissipation in local regions, leading to decreased temperature. Cold spots reflected structural defects, such as cracks and delamination, which hindered local heat conduction. Uneven material composition or thickness may lead to changes in the thermal conductivity characteristics of local regions, resulting in cold spots.
Each node in the binary tree structure corresponded to a binary classification problem of "hot spots" and "cold spots", with the left and right sub-nodes representing two subcategories respectively. The tree stopped growing, when the preset tree depth was reached, the number of samples contained in leaf nodes was lower than a certain threshold, or the purity of nodes was higher than a certain threshold. For each node, after selecting a feature and a partition threshold, the sample of the current node was allocated to the left or right sub-nodes based on whether the feature value was greater than the threshold. Appropriate binary classification algorithm was used to train the classifier of each node. The third and fourth steps were repeated for each sub-node until the stop conditions were met.
Figure 5. Hierarchical classifier structure diagram
Notes: 1. Friction or wear
2. Damaged bearing or poor lubrication
3. Excessive load borne by the mechanical structures
4. Cracks and delamination
5. Heat dissipation problems
The hierarchical classifier is a hierarchical classification method, which first classifies data at coarse-grained level, and then continues to classify data at fine-grained level within each coarse-grained category. This method has strong scalability and effectively handles the imbalance problem between categories. Hierarchical classification avoids one-time complex classification of the entire dataset, which reduces computational costs. The key to designing a hierarchical classifier is to set the hierarchical structure, that is, to determine the number of layers of the classifier and the classification task for each layer based on the relationships between categories. For each layer, after selecting appropriate features and classification criteria based on the classification task of the current layer, the input samples are allocated to different subcategories.
Adaptive hierarchical classifier structure was constructed in this study based on Fisher criterion and confusion matrix, which effectively classified five types of high-temperature mechanical structure defects. Figure 5 shows the structure diagram.
The dataset was divided into training and testing sets. A classifier based on Fisher criterion was trained on the training set, and then was used for prediction on the testing set. According to the prediction results and the real category, a confusion matrix was constructed to measure the similarity between modes. The confusion matrix DN was given by the following formula:
$D N=\left(\begin{array}{lll}d n_{11} & \cdots & d n_{1 m} \\ \vdots & \ddots & \vdots \\ d n_{m 1} & \cdots & d n_{m m}\end{array}\right)$ (12)
The confusion matrix was analyzed to determine the category pairs with high similarity, which were divided into groups and formed a coarse-grained hierarchical structure. In each coarse-grained category, Fisher criterion was used continuously to construct a measure matrix for finer grained classification. The calculation method of the measure matrix was given by the following formula:
$k n_{i j}=\left\{\begin{array}{l}0, i=j \\ (D i-D j)^2=\sum_{l=1}^M\left(d n_{i l}-d n_{j l}\right)^2, i \neq j\end{array}\right.$ (13)
The measure matrix was a symmetric matrix, and its similarity measure PN was normalized, which obtained the following formula:
$p n_{V, i j}=k n_{i j} / p_{\max }$ (14)
The Fisher criterion was used to train the classifier at each level. For the coarse-grained classifier, eigenvectors were input and category groups were output. For the fine-grained classifier, eigenvectors were input and specific defect categories were output. Finally, after setting similarity threshold β and dissimilarity threshold γ, the categories were regrouped according to the following rules:
(1) If pnV,ij≤β, i and j were combined to form a composable set Hn={Di,Dj}. If pnV,ij≥γ, i and j were combined to form a combined set Hm={Di,Dj}. At this time, if Hnl∩Hn2=∅, then the two were merged into a composable set.
(2) If β≤pnV,ij≤γ, in the composable set H={Di,Dl} and the non-composable set H’={Di,Dj}, j could not be added to H.
(3) If β≤pnV,ij, and pnV,il≤γ, as well as composable sets H1={Dj,Dl} and H2={Di,Dl} existed, they were combined only when pnV,ij≤γ and pnV,fl≤γ.
Denoising and enhancement processing effects of infrared images of high-temperature mechanical structures using transform domain denoising method and ACE algorithm were analyzed based on Table 1.
Table 1. Quantitative evaluation of image preprocessing results
|
Defect type |
Peak signal-to-noise ratio |
Entropy |
Structural similarity |
||
|
Original image |
Processed image |
Original image |
Processed image |
||
|
Friction or wear |
38.01 |
42.81 |
6.99 |
7.31 |
1.00 |
|
Bearing problems |
36.31 |
42.61 |
7.12 |
7.32 |
1.00 |
|
Excessive load |
41.03 |
43.91 |
6.81 |
7.03 |
1.00 |
|
Cracks and delamination |
38.31 |
42.92 |
7.02 |
7.22 |
1.00 |
|
Material problems |
37.15 |
42.85 |
7.03 |
7.25 |
1.00 |
Table 2. Measure matrix
|
Measure matrix |
Prediction category |
|||||
|
Friction or wear |
Bearing problems |
Excessive load |
Cracks and delamination |
Material problems |
||
|
Real category |
Friction or wear |
1 |
1.5131 |
1.7151 |
1.3415 |
1.122 |
|
Bearing problems |
0 |
0 |
1.7215 |
1.2415 |
1.2341 |
|
|
Excessive load |
1 |
0 |
0 |
1.6154 |
1.5154 |
|
|
Cracks and delamination |
0 |
1 |
0 |
0 |
1.0631 |
|
|
Material problems |
1 |
1 |
0 |
1 |
0 |
|
Table 3. Normalized similarity metric matrix
|
Normalized similarity metric matrix |
Prediction category |
|||||
|
Friction or wear |
Bearing problems |
Excessive load |
Cracks and delamination |
Material problems |
||
|
Real category |
Friction or wear |
0 |
0.8151 |
0.9151 |
0.7165 |
0.6151 |
|
Bearing problems |
0 |
0 |
1.0211 |
0.7125 |
0.7151 |
|
|
Excessive load |
1 |
0 |
0 |
0.9646 |
0.9151 |
|
|
Cracks and delamination |
0 |
0 |
1 |
0 |
0.6114 |
|
|
Material problems |
0 |
1 |
0 |
0 |
0 |
|
Table 4. Classification results of the hierarchical classifier
|
Classification results of the hierarchical classifier |
Prediction category |
|||||
|
Insulation layer detachment |
Bearing problems |
Excessive load |
Cracks and delamination |
Material problems |
||
|
Real category |
Friction or wear |
1 |
0 |
0 |
0 |
0 |
|
Bearing problems |
0 |
1 |
0 |
0 |
0 |
|
|
Excessive load |
0 |
0 |
1 |
0 |
0 |
|
|
Cracks and delamination |
0 |
0 |
0.05 |
1 |
0 |
|
|
Material problems |
0 |
0 |
0 |
0 |
1 |
|
As shown in Table 1, after the transform domain denoising method and ACE algorithm were used, all indexes of the infrared images improved. The Peak Signal to Noise Ratio (PSNR) of the processed image improved among all defect types, indicating that the quality of the processed image improved with obvious denoising effects compared with the original image. In addition, the entropy of the processed image also increased among all defect types. Higher entropy indicated richer information in the image because entropy represented the amount of information in the image. Therefore, the results indicated that the processed image contained more information on defects, which helped improve the identification accuracy. The structural similarity (SSIM) values in the table were all 1.00, indicating high structural similarity between the processed and the original images. This meant that the processing process improved image quality while preserving the original structural information of the image, which was beneficial for subsequent defect identification. In summary, the transform domain denoising method and ACE algorithm had significant processing effects of the infrared image of high-temperature mechanical structures. The processed image was improved in terms of quality, amount of information, and structural similarity, which helped improve the accuracy and reliability of subsequent defect identification.
Tables 2 and 3 present the calculated measure matrix and normalized similarity metric matrix. Table 4 presents the final classification results of five types of high-temperature mechanical structure defects processed by the infrared image.
As shown in the above table, when the five types of high-temperature mechanical structure defects processed by the infrared image were classified using the hierarchical classifier, most of the predicted results were consistent with the real categories. The classifier fully and accurately predicted four types of defects, namely, friction or wear, bearing problems, excessive load, and material problems, demonstrating high accuracy. In addition, the classifier had high prediction accuracy (95%) for the defect category of cracks and delamination. According to the analysis in the above table, the hierarchical classifier has accurately identified high-temperature mechanical structure defects in most cases, indicating that the proposed defect identification method is effective. Although the classifier has certain errors in identifying the defect category of cracks and delamination, the overall accuracy is still high and can be used as the basis for practical applications. The method rapidly and accurately identified high-temperature mechanical structure defects, which helped reduce equipment failures, improve production efficiency, and reduce maintenance costs. At the same time, early identification and treatment of these defects ensured personnel safety and avoided safety accidents caused by equipment failures.
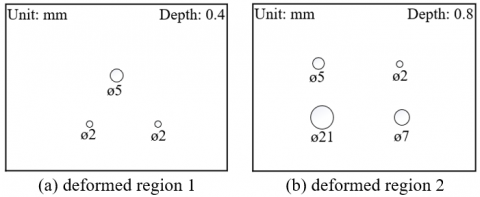
In the experiment of manually preset buried mechanical structure defects, the circular defect regions and material bonding regions were taken as examples in this study. First, representative mechanical structure materials were selected, such as steel and aluminum, to ensure the certain-degree universality of experimental results. Different types of defects were created on experimental materials, such as circular defects, cracks, and delamination. In order to facilitate observation and analysis, the surface of the materials was colored to highlight defects. Cutting tools, such as drills and cutting machines, were used to create circular defects on mechanical structure materials. Circular defects with different sizes and depths were created according to actual needs. However, the defects should have regular shapes and flat edges. The defect regions were covered with a layer of materials similar to the mechanical structure materials, which simulated the possibly buried defects in actual situations. During the covering process, the covering layer should have moderate thickness, no bubbles, and be closely adhered to the base materials. The infrared image was used to detect preset buried defects in order to evaluate the effectiveness of different detection techniques in identifying defects. Figure 6 shows the quantitative analysis results of infrared thermal imaging. Figure 7 shows a schematic diagram of the test pieces.
Figure 6. Quantitative analysis results of infrared thermal imaging
Figure 7. Schematic diagram of the test pieces
Table 5. Detection performance comparison results of different algorithms
|
Test piece |
Evaluation index |
PCA |
SVM |
RF |
CNN |
DBN |
DBSCF |
SIASM |
TSR |
The method in this study |
|
1 |
F-score |
1.01 |
1.03 |
0.99 |
1.03 |
1.01 |
1.06 |
1.02 |
0.91 |
1.03 |
|
SNR |
2.21 |
2.42 |
3.92 |
2.33 |
2.33 |
2.88 |
1.84 |
1.31 |
3.9 |
|
|
2 |
F-score |
0.87 |
1.03 |
1.03 |
1.06 |
1.67 |
1.01 |
0.84 |
0.87 |
1.05 |
|
SNR |
0.33 |
0.61 |
0.41 |
1.66 |
0.78 |
1.67 |
0.56 |
0.31 |
5.6 |
|
|
3 |
F-score |
0.64 |
0.91 |
0.71 |
0.59 |
2.06 |
0.78 |
0.66 |
0.66 |
0.94 |
|
SNR |
4.91 |
1.41 |
2.23 |
1.03 |
1.83 |
2.06 |
1.83 |
4.21 |
4.06 |
|
|
4 |
F-score |
0.81 |
1.33 |
1.6 |
3.06 |
1.03 |
1.31 |
1.03 |
1.51 |
1.05 |
|
SNR |
1.51 |
3.42 |
3.42 |
3.54 |
2.21 |
2.23 |
2.21 |
0.51 |
4.77 |
|
|
5 |
F-score |
1.03 |
0.92 |
0.91 |
0.92 |
0.91 |
0.89 |
0.91 |
0.94 |
1.02 |
|
SNR |
1.74 |
1.98 |
1.98 |
NaN |
NaN |
1.41 |
2.41 |
2.41 |
2.71 |
|
|
6 |
F-score |
1.10 |
1.10 |
1.10 |
1.10 |
1.10 |
1.10 |
1.10 |
1.10 |
1.10 |
|
SNR |
1.10 |
1.10 |
1.10 |
1.10 |
1.10 |
1.10 |
1.10 |
1.10 |
1.10 |
Table 6. Comparison results of run time in different algorithms
|
Test piece |
PCA |
SVM |
RF |
CNN |
DBN |
DBSCF |
SIASM |
TSR |
The method in this study |
|
1 |
0.7 |
1.8 |
61.8 |
124.4 |
20.3 |
240.6 |
11.4 |
202.6 |
6.5 |
|
2 |
1.3 |
2.3 |
65.3 |
130.6 |
22.1 |
273.7 |
13.5 |
231.5 |
7.3 |
|
3 |
0.8 |
2.2 |
63.5 |
128.3 |
21.6 |
265.6 |
12.3 |
210.6 |
6.8 |
|
4 |
0.7 |
1.8 |
59.4 |
114.6 |
20.1 |
254.8 |
9.9 |
204.3 |
7.2 |
|
5 |
0.6 |
1.6 |
42.7 |
103.8 |
15.6 |
223.4 |
8.2 |
189.6 |
6.4 |
|
6 |
0.5 |
0.8 |
35.7 |
82.6 |
11.6 |
189.6 |
8.4 |
145.6 |
4.1 |
|
7 |
0.6 |
1.2 |
39.6 |
83.6 |
11.5 |
190.6 |
9.4 |
152.4 |
4.3 |
|
8 |
0.6 |
1.3 |
46.5 |
99.4 |
14.3 |
203.6 |
9.8 |
165.3 |
4.4 |
|
9 |
0.5 |
1.2 |
38.4 |
95.7 |
13.8 |
189.6 |
9.3 |
152.6 |
4.2 |
|
10 |
0.5 |
1.1 |
38.5 |
90.6 |
12.6 |
180.5 |
8.5 |
144.3 |
3.85 |
|
11(1) |
1.3 |
2.1 |
68.7 |
124.6 |
15.4 |
281.6 |
11.6 |
214.6 |
7.1 |
|
12(2) |
1.4 |
1.6 |
60.7 |
130.5 |
14.6 |
254.6 |
13.4 |
189.6 |
5.2 |
|
Average value |
0.9 |
1.5 |
51.7 |
109.6 |
16.1 |
231.6 |
10.5 |
183.5 |
5.4 |
Table 5 presents the detection performance comparison results of different algorithms. Th performance of different algorithms in identification and detection of high-temperature mechanical structure defects was compared and analyzed based on the above table. The table focused on two evaluation indexes, F-score and signal-to-noise ratio (SNR). The former referred to F value, a comprehensive index measuring the accuracy and recall of the classifier. The latter referred to an index measuring image quality. The DBSCF, SIASM, and the method proposed in this study had high F-score values on most test pieces, indicating that these three methods had good performance in the accuracy and recall of defect identification. However, other algorithms also had high F-score values on certain test pieces, such as PCA, SVM, RF and so on, indicating that these algorithms also had certain defect identification capability. The method proposed in this study had high SNR values on most test pieces, indicating that the method had advantages in image quality. The SNR values of other algorithms fluctuated significantly, indicating that they had unstable performance when dealing with different test pieces. In summary, the method proposed in this study performed well in identifying and detecting high-temperature mechanical structure defects, with high F-score and SNR values. Although the SIASM method also had advantages in F-score, its performance in SNR was unstable. Other algorithms, such as PCA, SVM, and RF, also identified defects on certain test pieces to some extent, but their overall performance was relatively low.
Table 6 presents the comparison results of run time in different algorithms. According to the above table, PCA and SVM methods had relatively short run time on most test pieces, indicating that these two methods had advantages in computational complexity and were suitable for scenarios with high real-time requirements. The RF, CNN, DBN, and DBSCF methods had longer run time on most test pieces, especially the DBSCF method, which may not be suitable for scenarios with high real-time requirements. These methods may require a longer training and optimization process, but may provide higher identification accuracy in some cases. The run time of the method in this study on most test pieces was somewhere between that of other algorithms, indicating that it achieved a good balance between computational complexity and identification performance.
Based on image processing, the detection method of mechanical structure defects after high temperature was studied in this research. Transform domain denoising method was used to decompose the transform domains of images in order to distinguish the signals and noises. ACE algorithm was used for image enhancement. A feature fusion imaging detection framework for infrared and optical imaging of high-temperature mechanical structures was constructed, which improved the accuracy and reliability of defect detection. Deep neural network was combined with the heuristic fusion section, which further explored deep features in the images and improved the fusion effects. Binary tree classification and hierarchical classifier were used to process the proposed fusion features, which accurately identified the abnormal defect regions in the infrared images of high-temperature mechanical structures. Combined with the experiment, denoising and enhancement processing effects of the infrared images using transform domain denoising method and ACE algorithm were analyzed, which verified the significant processing effects of the method and the algorithm. The final classification results of five types of high-temperature mechanical structural defects processed by the infrared images were provided, which verified that the hierarchical classifier accurately identified the defects in most cases, indicating that the proposed defect identification method was effective. The detection performance comparison results of different algorithms were provided, which verified that the method proposed in this study performed well in identifying and detecting high-temperature mechanical structure defects, with high F-score and SNR values and fast run time, thus verifying the effectiveness of the proposed method.
[1] Tie, G., Zhou, H., Shi, F., Chen, J., Qiao, S., Tian, Y., Song, C. (2023). Equipment for in situ measurement of machining defects of large aperture optical elements. International Journal of Applied Glass Science, 14(1): 3-6. https://doi.org/10.1111/ijag.16593
[2] Chen, J., Li, Y., Chen, J., Liu, D., Yang, Y. (2022). Identification of typical partial discharge defects of distribution system equipment based on classification learner. In 2022 7th Asia Conference on Power and Electrical Engineering (ACPEE), Hangzhou, China, pp. 2025-2029. https://doi.org/10.1109/ACPEE53904.2022.9783924
[3] Shang, G., Yao, N., Gong, Z., Mu, Y. (2021). Soft sensing image analysis and processing method of substation equipment defects. Journal of Physics: Conference Series, 2037: 012035. https://doi.org/10.1088/1742-6596/2037/1/012035
[4] Liu, M., Zhang, F., Liu, X., Yu, X., Liu, Y. (2021). Intelligent detection method of DR detection equipment assembly defects based on x-ray digital imaging. In 2020 International Conference on Optoelectronic Materials and Devices, Guangzhou, China, pp. 257-261. https://doi.org/10.1117/12.2592269
[5] Shi, Z., Zhao, Y., Liu, Z., Zhang, Y., Ma, L. (2021). Diagnosis and classification decision analysis of overheating defects of substation equipment based on infrared detection technology. Scientific Programming, 2021: 3356044. https://doi.org/10.1155/2021/3356044
[6] Kinsht, N.V., Petrunko, N.N. (2021). Discrete diagnostic model of many high-voltage equipment insulation defects. Optoelectronics, Instrumentation and Data Processing, 57: 195-201. https://doi.org/10.3103/S8756699021020084
[7] Kluge, P., Starzyński, J. (2020). Comparison of methods of recognition and classification of insulation defects of power equipment. In 2020 IEEE 21st International Conference on Computational Problems of Electrical Engineering (CPEE), Poland, pp. 1-4. https://doi.org/10.1109/CPEE50798.2020.9238752
[8] Wen, T., Zhang, Q., Ma, J., Wu, Z., Shimomura, N., Chen, W. (2019). A new method to evaluate the effectiveness of impulse voltage for detecting insulation defects in GIS equipment. IEEE Transactions on Dielectrics and Electrical Insulation, 26(4): 1301-1307. https://doi.org/10.1109/TDEI.2019.008010
[9] Kong, F., Zhao, K., Ma, J., Zhuang, T., Li, H., Gao, S., Liu, J., Zhang, C. (2022). Multiple detection of insulation defects partial discharge in gas insulated equipment. Frontiers in Energy Research, 10: 937599. https://doi.org/10.3389/fenrg.2022.937599
[10] Wang, H., Cao, J., Lin, D. (2019). Deep analysis of power equipment defects based on semantic framework text mining technology. CSEE Journal of Power and Energy Systems, 8(4): 1157-1164. https://doi.org/10.17775/CSEEJPES.2019.00210
[11] Zang, Y., Niasar, M.G., Ganeshpure, D.A., Qian, Y., Sheng, G., Jiang, X., Vaessen, P. (2022). Partial discharge behavior of typical defects in power equipment under multilevel staircase voltage. IEEE Transactions on Dielectrics and Electrical Insulation, 29(4): 1563-1573. https://doi.org/10.1109/TDEI.2022.3185567
[12] Tashbulatov, R., Valeev, A., Tokarev, A. (2022). Developing an algorithm to locate defects in industrial equipment with stationary and non-stationary parameters using strain gauge signal analysis. In 2022 International Conference on Industrial Engineering, Applications and Manufacturing, Sochi, Russian Federation, pp. 926-930. https://doi.org/10.1109/ICIEAM54945.2022.9787226
[13] Zhao, Q., Lv, Y., Tian, J., Ding, H.E, Chen, J.C., Li, C., Gao, S. (2022). Multi-label text mining method for electrical equipment defects based on improved CNN-SVM. In 2022 Power System and Green Energy Conference (PSGEC), Shanghai, China, pp. 554-559. https://doi.org/10.1109/PSGEC54663.2022.9880999
[14] Shi, H., Tian, Y., Wang, Y., Zhu, G., Wang, S., Li, Z., Huang, X. (2022). Study on discharge mode and characteristics of insulation defects in GIS equipment. In 2022 9th International Conference on Condition Monitoring and Diagnosis (CMD), Kitakyushu, Japan, pp. 429-432. https://doi.org/10.23919/CMD54214.2022.9991428
[15] Zhang, Z., Li, J., Song, Y., Sun, Y., Zhang, X., Hu, Y., Guo, R., Han, X. (2022). A novel ultrasound-vibration composite sensor for defects detection of electrical equipment. IEEE Transactions on Power Delivery, 37(5): 4477-4480. https://doi.org/10.1109/TPWRD.2022.3171713
[16] Zhu, L., Tian, N., Li, W., Yang, J. (2022). A text classification algorithm for power equipment defects based on random forest. International Journal of Reliability, Quality and Safety Engineering, 29(5): 2240001. https://doi.org/10.1142/S0218539322400010
[17] Slimane, A., Kebdani, S., Bouchouicha, B., Benguediab, M., Slimane, S., Bahram, K., Chaib, M., Sardi, N. (2018). An interactive method for predicting industrial equipment defects. The International Journal of Advanced Manufacturing Technology, 95: 4341-4351. https://doi.org/10.1007/s00170-017-1416-5
[18] Okazaki, T., Okusa, K., Yoshida, K. (2019). Prediction of the number of defects in image sensors by VM using equipment QC data. IEEE Transactions on Semiconductor Manufacturing, 32(4): 434-437. https://doi.org/10.1109/TSM.2019.2941585
[19] Zhang, X., Tang, H., Zhou, D., Chen, S., Zhao, T., Xue, S. (2020). Numerical and experimental verification of a multiple-variable spatiotemporal regression model for grout defect identification in a precast structure. Sensors, 20(11): 3264. https://doi.org/10.3390/s20113264
[20] Gao, X., Munson, E., Abousleman, G.P., Si, J. (2015). Automatic solar panel recognition and defect detection using infrared imaging. In Automatic Target Recognition XXV, Baltimore, MD, United States, pp. 196-204. https://doi.org/10.1117/12.2179792
[21] Liu, J.Y., Tang, Q.J., Wang, Y., Lu, Y.M., Zhang, Z.P. (2014). Defects’ geometric feature recognition based on infrared image edge detection. Infrared Physics & Technology, 67: 387-390. https://doi.org/10.1016/j.infrared.2014.07.024
[22] Vandone, A., Rizzo, P., Vanali, M. (2012). Two-stage automated defect recognition algorithm for the analysis of infrared images. Research in Nondestructive Evaluation, 23(2): 69-88. https://doi.org/10.1080/09349847.2011.630557