Kerim Karadag
© 2022 IIETA. This article is published by IIETA and is licensed under the CC BY 4.0 license (http://creativecommons.org/licenses/by/4.0/).
OPEN ACCESS
Photovoltaic panels are subject to thermomechanical stresses during their production and subsequent life stages. These conditions give rise to cracks and other defects in panels that can affect power output. Cell cracking is one of the most important causes of power loss in photovoltaic panels. Therefore, photovoltaic panels and cells need to be monitored to achieve the maximum output during production and further downstream. Electroluminescent imaging is a powerful and established technique consisting of many electrically connected solar cells arranged on a grid, and it is employed in order for assessing the quality of photovoltaic panels. In this study, the detection of photovoltaic panel defects in electroluminescent images was examined through image processing methods. PV panels can consist of different numbers of cells. Performance evaluation is made on a cell-based and whole module basis. In PV panel production, unlike EL images taken in standard environments in the factory environment, EL images taken under field conditions require preprocessing before actually being processed. Features were extracted from the preprocessed EL images by exploiting Gabor filter. The obtained features were evaluated as cell-based and the stability of the cells was determined. The performance of the panel was calculated according to the power loss of the cells of the panel. When the calculated performance values were compared with the power values obtained by I-V measurement, the highest error was found to be 0.059, the lowest error was 0.004, and the average error was 0.0213. As a result, the highest success rate was 99.99%.
photovoltaic panels, electroluminescent, Gabor filter, prediction, efficiency
Due to the increasing energy demand across globe, the installation of photovoltaic (PV) power plants has been increasing around the world in recent years. Solar energy is a free, inexhaustible and environmentally harmless resource. The efficiency of any power plant depends on its error-free operation. Reliability and power output are reduced due to failure of the PV systems. In PV plants, internal and external faults normally cause an increase in the temperature, which is easily detected by different methods [1]. The high temperatures occurring in the panels indicate that there is a malfunction in the electricity production of the cells in the panel. In addition, faults in fasteners can be detected by thermal cameras since they cause overheating. These high temperature differences can be detected from thermal images by means of image processing methods. PV modules are exposed to thermomechanical stresses during their manufacturing and subsequent life stages. These conditions cause cracks and other defects in modules, which can affect power output. Cell cracking is one of the major causes of power loss in PV modules. Therefore, PV modules and cells need to be monitored to achieve the maximum output during production and further downstream. In this regard, both maintenance and inspection of PV modules have been of great interest within the past decade. A wide range of techniques are utilized to detect defects in PV modules and evaluate their effects. Electrical measurements are a fundamental approach for silicon cell characterization [2]. With the significant increase in the number and size of PV installations, regular PV system inspection has become a challenge [3]. Automated systems are needed because of the difficulty of manually monitoring and detecting errors in large numbers of panels in very large areas. Panel error checks are a process that requires expertise and time for each panel. Electroluminescence (EL) and photoluminescence (PL) imaging are widely used to study the radiative recombination mechanisms that occur within a solar cell and provide prediction of other non-radiative recombination occurrences [4]. EL imaging is one of the approaches employed for the fault detection in PV modules, offering imaging with higher resolution while identifying microcracks. Microcracks and other defects appear as dark grey lines and/or regions in EL images. Visual inspection of EL images is time consuming and costly. Examining the EL image requires appropriate experience and work. In addition, visual inspection is only possible in a small number of productions. Large-scale, automated detection methods are very important. Besides, the increasing production volumes of PV modules and the increasing interest of people in the world for PV have made automatic PV inspection even more significant and compulsory [2]. Photographic research under EL forward bias has proven to be a powerful diagnostic tool for investigating not only material properties but also visually processing deficiencies in silicon (Si) solar cells [5]. EL images often help people qualitatively detect problems such as broken cells and shunts. When examining these images, dark areas are defined as “bad” and bright areas as “good”. It is difficult to really know what is in cells and to quantify its effect on I-V properties [6]. Visual inspection of solar modules with EL imaging allows easy identification of damage on solar panels caused by environmental influences during the assembly process and previous material defects or material aging [7]. High resolution EL images captured in the infrared spectrum allow to visually and non-destructively examine the quality of PV modules. However, currently, such a visual inspection requires trained professionals to distinguish between different types of defects, which is time consuming and expensive. Therefore, automated segmentation of cells is an important step in automating the visual inspection workflow [7]. Cracks and breaks, undetectable to the human eye but visible on EL images, can be considered to be the common result of transport and misuse of solar panels [8]. The development of automatic feature detection in EL images of PV devices will lead to higher level of accuracy and speed for the cell and module characterization in the research, manufacturing, operation and maintenance sectors of the PV value chain [9]. The EL technique is usually applied indoors or outdoors only from dusk to dawn because the crystalline silicon luminescence signal is several times lower than the sunlight [10]. Various studies are carried out on the EL imaging camera. Akram et al. performed automatic detection of PV module defects in EL images [2]. dos Reis Benatto et al., in their study, focused on obtaining EL images quickly in daylight and presented a drone-based system that could acquire EL images at 120 frames per second [11]. In their study, Dhimish and Holmes presented the development of a new technique used to increase the detection of microcracks in solar cells [12]. In their study, Deitsch et al. proposed a robust automatic segmentation method for extracting individual solar cells from EL images of PV modules [7]. Lockridge et al., in their study, discussed the comparison of electroluminescent image capture methods and presented the result and advantages of superimposing an EL and an IR image [8]. Spataru et al. developed a method to detect microcracks in solar cells using two-dimensional matched filters, derived from the electroluminescence intensity profile of typical microcracks [13]. Guo et al., in their study, proposed a method to generate dark I-V curves for individual cells using EL images [6]. Mantel et al. proposed methods to automatically correct perspective distortion in EL images of PV panels [3]. Karimi et al. used statistical methods and machine learning algorithms to classify PVCell images in their study [9]. In their study, Planes et al. have addressed the need for imaging characterizations of EL and PL [4]. Fuyuki and Kitiyanan studied the photographic identification of crystalline silicon solar cells that use EL [5]. Natarajan et al., in their study, proposed an algorithm based on thermal image processing to extract the properties of operational PV cells [1]. Kaplani analysed the degradation effects observed in PV cells with severe EVA discoloration from long-running field-aged modules [14]. In their study, Bedrich et al. examined an image correction of a 4x9 cell module displayed based upon different perspective positions [15]. In the study of Bedrich et al., EL images and current-voltage (I–V) curves of nearly 2000 PV panels were analyzed. It was determined that the results of the flash test were in coherent with the performances estimated using QELA [16]. In their study, Lu et al. explores the thermal fault diagnosis of electrical equipment in substations based on image fusion [17]. Tang et al., in their study, presented a deep learning-based defect detection of PV modules using electroluminescence images [18]. Li et al. reviewed, a systematic study on the application of ANN and hybridized ANN models for PV fault detection [19]. Li et al. investigated the characteristics of PV panel semantic-segmentation from the computer vision point of view [20]. Parikh et al. used machine learning algorithms to classify detected defects by extracting statistical parameters from the histogram of these images, and approximately 46,000 EL cell images are extracted from photovoltaic modules with different defects [21]. Pierdicca et al. proposed solAIr, an artificial intelligence system based on deep learning for anomaly cells detection in photovoltaic images obtained from unmanned aerial vehicles equipped with a thermal infrared sensor [22].
We can categorize the work done differently with respect to the type of image and the defect detection methods used. If we examine it in terms of image types; [3-8, 11, 13, 16, 17, 18, 21] studies detected errors from EL images. [1, 8, 9, 14, 15, 20, 22] studies used thermal and RGB images. In addition to being more difficult and costly to obtain EL images, it provides more effective results for detecting errors. However, since thermal and RGB images can be taken from the system installed in the field, they can be processed faster. Taking into account the employed methods; [1, 4, 5, 7, 11, 13, 15, 20, 21] studies used image processing methods, while [18-20, 22] studies tried to detect faulty panels via artificial intelligence algorithms. In image processing algorithms, the preprocessing is done by the programmer, while deep learning algorithms try to detect errors on the raw image. Artificial intelligence algorithms are more difficult in comparison with the image processing methods to explain the results obtained. Successful results were obtained in both applications.
It has been seen that defect detection in PV panels is an area that has been studied extensively in recent years. As seen in previous studies, it was seen that statistical methods from EL images and automatic decision-making techniques were used in the status determination of PV panels. Statistical models act according to predefined fixed assumptions between dependent and independent variables and do not yield consistent results if these assumptions are violated. In this study, PV panels are divided into cells. By evaluating each cell, power loss value and performance efficiency were evaluated for the whole panel. Additionally, in this study, the effect of the deterioration in the PV panel for the energy efficiency was calculated in proportion to the deterioration. Since the deteriorations are evaluated on the basis of wafers, it can be decided whether the panels can be reused in the production.
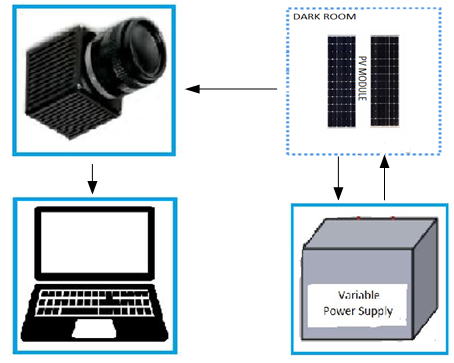
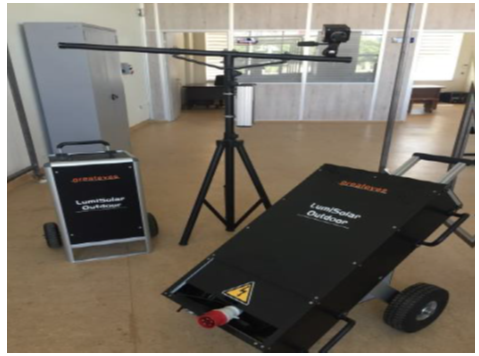
In our study, images of 10 (10x6) PV panels brought from the field after being utilized for a long time were used. The images were recorded in the Photovoltaic and Power Electronics Laboratory within the GAPYENEV Center of Harran University, with a Greateyes Lumisolar Outdoor Line-Powered brand EL which can take pictures in 2048x2048 pixels in 2 seconds (Figure 1b). In Figure 1a, there is the connection diagram of the system used for EL image acquisition. The PV panel is energized with the Variable Power Supply in the dark room, and the image of the panel is taken with the Electroluminescence camera and recorded on the assigned computer. High temperature occurs in faulty areas on the panel that is energized by Variable Power Supply. This situation is visualized by the EL camera. With the EL camera, problems such as the structure of the panels, whether there exist any cracks in the panels, the effects of transportation during the EPC installation, or the strain of the panels can be detected. Since PV panels were evaluated separately as whole and cell, 60 cells on each panel and 600 cells in total were processed. Success parameters were calculated on a computer with a 2.8 GHz Intel Core i7 processor and 8 GB RAM.
(a)
(b)
Figure 1. (a) EL imaging setup and dataset generation design (b) EL camera used in the study
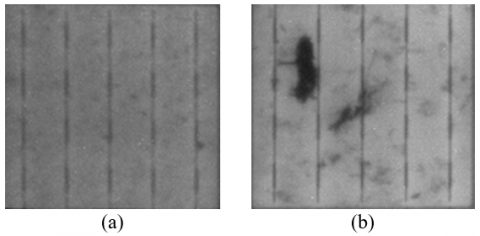
With the recorded image, the data set was created by taking into account the defects such as disproportionate panel efficiency losses, panel fractures, and micro-cracks, intercellular connection errors, and various damages in the PV panel, and it was estimated that the PV panel was intact, moderately defected or completely defected. The losses in the PV panels used in the study and examples of the intact cells are given in Figure 2.
Figure 2. Examples of intact cells (a) and defected cells (b) used in the study
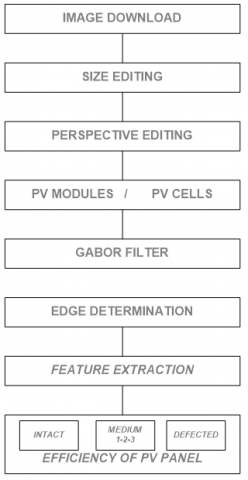
The images of the PV panels were captured using the EL camera. The captured images were converted into a format to be processed on the computer. The flow chart of all these processes is presented in Figure 3.
Initially EL images of the PV panels captured were loaded into the MATLAB program. Then, noise and image adjustments of the captured images were made and greyscale images to be used in the study were obtained. After that, 60 cells were obtained by dividing each PV panel and the Gabor filtering method was applied to each cell separately and to all panels. With Gabor filtering, the cracks and distortions in the panel wafers will be emphasized and the parts that do not change will be suppressed. In this way, it will be possible to detect the errors in the image more accurately. The distortions caused by cracks or errors were obtained by applying OTSU algorithms to the images obtained as a result of Gabor. These distortions were evaluated as edge information. Finally, the edges were determined by the canny method, and an evaluation was made about whether the wafers and panels were intact or damaged.
Figure 3. Flow chart of work
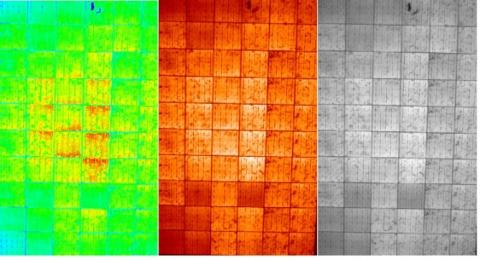
The determination of the intact or defects of PV panels from the data recorded in the Photovoltaic and Power Electronics laboratory within the GAPYENEV Center of Harran University was estimated using the image processing technique. One of the first and most important stages of image processing is noise removal and image editing. That’s why, clipping and thresholding methods are applied in noise removal. 10 PV panels, each consisting of 60 cells, imaged with an EL camera, were handled in 2 original different color bands and evaluated grayscale image bands. The images of the records are presented in Figure 4.
Figure 4. Original 3 color bands of EL images belonging PV panel
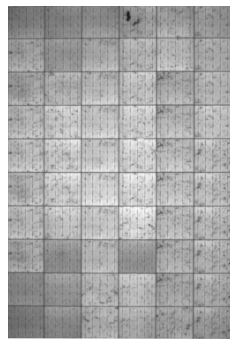
The threshold value of the EL camera images of the PV panel was determined by the OTSU threshold algorithm, and the panel part on the image was separated from the rest of the image. OTSU algorithm calculated an adaptive threshold value according to the brightness values in the image. Therefore, different threshold values are used for each image. Then, it was edited using perspective correction methods and processing was continued on grayscale images. The images of the corrected PV panels are given in Figure 5.
Figure 5. Perspective corrected PV panel
In the following step, the horizontal and vertical features of each cell were determined from the corrected PV panel image, and 60 separate cells were extracted. By using the Gabor method, the orientation values for the cells were taken into consideration as 30°, 60°, 90°, 120°, and 150°, while values of 0° and 180° were not so that the vertical lines would not be visible. In addition, wavelength values of 2, 3 and 4 were applied. When the whole PV panel was processed, the orientation values were taken as 30°, 60°, 120° and 150°; 0° and 180° were not included so that vertical lines would not be visible, and 90° was not included so that horizontal lines were not visible. As with cells, wavelength values were taken as 2, 3 and 4. The extraction of the properties of PV panels and cells was done utilizing the Gabor method. Patterns with desired properties can be found by adjusting the Gabor core to the desired angle and wavelength. When the Gabor filter is applied to an image, the point in the image with the same frequency and direction as the filter is the strongest point. With this process, fractures and cracks in the angles and wavelengths determined in the image will be emphasized and the parts that do not comply with this structure will be suppressed. Especially unused 0°, 180°, and 90° angles were not used because they were found in intact cells. The general expression of the Gabor filter is shown in Eqns. (1)-(3).
$g(x, y ; \lambda, \theta, \sigma)=\exp \left(-\frac{x^{\prime 2}+y^{\prime 2}}{\sigma^2}\right) \cos \left(2 \pi \frac{x^{\prime}}{\lambda}\right)$ (1)
$x^{\prime}=x \cdot \cos \theta+y \cdot \sin \theta$ (2)
$y^{\prime}=-x \cdot \sin \theta+y \cos \theta$ (3)
The g given in the equation represents the Gabor core and this core power is controlled by the parameter. The $\theta$ used in the equations represents the angle of the look-up value, $\lambda$ the wavelength of the look-up pattern and $\sigma$ the standard deviation [23].
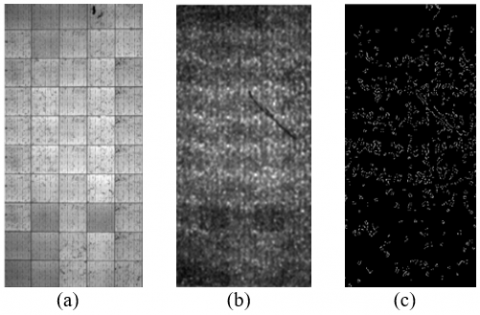
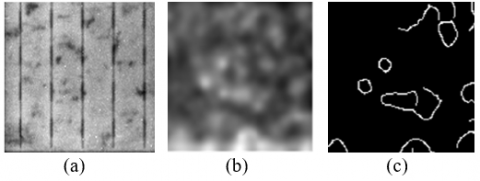
In Figure 6, images of an example PV panel used in the study are given. The original image of the PV panel, an image created according to a different wavelength and orientation values with Gabor filter, and the images of the PV panel with edges subtracted are given in Figure 6a, 6b, and 6c, respectively.
Figure 6. (a) Original image of the PV panel, (b) Gabor image of the PV panel and (c) edge image of the PV panel
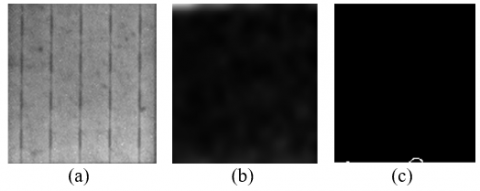
In addition, when each wafer is evaluated separately, the original image of an intact wafer, the combined image of the intact wafer with Gabor filter, and the images of the intact wafer with edges subtracted are given in Figure 7a, 7b, and 7c, respectively.
Figure 7. (a) Original image of a normal cell of the PV panel, (b) combined image of a normal cell of the PV panel with Gabor applied, (c) edge image of a normal cell of the PV panel
The same applications made for the intact wafer in Figure 7 are made for the defected wafers. The original image of a defective wafer is given in Figure 8a. In Figure 8b, the combined image of the defected wafer with Gabor applied, and the images of the defected wafer with edges subtracted are given in Figure 8c.
Figure 8. (a) Original image of a defected cell of the PV panel, (b) combined image of a defected cell of the PV panel with Gabor applied, (c) edge image of a defected cell of the PV panel
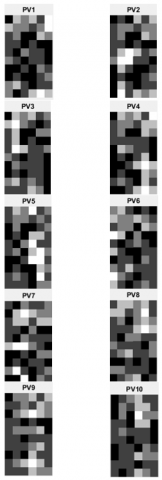
After the edge detection of the images, 1.5 was chosen as the most appropriate parameter value because when a value smaller than this value was selected, very thin lines to be neglected would appear, or when a higher value was given, some lines that might be meaningful for the evaluation would be missed. This value was determined based on the control groups (laboratory measurement results are known). When the separated cells were evaluated, a threshold value was determined for the normal cell, moderately defected cells were grouped at certain intervals, and above a certain value, it was considered as completely defected. The cells were evaluated in 5 categories normal, medium 1, medium 2, medium 3 and defected. Since 10 defective PV panels were used in the study, a total of 600 cells were studied and 180 of them were determined as normal, 200 as medium 1, 120 as medium 2, 70 as medium 3 and 30 as defected. The calculated number of fractures in the image was used to determine the state of the wafers of PV panels. The wafers are marked as intact and 4 different degrees of damage. While doing this grouping, if the threshold values obtained were below the value of 0.01, it was accepted as normal; and by adding 0.005 above this value, damage grouping was made. This value was determined based on the control groups and expert comments. Since conductivity is one of the factors that are effective in deciding whether the PV panels are normal or defective, an evaluation was made of the PV panel based on the condition of the cells. As mentioned above, since 10 PV panels used in the study were defective, the failure conditions were determined by various methods used and also compared in terms of efficiency. Since the cells on the 10x6 PV panel are connected in series with long sides attached, the failure of one of the cells affects the conductivity between the series of connected cells, thus making all the cells in that row ineffective. Thus, it is possible to comment on the efficiency of the PV panel depending on the defective cell in the serial connection on the panel. The results of normal and defected cells of 10 PV panels formed according to the determined threshold value are presented in Figure 9.
Since PV panels consist of 10x6 cells, 10 of these cells are connected in series with each other and consist of 6 series in total. The relation of PV is given in Eq. (4).
$P V=S W 1+S W 2+S W 3+S W 4+S W 5+S W 6$ (4)
The symbol indicated as SW in the equation represents cells connected in series. According to the error conditions in the series, it was possible to evaluate the efficiency of the panels. The relation used for yield is given in Eq. (5).
$\eta=1-\frac{\sum D_{S W}}{6}$ (5)
Figure 9. Intact cell and defected cell results of PV panels
In the symbols used in the equation, Ƞ denotes the efficiency of the panel and DSW denotes the number of defected serial cells.
Comparisons of the evaluated PV panels were made with reference to laboratory results. These results were obtained by taking I-V measurements of the PV panel. Additionally, all these measurements were achieved at an irradiance of at least 700 w/m2. The measured PM (W) value was standardized to 1,000 w/m2 irradiation and 25℃ temperature environment and converted to the new standard PS (W) value and used. Efficiency and loss rates were calculated by comparing this value with the power values (PL (W)) on the labels of the PV panels. The efficiency obtained as a result of the measurement is given in Eq. (6).
$\eta m=100 * \frac{P_S}{P_L}$ (6)
In the symbols used in the equation, Ƞm is the measured efficiency of the panel, PS is the standardized power value as a result of the measurement, and PL d represents the label power value of the PV panel.
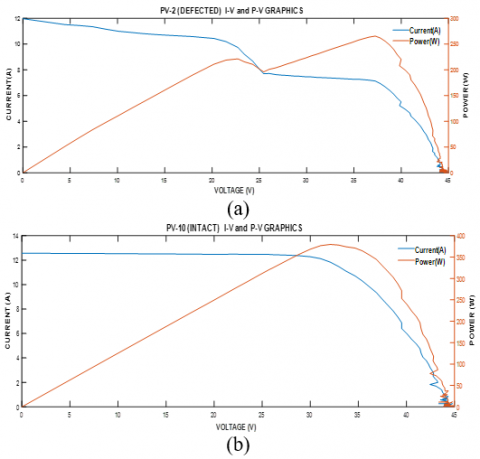
The I-V and P-V graphs created as a result of the measurement clearly show the loss situations. In Figure 10, as an example, I-V and P-V graphs of PV-10 with low loss rate and PV-2 with high loss rate from PV panels used in the study are shown.
Figure 10a shows I-V and P-V graphs of PV-2. The panels used are known to have a power of 390W. As can be seen, approximately 260W of power was obtained depending on the current and voltage values. In already carried out calculations, it has been revealed that there should be a power loss of at least 35%. In Figure 10b, there are the I-V and P-V graphs of PV-10a, which is an intact panel. In the calculations made for this panel, it has been determined that there may be a maximum power loss of 16%. According to the graph, it is seen that approximately 360W of power is obtained from this panel.
The conditions of the cells are important for fault detection, but for efficiency, the number of defected arrays is more important than the number of defected cells detected because even if more than 1 cell defects in a series of connected cells, it affects the efficiency of the PV panel at the same rate since it affects the same array. In Table 1, PL (W) value, PS (W) value, and efficiencies obtained as a result of the measurement of PV panels are given. In addition, the yields of defected cells, defected arrays, and panels of 10 PV panels obtained in the study are presented.
There are 3 defected cells in the first of 10 PV panels used in the study, and since 2 of them are in the same array and the other is in a separate one, the efficiency of the panel is 0.66. The second PV panel has 4 defective cells, and since 2 of them are in the same array and the other 2 are in the same array, the efficiency of this panel is 0.66. There are 2 defected cells in PV3, and since both of them are in separate arrays, the efficiency of the panel is 0.66. There are 3 defected cells in PV4, and since 2 of them are in the same array and the other is in a separate array, the efficiency of the panel is 0.66. There are 6 defected cells in the PV5, and since 3 of them are in the same array and the other three are in the same array, the efficiency of the panel is 0.66. There are 2 defected cells in PV6 and since they are both in the same array, the efficiency of the panel is 0.83. There are 5 defected cells in PV7 and since 2 of them are in the same array and the remaining three are in the same array, the efficiency of the panel is 0.66. There are 2 defected cells in PV8 and since they are both in the same array, the efficiency of the panel is 0.83. There are 2 defective cells in PV9 and since both of them are in the same array, the efficiency of the panel is 0.83. There is 1 defected cell in PV10 and since only one array is affected, the efficiency of the panel is 0.83. As shown in the table, when the study results and laboratory results were compared for 10 different panels that were tested, the highest error was 0.059, the lowest error was 0.004, and the average error was 0.0213. When the laboratory measurement results were compared with the study, it was observed that the yield results were compatible.
Figure 10. (a) I-V and P-V graphics of the less efficient PV-2 (Defected) panel (b) I-V and P-V graphics of the higher efficiency PV-10 (Intact) panel
Table 1. Defected and efficiency results of PV panel
|
Panel Name |
Defected Cell Number |
Defected Serial Number |
PV Panel Efficiency (Ƞ) |
PL(w) |
PS(W) |
Measured PV Panel Efficiency (Ƞm) |
Error Rate I (Ƞ- Ƞm) I |
|
PV1 |
3 |
2 |
0.666 |
395 |
266.3 |
0.674 |
0.008 |
|
PV2 |
4 |
2 |
0.666 |
395 |
239.7 |
0.607 |
0.059 |
|
PV3 |
2 |
2 |
0.666 |
395 |
260.3 |
0.659 |
0.007 |
|
PV 4 |
3 |
2 |
0.666 |
395 |
255.6 |
0.647 |
0.019 |
|
PV5 |
6 |
2 |
0.666 |
395 |
245.8 |
0.622 |
0.044 |
|
PV6 |
2 |
1 |
0.833 |
395 |
325.4 |
0.824 |
0.009 |
|
PV7 |
5 |
2 |
0.666 |
395 |
247.2 |
0.626 |
0.040 |
|
PV8 |
2 |
1 |
0.833 |
395 |
327.8 |
0.829 |
0.004 |
|
PV 9 |
2 |
1 |
0.833 |
395 |
330.5 |
0.837 |
0.004 |
|
PV10 |
1 |
1 |
0.833 |
395 |
336.7 |
0.852 |
0.019 |
|
Mean |
|
|
|
|
|
|
0.0213 |
Table 2. Comparison of the results with other work
|
Authors |
Methods Used |
Success results |
|
Natarajan et al. |
Machine learning methods (SVM), Thermal Images of PV Panels |
97% |
|
Deitsch et al. |
Fully automatic segmentation method |
97.54% |
|
Spataru et al. |
The micro-crack detection |
Over 90% |
|
Bedrich et al. |
Flash-test-measured and performance estimated using QELA |
97-99% |
|
Akram et al. |
Convolutional neural network |
93.02% |
|
Karimi et al. |
SVM and CNN |
99% |
|
Proposed Method |
Gabor Filter Bank |
99.99% |
The methods used in computer-aided decision-making studies related to PV panels and the successful performances obtained are given in Table 2.
When this study is compared with previous ones, training and test datasets are needed in studies using machine learning or deep learning algorithms. However, we have shown that results can be given on a single panel without the need for training. While predictions are made about the defected or intact panels in general, we studied that the panel efficiency value is calculated as well as the determination of the defected or intact of the panel. As a result, a 100% success rate was obtained by correctly predicting all faulty PV panels and PV cells in computer-aided decision-making related to PV panels. A 99.99% success rate has been achieved in estimating the efficiency of PV panels.
In this study, the normal or damaged status of PV panels from EL camera images with image processing methods, and the energy efficiency of the PV panel was determined. At the outset, the PV panel was divided into cells and the states of the cells were examined, and then the PV panel was evaluated as a whole and comments were made about its being normal or defective and its efficiency. Failure of one of the cells affects the conductivity between the cells connected in series, thus rendering all cells in a row ineffective. In addition, as is often seen on labels of PV panels, the efficiency of a panel is 85% and above. The effect of cracks on energy loss was also determined more sensitively by making a wafer-based evaluation. The calculated energy loss was in agreement with the I-V measurements. If the panel is to be used individually, even if some of these cells are defective, it can be used; or if the PV panel is to be used in a compact system, even if only one cell is broken, due to the incompatibility of electrical values, it will be effective in deciding that, the PV panel will be unusable. As a result, intact wafers and defective wafers were predicted with a 100% success rate, and the efficiency of the panel was predicted correctly with a 99% success rate. In summary, performance loss was determined by detecting micro-cracks in the panels. As for future work, a number of research directions are considered worth further research and development efforts. For example, studies on finger interruption, ribbon shift, and dark zone detection will be conducted to investigate the effect on panel performance.
I would like to thank the GAPYENEV team for helping us to obtain the dataset.
[1] Natarajan, K., Bala, P.K., Sampath, V. (2020). Fault detection of solar PV system using SVM and thermal image processing. International Journal of Renewable Energy Research (IJRER), 10(2): 967-977. https://doi.org/10.20508/ijrer.v10i2.10775.g7963
[2] Akram, M.W., Li, G., Jin, Y., et al. (2019). CNN based automatic detection of photovoltaic cell defects in electroluminescence images. Energy, 189: 116319. https://doi.org/10.1016/j.energy.2019.116319
[3] Mantel, C., Spataru, S., Parikh, H., et al. (2018). Correcting for perspective distortion in electroluminescence images of photovoltaic panels. In 2018 IEEE 7th World Conference on Photovoltaic Energy Conversion (WCPEC) (A Joint Conference of 45th IEEE PVSC, 28th PVSEC & 34th EU PVSEC, pp. 0433-0437. https://doi.org/10.1109/PVSC.2018.8547724
[4] Planes, E., Spalla, M., Juillard, S., Perrin, L., Flandin, L. (2019). Absolute quantification of photo-/electroluminescence imaging for solar cells: definition and application to organic and perovskite devices. ACS Applied Electronic Materials, 1(12): 2489-2501. https://doi.org/10.1021/acsaelm.9b00450
[5] Fuyuki, T., Kitiyanan, A. (2009). Photographic diagnosis of crystalline silicon solar cells utilizing electroluminescence. Applied Physics A, 96(1): 189-196. https://doi.org/10.1007/s00339-008-4986-0
[6] Guo, S., Schneller, E., Davis, K.O., Schoenfeld, W.V. (2016). Quantitative analysis of crystalline silicon wafer PV modules by electroluminescence imaging. In 2016 IEEE 43rd Photovoltaic Specialists Conference (PVSC), pp. 3688-3692. https://doi.org/10.1109/PVSC.2016.7750365
[7] Deitsch, S., Buerhop-Lutz, C., Sovetkin, E., Steland, A., Maier, A., Gallwitz, F., Riess, C. (2018). Segmentation of photovoltaic module cells in electroluminescence images. arXiv 2018. arXiv preprint arXiv:1806.06530.
[8] Lockridge, B.P., Lavrova, O., Hobbs, W.B. (2016). Comparison of electroluminescence image capture methods. In 2016 IEEE 43rd Photovoltaic Specialists Conference (PVSC), pp. 0876-0879. https://doi.org/10.1109/PVSC.2016.7749734
[9] Karimi, A.M., Fada, J.S., Hossain, M.A., Yang, S., Peshek, T.J., Braid, J.L., French, R.H. (2019). Automated pipeline for photovoltaic module electroluminescence image processing and degradation feature classification. IEEE Journal of Photovoltaics, 9(5): 1324-1335. https://doi.org/10.1109/JPHOTOV.2019.2920732
[10] dos Reis Benatto, G. A., Mantel, C., Spataru, S., et al. (2020). Drone-based daylight electroluminescence imaging of PV modules. IEEE Journal of Photovoltaics, 10(3): 872-877. https://doi.org/10.1109/JPHOTOV.2020.2978068
[11] dos Reis Benatto, G.A., Mantel, C., Lancia, A.A.S., et al. (2018). Image processing for daylight electroluminescence PV imaging acquired in movement. In Proceedings of the 35th European Photovoltaic Solar Energy Conference and Exhibition: EU PVSEC 2018, pp. 2005-2009.
[12] Dhimish, M., Holmes, V. (2019). Solar cells micro crack detection technique using state-of-the-art electroluminescence imaging. Journal of Science: Advanced Materials and Devices, 4(4): 499-508. https://doi.org/10.1016/j.jsamd.2019.10.004
[13] Spataru, S., Hacke, P., Sera, D. (2016). Automatic detection and evaluation of solar cell micro-cracks in electroluminescence images using matched filters. In 2016 IEEE 43rd Photovoltaic Specialists Conference (PVSC), pp. 1602-1607. https://doi.org/10.1109/PVSC.2016.7749891
[14] Kaplani, E. (2012). Detection of degradation effects in field-aged c-Si solar cells through IR thermography and digital image processing. International Journal of Photoenergy. https://doi.org/10.1155/2012/396792
[15] Bedrich, K.G., Bliss, M., Betts, T.R., Gottschalg, R. (2016). Electroluminescence imaging of PV devices: Camera calibration and image correction. In 2016 IEEE 43rd Photovoltaic Specialists Conference (PVSC), pp. 1532-1537. https://doi.org/10.1109/PVSC.2016.7749875
[16] Bedrich, K.G., Luo, W., Pravettoni, M., et al. (2018). Quantitative electroluminescence imaging analysis for performance estimation of PID-influenced PV modules. IEEE Journal of Photovoltaics, 8(5): 1281-1288. https://doi.org/10.1109/JPHOTOV.2018.2846665
[17] Lu, M.S., Liu, H.Y., Yuan, X.P. (2021). Thermal fault diagnosis of electrical equipment in substations based on image fusion. Traitement du Signal, 38(4): 1095-1102. https://doi.org/10.18280/ts.380420
[18] Tang, W., Yang, Q., Xiong, K., Yan, W. (2020). Deep learning based automatic defect identification of photovoltaic module using electroluminescence images. Solar Energy, 201: 453-460. https://doi.org/10.1016/j.solener.2020.03.049
[19] Li, B., Delpha, C., Diallo, D., Migan-Dubois, A. (2021). Application of Artificial Neural Networks to photovoltaic fault detection and diagnosis: A review. Renewable and Sustainable Energy Reviews, 138: 110512. https://doi.org/10.1016/j.rser.2020.110512
[20] Li, P., Zhang, H., Guo, Z., et al. (2021). Understanding rooftop PV panel semantic segmentation of satellite and aerial images for better using machine learning. Advances in Applied Energy, 4: 100057. https://doi.org/10.1016/j.adapen.2021.100057
[21] Parikh, H.R., Buratti, Y., Spataru, S., et al. (2020). Solar cell cracks and finger failure detection using statistical parameters of electroluminescence images and machine learning. Applied Sciences, 10(24): 8834. https://doi.org/10.3390/app10248834
[22] Pierdicca, R., Paolanti, M., Felicetti, A., Piccinini, F., Zingaretti, P. (2020). Automatic faults detection of photovoltaic farms: solAIr, a deep learning-based system for thermal images. Energies, 13(24): 6496. https://doi.org/10.3390/en13246496
[23] Balcılar, M., Sönmez, A.C. (2008). Geometrik Düzeltme ve Gabor Filtreleriyle Araç Plaka Tespiti Localization of Licence Plate using Geometric Correction and Gabor Filter. ELECO. Bursa, Ekim.