Fatih M. Senalp* | Murat Ceylan
© 2021 IIETA. This article is published by IIETA and is licensed under the CC BY 4.0 license (http://creativecommons.org/licenses/by/4.0/).
OPEN ACCESS
The thermal camera systems can be used in all kinds of applications that require the detection of heat change, but thermal imaging systems are highly costly systems. In recent years, developments in the field of deep learning have increased the success by obtaining quality results compared to traditional methods. In this paper, thermal images of neonates (healthy - unhealthy) obtained from a high-resolution thermal camera were used and these images were evaluated as high resolution (ground truth) images. Later, these thermal images were downscaled at 1/2, 1/4, 1/8 ratios, and three different datasets consisting of low-resolution images in different sizes were obtained. In this way, super-resolution applications have been carried out on the deep network model developed based on generative adversarial networks (GAN) by using three different datasets. The successful performance of the results was evaluated with PSNR (peak signal to noise ratio) and SSIM (structural similarity index measure). In addition, healthy - unhealthy classification application was carried out by means of a classifier network developed based on convolutional neural networks (CNN) to evaluate the super-resolution images obtained using different datasets. The obtained results show the importance of combining medical thermal imaging with super-resolution methods.
classification, datasets, deep learning, super-resolution, thermal imaging
Thermal cameras are imaging systems that are based invisible infrared energy and provides the general structure of the image as colors and shapes formed according to this infrared energy. Thermal systems have an important position as a non-invasive and harmless method for applications to be performed on living beings such as humans and animals, as they can provide non-contact temperature measurement. Thermal imaging devices can be used as an important problem diagnosis tool in some areas that require the detection of thermal variations, especially in military and civilian areas [1]. Despite the widespread use, low-cost thermal imaging systems create blurry images with insufficient edge detail information. In this case, the resolution of thermal images used for various problems such as disease diagnosis in medical fields can greatly affect the success. For such reasons, the interest in studies to improve the resolution of thermal images has increased in recent years. In addition, the effective use of super-resolution techniques on thermal images can be an alternative to thermal camera systems, which are costly [2].
The term super-resolution is a technique for obtaining an image with a higher resolution than the obtained low-resolution images. This super-resolution image can also be expressed as an estimate from the low resolution (LR) equivalent of a high resolution (ground truth) image [3]. High-resolution images can be obtained from low-resolution images by using methods such as the nearest to the neighbor relationships of the pixels in the field of the super-resolution, as well as bicubic interpolation [4]. The nearest neighbor interpolation takes into account a single-pixel nearest to the interpolation point. In bilinear interpolation, the closest 2x2 (4 pixels) neighbors to the unknown pixel are taken into account. While considering the closest known 4x4 (16 pixels) neighbors to the unknown pixel in the bicubic interpolation method, which gives the most successful results among the three methods mentioned, higher weight is given to the neighbors closer to the unknown pixel. One of the most important factors determining the sharpness of the high-resolution image obtained is that the image contains sharp transitions. Mosaicization occurs in the images obtained as a result of the nearest neighbor interpolation. Blurred images occur when bilinear interpolation is applied. It is more common to use the bicubic interpolation method in order to minimize such situations [5].
In recent years, developments in the field of deep learning due to hardware advances have positively affected the applications of super-resolution. The successful results obtained have spread the use of deep learning methods in the field of super-resolution [6]. Super-resolution methods have many application areas such as face detection and face recognition [7], object recognition [8], astronomy [9], remote sensing [10], hyperspectral image improvement [11], compressed image or video quality improvement [12], iris and eye recognition [13], sign or license plate recognition [14], fingerprint recognition [15]. In addition, many applications related to super-resolution have been introduced in the field of medical imaging in recent years [16].
For deep learning-based super-resolution applications, GAN-based developed TSRGAN (Thermal Super Resolution GAN) model was used. Then, the high-resolution images (ground truth) set and the dataset containing high-low resolution image pairs consisting of low-resolution images obtained by downscaling of these images are used. In this study, firstly, thermal images of unhealthy and healthy babies were resized by scaling at 1/2, 1/4, 1/8 ratios, and 3 different datasets of low-resolution images were obtained. In this way, 3 different datasets were prepared to consist of low and high-resolution images. The results of super-resolution applications performed on these 3 different datasets were evaluated using image quality metrics PSNR (peak signal to noise ratio) and SSIM (structural similarity index measure) [17]. In addition, a deep learning-based classifier model was developed and the success of making an unhealthy-healthy distinction between low-resolution and super-resolution images belonging to applications performed with 3 different datasets was compared. So, task-based evaluation of super-resolution images obtained using different datasets was carried out.
In this section, detailed information on two different studies performed with thermal baby images is given. Section 2.1 provides information on how the different datasets used in applications are obtained and made available for applications. Section 2.2 gives detailed information about the deep network model created and the training process of this network.
2.1 Data collection
In the study carried out, high resolution (ground truth) thermal images of 250 premature (healthy) and 250 unhealthy babies of neonatal obtained by using Variocam HD thermal camera with a thermal resolution of 640x480 were used. The thermal sensitivity of the thermal camera used is 0.05℃. In addition, the thermal camera was placed 60-100 cm from the neonatal in the supine position [18, 19]. The images obtained with the thermal camera were transferred to the computer environment and these thermal images have an image size of640x480. Examples of high-resolution thermal images of healthy and unhealthy babies are shown in Figure 1. Then, high-resolution thermal images were downscale at 1/2, 1/4, 1/8 ratios in Matlab environment, and low-resolution images with 320x240, 160x120, 80x60 image sizes were obtained respectively [17]. Thus, 3 different datasets consisting of 500 high resolution and 500 low-resolution image pairs were obtained.
Among the thermal images of the dataset obtained, samples from low resolution (LR) images resized at the ratios of 1/8, 1/4, 1/2, and high resolution (ground truth) images corresponding to these sample images are shown in Figure 2, in order from left to right. Here, it is seen that as the reduction degree of the image size is increased, the deterioration in image quality due to data loss also increases.
Figure 1. Topline belongs to healthy babies, bottom line belongs to unhealthy babies
Figure 2. Sample images in order from left to right (1/8, 1/4, 1/2, ground truth)
2.2 Deep learning architecture and training process
In this section, the deep network model TSRGAN (Thermal Super Resolution GAN) developed for the applications is explained in detail. The architecture of this deep network model, which is developed based on GAN (generative adversarial networks), consists of generator networks and discriminator networks [20]. Here, convolution and batch normalization layers are used in both network parts. In addition, sub-pixel convolution layers are used in the generator network. The generator network creates super-resolution thermal images by upscaling low-resolution thermal images at x2, x4, and x8 ratios. The number of sub-pixel convolution layer changes according to the up-scaling ratio to be realized. The discriminator calculates the GAN loss of the deep network model by determining the difference between the super-resolution image and the high-resolution image. In addition, the training process of the deep network was carried out using the backpropagation method. The architecture of the developed deep network is shown in Figure 3.
Figure 3. TSRGAN architecture
Perceptual loss obtained by collecting the content and adversarial losses was used to increase the visual quality in the thermal images created by the deep network. The purpose of using perceptual loss is to minimize the visual quality difference between super-resolution thermal images and high resolution (ground truth) thermal images [21]. Deep network loss (GAN loss) is calculated by summing MSE, content, and adversarial losses. The GAN loss calculation formula is given in Eq. (2).
The MSE (mean squared error) value is always positive and is taken into account in order to evaluate the performance of the deep network models. The network model is successful as long as the MSE value approaches zero [22]. The formula for the MSE value is given in Eq. (1). Here n represents the size of the dataset, and ej represents the error value between the actual value and predicted value.
$M S E=\frac{1}{\mathrm{n}} \sum_{\mathrm{j}=1}^{\mathrm{n}} \mathrm{e}_{\mathrm{j}}^{2}$ (1)
Content loss is created from the combination of VGG loss and MSE loss value and is calculated using a pre-trained 19-layer network (VGG19). Here, VGG loss is used to ensure that the improvement in visual quality can be perceived by people, while MSE loss is used to observe the visual improvement in PSNR and SSIM values [23].
Adversarial loss is based on the probabilities of the discriminator network on all training instances. The main purpose here is to achieve improvements in thermal image quality by reducing structural differences [24]. In other words, it is aimed to improve visual quality in thermal images instead of focusing only on the increase in PSNR and SSIM values.
$1_{\text {total }(\text { gan })}=1_{\text {content }}\left(1_{\mathrm{mse}}+1_{\mathrm{vgg}}\right)+1_{\text {adversarial }}$ (2)
The proposed deep network architecture consists of convolution layers, sub-pixel layers, batch normalization layers, and activation layers. While using the swish activation function to realize negative learning in the generator network part, a significant decrease in the training rate was prevented by using the ReLU activation function. In this way, both fast and efficient applications can be carried out with a dataset that is not very large. In addition to this, by applying the skip connection technique similar to residual networks (ResNet), both the training speed and the success of the deep network have been tried to be increased [25]. In the discriminator network part, the LeakyReLU activation function has been preferred to ensure that negative learning takes place more stably. In addition, using batch normalization layers in both generator and discriminator networks is aimed to prevent the vanishing gradient problem and to add non-linearity to the deep network model [26].
The proposed deep network model has been used in the applications detailed in Section 3. In all applications implemented, learning rate 0.0005 was preferred as the hyperparameters of the network model, and the Adam algorithm was used as the optimization method. Also, a training process in small patches was carried out in order to keep the training speed of the network high and to improve its successful performance. While the patch sizes are (16, 16, 3) at the input of the generator network in all applications, (32, 32, 3), (64, 64, 3), (128, 128, 3) sized patches are delivered to the input of the discriminator network for the x2, x4, x8 super-resolution applications, respectively. In all applications performed, the deep network model was trained for 20,000 epochs. The training process of the deep network was completed through the workstation with CPU E5-2680 processor and 32 Gb GeForce GTX 1080 Ti graphics card. For each of the applications detailed in Section 3.1, the training time of the network lasted around 110 hours on average. The evaluation of the successful performance of all the studies was carried out using the image quality metrics PSNR (peak signal to noise ratio) and SSIM (structural similarity index measure) values. In the evaluation phase, high resolution (ground truth) images were determined as reference images, and low resolution, bicubic interpolation, and super-resolution images were compared with each other [27].
The PSNR value provides information about the amount of noise in an image. The higher the PSNR value of an image, the lower the noise, indicating that the image is of high quality. The PSNR value is obtained by comparing the input image determined as a reference and the output image and calculating the noise ratio. In Eq. (3), the PSNR calculation formula is given. Here I represent the reference input image and I0 represents the output image [28].
$P S N R=20 x \log _{10}\left(255 \sqrt{\operatorname{MSE}\left(I, I_{0}\right)}\right)$ (3)
SSIM metric is an image quality metric that takes into account structural changes in the image by comparing the frames of different images. In other words, it shows the distortion in the frames of two different images. The higher the SSIM value, the higher the structural similarity. Eq. (4) shows the formula for the SSIM value. In Eq. (4), $\mu \mathrm{I}_{\mathrm{R}}(n), \mu \mathrm{I}_{\mathrm{D}}(n)$ markers reference $\left(\mathrm{I}_{\mathrm{R}}\right)$, and distorted ( $\left.\mathrm{I}_{\mathrm{D}}\right)$ image sequence $\mathrm{n}$. means the average of the frame, and $\sigma \mathrm{I}_{\mathrm{R}}(n)$ and $\sigma \mathrm{I}_{\mathrm{D}}(n)$ are the references $\left(\mathrm{I}_{\mathrm{R}}\right)$ and the distorted $\left(\mathrm{I}_{\mathrm{D}}\right)$ image sequence $\mathrm{n}$. is the standard deviation of the frame. $\mathrm{C} 1$ and $\mathrm{C} 2$ are constants used to get rid of any instability in the structural similarity comparison [28].
$\operatorname{SSIM}=\frac{\left[2 \mu I_{R}(n) \mu I_{D}(n)+C 1\right]\left[2 \sigma I_{R} I_{D}(n)+C 2\right]}{\left[\mu I_{R}{ }^{2}(n)+\mu I_{D}{ }^{2}(n)+C 1\right]\left[\sigma I_{R}{ }^{2}(n)+\sigma I_{D}{ }^{2}(n)+C 2\right]}$ (4)
This section provides detailed information about the use of datasets prepared for the applications and the training process of the deep network model. In Section 3.1, details about super-resolution applications performed with thermal images of neonatal and the obtained results are presented. In Section 3.2, a classification implementation has been carried out for task-based evaluation of super-resolution applications. The general pipeline for the proposed approach is shown in Figure 4.
Figure 4. General pipeline for the proposed approach
3.1 Super-resolution implementation for neonatal thermal images
In this study, the dataset previously described in detail in Section 2.1 was used. In this dataset, there are 500 high-resolution thermal images and 500 low-resolution thermal images in three different sizes (1/1, 1/4, 1/8) of unhealthy and healthy babies. Image pairs in this dataset were divided into 400 (200 healthy + 200 unhealthy) image pairs as training dataset, and 100 (50 healthy + 50 unhealthy) image pairs were separated as test dataset. During all the applications, the training and test images were arranged independently from each other. The low-resolution training and test images used in the applications have 80x60, 160x120, 320x240 image sizes. Super-resolution thermal images in 640x480 dimensions are obtained by upscaling the test images in the dataset by applying the deep network model mentioned in Section 2.2 before, at x2, x4, x8 ratios. Here, super-resolution images and ground truth images have the same dimensions which are 640x480. The developed deep network model (TSRGAN) and the original SRGAN network were passed through six different training and testing processes separately for three different datasets. From the results obtained, sample thermal images of healthy and unhealthy babies are shown in Figure 5 as low-resolution, bicubic interpolation, super-resolution, high-resolution (ground truth) images, respectively. In addition, all results of the obtained images were evaluated using PSNR / SSIM image quality metrics. Here, high-resolution (ground truth) images are used as reference images. PSNR / SSIM results were calculated separately for the three different datasets mentioned before and the results are shown in Table 1. In the proposed deep network model, as a result of the use of MSE loss as well as VGG loss in the backpropagation method, an average increase of 0.6 dB in PSNR values and an average of 3% increase in SSIM values compared to the SRGAN network was observed. In addition, the results obtained were compared with the images obtained as a result of low-resolution thermal images and bicubic interpolation. An increase of around 3.5 dB and 2 dB was observed in PSNR values, respectively, while an increase of around 12% and 5% in SSIM values was observed, respectively.
Table 1. PSNR/SSIM results for super-resolution implementations
|
|
LR |
Bicubic |
SRGAN |
TSRGAN (proposed) |
||||
|
Image datasets |
PSNR |
SSIM |
PSNR |
SSIM |
PSNR |
SSIM |
PSNR |
SSIM |
|
X2 |
30.614 |
0.9 |
32.584 |
0.918 |
33.946 |
0.945 |
34.585 |
0.966 |
|
X4 |
25.449 |
0.795 |
26.862 |
0.834 |
28.408 |
0.854 |
28.96 |
0.904 |
|
X8 |
21.33 |
0.659 |
22.729 |
0.736 |
24.074 |
0.821 |
24.472 |
0.843 |
Table 2. The parameters of the CNN based classifier model
|
Number of Layers |
Layers |
Number of Output Features |
Convolution Kernel and Maxpooling Size |
|
0 |
Input layer |
1 |
- |
|
1 |
Convolution layer |
128 |
3x3x3 |
|
2 |
Maximum pooling layer |
128 |
2x2x2 |
|
3 |
Convolution layer |
64 |
3x3x3 |
|
4 |
Maximum pooling layer |
64 |
2x2x2 |
|
5 |
Convolution layer |
64 |
3x3x3 |
|
6 |
Maximum pooling layer |
64 |
2x2x2 |
|
7 |
Flatten |
- |
- |
|
8 |
Fully connected layer |
128 |
- |
|
9 |
Fully connected layer |
64 |
- |
|
10 |
Fully connected layer |
32 |
- |
|
11 |
Dropout layer |
- |
- |
|
12 |
Fully connected layer |
1 |
- |
Table 3. Confusion matrices for classification results
|
Methods |
LR |
SRGAN |
TSRGAN (proposed) |
HR (original) |
||||
|
(x2) |
(x2) |
(x2) |
(x2) |
|||||
|
|
Unhealthy |
Healthy |
Unhealthy |
Healthy |
Unhealthy |
Healthy |
Unhealthy |
Healthy |
|
|
(predicted) |
(predicted) |
(predicted) |
(predicted) |
(predicted) |
(predicted) |
(predicted) |
(predicted) |
|
Unhealthy (actual) |
42 |
8 |
45 |
5 |
49 |
1 |
48 |
2 |
|
Healthy (actual) |
5 |
45 |
5 |
45 |
4 |
46 |
0 |
50 |
|
|
|
|
|
|
|
|
|
|
|
Methods |
LR |
SRGAN |
TSRGAN (proposed) |
HR (original) |
||||
|
(x4) |
(x4) |
(x4) |
(x4) |
|||||
|
|
Unhealthy |
Healthy |
Unhealthy |
Healthy |
Unhealthy |
Healthy |
Unhealthy |
Healthy |
|
|
(predicted) |
(predicted) |
(predicted) |
(predicted) |
(predicted) |
(predicted) |
(predicted) |
(predicted) |
|
Unhealthy (actual) |
40 |
10 |
46 |
4 |
47 |
3 |
48 |
2 |
|
Healthy (actual) |
2 |
48 |
3 |
47 |
1 |
49 |
0 |
50 |
|
|
|
|
|
|
|
|
|
|
|
Methods |
LR |
SRGAN |
TSRGAN (proposed) |
HR (original) |
||||
|
(x8) |
(x8) |
(x8) |
(x8) |
|||||
|
|
Unhealthy |
Healthy |
Unhealthy |
Healthy |
Unhealthy |
Healthy |
Unhealthy |
Healthy |
|
|
(predicted) |
(predicted) |
(predicted) |
(predicted) |
(predicted) |
(predicted) |
(predicted) |
(predicted) |
|
Unhealthy (actual) |
44 |
6 |
42 |
8 |
46 |
4 |
48 |
2 |
|
Healthy (actual) |
8 |
42 |
0 |
50 |
3 |
47 |
0 |
50 |
Figure 5. Sample images in order from left to right (low resolution, bicubic, srgan, tsrgan, ground truth)
3.2 Effects of super-resolution methods on classification implementation
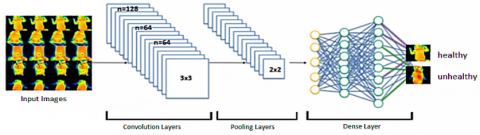
In this section, classification studies have been carried out on super-resolution thermal baby images obtained by using different datasets and super-resolution techniques as unhealthy and healthy. As a result of this study, it was aimed to reveal the effect of the super-resolution method applied to low-resolution thermal images in disease diagnosis. The general scheme of the CNN (convolutional neural networks) based classifier network developed for the classification application is shown in Figure 6. The network architecture consists of three convolution layers and four dense layers. The deep network architecture consists of convolution, pooling, and dense layer [29]. As the activation function, ReLU in the layers and sigmoid activation function in the output layer are used. The list of parameters belonging to the classifier network is given in Table 2. The classifier network based on the Keras library was individually trained and tested for low resolution, ground truth, and reconstructed super-resolution image groups. During the test phase, as a result of the applications performed for three different datasets, low resolution, the super-resolution thermal images obtained with the original SRGAN and super-resolution thermal images obtained with the proposed TSRGAN method were evaluated separately. Also high resolution (ground truth) dataset was considered as a reference target.
The confusion matrices provide us with a general framework for evaluating the success of the classification model [30]. The confusion matrices of the classification results obtained after the test phase are completed are shown in Table 3. It may differ the preferred metric according to applications [31]. In this implementation, the success of classifying unhealthy and healthy babies will be evaluated in the practice and there are equal numbers of observations for both classes. Therefore the use of the accuracy metric was preferred. However, precision, recall and F1 score metrics were also calculated to crosscheck the success of the classifier model. Table 4 shows the formulas for calculating accuracy, precision, recall and F1 score values from the confusion matrix. Here, the true negative (TN) value indicates how many healthy babies it predicts as healthy, while the true positive (TP) value indicates how many of the unhealthy babies are predicted as unhealthy. Also the false positive (FP) value indicates how many healthy babies are predicted as unhealthy, while false negative (FN) indicates how many unhealthy babies are predicted as healthy [32, 33].
Table 4. Calculation of classification metrics
|
Accuracy (%) |
$\frac{T P+T N}{T P+T N+F P+F N} \times 100$ |
|
Recall (%) |
$\frac{T P}{T P+E N} \times 100$ |
|
Precision (%) |
$\frac{T P}{T P+F P} \times 100$ |
|
F1 Score (%) |
$2 \times \frac{\text { Recall } \cdot \times \cdot \text { Precision }}{\text { Recall }+\text { Precision }} \times 100$ |
Figure 6. CNN based classifier architecture
Table 5. Classification results of three different data sets
|
Upscaling Methods |
Image Sets for Classification |
Accuracy (%) |
Precision (%) |
Recall (%) |
F1 Score (%) |
|
x2 |
LR |
87 |
89.4 |
84 |
86.6 |
|
SRGAN |
90 |
90 |
90 |
90 |
|
|
TSRGAN (Proposed) |
95 |
92.5 |
98 |
95.2 |
|
|
HR (Ground truth) |
98 |
100 |
96 |
97.9 |
|
|
x4 |
LR |
88 |
95.2 |
80 |
86.9 |
|
SRGAN |
93 |
93.9 |
92 |
92.9 |
|
|
TSRGAN (Proposed) |
96 |
97.9 |
94 |
95.9 |
|
|
HR (Ground truth) |
98 |
100 |
96 |
97.9 |
|
|
x8 |
LR |
86 |
84.6 |
88 |
86.3 |
|
SRGAN |
92 |
100 |
84 |
91.3 |
|
|
TSRGAN (Proposed) |
93 |
93.9 |
92 |
92.9 |
|
|
HR (Ground truth) |
98 |
100 |
96 |
97.9 |
In addition, the accuracy, precision, recall and F1 score rates calculated for all datasets are compared in Table 5. Accuracy rate is a measure of how accurately the classifier predicts. It is used to measure the success of a model, but accuracy value is not enough in the evaluation of the model. Therefore, the F1 Score has an important position as a measurement metric is needed to include all error factors. The F1 Score value refers to the harmonic mean of the Precision and Recall values. Here, precision value shows us how many of the values predicted as positive which are actually positive. Recall value is a measure of how much the classifier correctly predicts true positive value. Essentially, F1 score is preferred to avoid the wrong model selection in datasets that do not have an unequal distribution. When the results were examined, it was observed that accuracy and F1 Score values were close to each other, because the datasets used in this study are equally distributed.
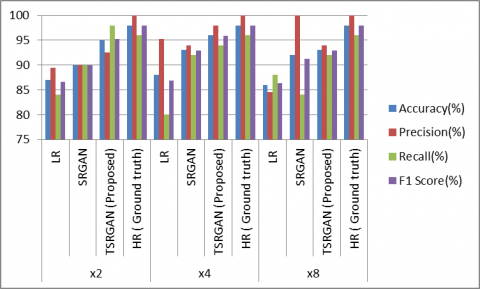
Comparison of classification metrics belonging to 3 different datasets is shown in Figure 7. When the results were evaluated for accuracy and F1 Score values, it was observed that the rate of classifying unhealthy and healthy babies with super-resolution images obtained as a result of the application of the proposed TSRGAN network correctly increased by an average of 7% compared to low-resolution images. In addition, when compared with the success of classifying super-resolution thermal images obtained with the original SRGAN, an average increase of 3% is observed. Considering these results, the classification success of the proposed method has largely approached the results of the classification study carried out with high resolution (ground truth) images. In addition, considering the recall values, the super-resolution images obtained with the proposed TSRGAN network increased by an average of 10% compared to low resolution images, while an average of 6% increase was observed when compared with the images obtained with the original SRGAN network. So, It was seen that babies who need to be identified as unhealthy are highly estimated as unhealthy.
Figure 7. Comparison of classification metrics
This paper presents a new approach designed based on generative adversarial networks for super-resolution applications in the field of thermal imaging. With this proposed deep network model, applications have been carried out on three different datasets. Here, six different training and testing processes were carried out separately for the developed deep network model (TSRGAN) and the original SRGAN network for three different datasets. As a result of the applications of the proposed method, the significant increases in PSNR and SSIM values have occurred as well as visual improvement in images. However, in order to evaluate the results visually, some sample images are shown in the sections where the studies are described. Considering the obtained results, the improvements in the quality of thermal baby images are seen when factors such as obtaining image edge details and minimizing blurriness are considered. In this paper, classification applications were carried out using the super-resolution images obtained as a result of the application of low resolution, ground truth, SRGAN, and proposed TSRGAN networks in order to perform a task-based evaluation of super-resolution thermal images. These applications show that super-resolution images have a significant success compared to low-resolution images based on the rate at which they can classify unhealthy and healthy babies correctly. In other words, when the accuracy rates were compared, it was seen that the proposed approach had a positive effect on classification problems. In addition, when precision, recall and F1Score values were evaluated, it was proven that the success of super resolution and classifier models. So, it has been observed that the classification success of obtained the super-resolution images is close to the ground truth images. In addition, these studies clearly demonstrate the importance of combining medical thermal imaging with super-resolution methods. Thus, the use of thermal imaging systems and super-resolution methods in medical fields such as disease diagnosis will be facilitated and it is foreseen that researchers' interest in studies on these issues will increase day by day, and studies in these areas will become widespread. As a result, successful results can be obtained with lower-cost imaging systems, and a solution to an important problem will be provided.
This project is financially supported by the Scientific Research Projects Coordinatorship of Konya Technical University (project number: 201102001).
The thermal images used in this study were obtained in project studies supported by the Scientific and Technological Research Council of Turkey (TUBITAK, project number: 215E019).
[1] Chudasama, V., Patel, H., Prajapati, K., Upla, K., Ramachandra, R., Raja, K., Bush, C. (2020). TherISuRNet-A computationally efficient thermal image super-resolution network. 2020 IEEE/CVF Conference on Computer Vision and Pattern Recognition Workshops (CVPRW), Seattle, WA, USA, pp. 388-397. http://dx.doi.org/10.1109/CVPRW50498.2020.00051
[2] Zhang, X., Li, C., Meng, Q., Liu, S., Zhang, Y., Wang, J. (2018). Infrared image super resolution by combining compressive sensing and deep learning. Sensors (Basel), 18(8): 2587. https://doi.org/10.3390/s18082587
[3] Chen, W.K. (1993). Linear Networks and Systems. Belmont, 123-135. https://doi.org/10.1142/0676
[4] Yue, L., Shen, H., Li, J., Yuan, Q., Zhang, H., Zhang, H., Zhang, L. (2018). Image super-resolution: the techniques, applications, and future. Signal Processing, 128: 389-408. http://dx.doi.org/10.1016/j.sigpro.2016.05.002
[5] Toyran, M. (2008). Reconstructing super resolution images from low resolution images. M.Sc. Thesis, Institute of Science, Istanbul.
[6] Lobanov, A.P. (2005). Resolution limits in astronomical images. arXiv, preprint astro-ph/0503225.
[7] Dong, C., Loy, C.C., He, K., Tan, X. (2016). Image super-resolution using deep convolutional networks. IEEE Transactions on Pattern Analysis and Machine Intelligence, 38(2): 295-307. http://dx.doi.org/10.1109/TPAMI.2015.2439281
[8] Guei, A., Akhlouf, M. (2018). Deep learning enhancement of infrared face images using generative adversarial networks. Applied Optics, 57(18): D98-D107. http://dx.doi.org/10.1364/AO.57.000D98
[9] Girshick, R., Donahue, J., Darrell, T., Malik, J. (2016). Region-based convolutional networks for accurate object detection and segmentation. IEEE Transactions on Pattern Analysis and Machine Intelligence, 38(1): 142-158. http://dx.doi.org/10.1109/TPAMI.2015.2437384
[10] Ciftci, S., Karaman, M. (2020). Landsat Uydu Görüntülerinde Derin Öğrenme Tabanlı Tek Görüntülü Süper-Çözünürlük Deneyleri. Harran Üniversitesi Muhendislik Dergisi, 5(3): 194-204. https://doi.org/10.46578/humder.819176
[11] Lillesand, T., Kiefer, R.W., Chipman, J. (2014). Remote Sensing and Image Interpretation. John Wiley & Sons, Hoboken.
[12] Dong, W., Fu, F., Shi, G., Cao, X., Wu, J., Li, G., Li, X. (2016). Hyperspectral image super-resolution via non-negative structured sparse representation. IEEE Transactions on Image Processing, 25(5): 2337-2352. http://dx.doi.org/10.1109/TIP.2016.2542360
[13] Thawakar, O., Patil, P.W., Dudhane, A., Murala, S., Kulkarni, U. (2019). Image and video super resolution using recurrent generative adversarial network. In 2019 16th IEEE International Conference on Advanced Video and Signal Based Surveillance (AVSS), pp. 1-8. http://dx.doi.org/10.1109/AVSS.2019.8909900
[14] Nguyen, K., Fookes, C., Sridharan, S., Denman, S. (2013). Feature-domain super-resolution for iris recognition. Computer Vision and Image Understanding, 117(10): 1526-1535. http://dx.doi.org/10.1016/j.cviu.2013.06.010
[15] Glasner, D., Bagon, S., Irani, M. (2009). Super-resolution from a single image. IEEE 12th International Conference on Computer Vision, pp. S349-S356. http://dx.doi.org/10.1109/ICCV.2009.5459271
[16] Singh, K., Gupta, A., Kapoor, R. (2015). Fingerprint image super-resolution via ridge orientation-based clustered coupled sparse dictionaries. Journal of Electronic Imaging, 24(4): 043015. http://dx.doi.org/10.1117/1.JEI.24.4.043015
[17] Gu, Y., Zeng, Z., Chen, H., Wei, J., Zhang, Y., Chen, B., Li, Y., Qin, Y., Xıe, Q., Jiang, Z., Lu, Y. (2020). MedSRGAN: Medical images super-resolution using generative adversarial networks. Multimedia Tools and Applications, 79: 21815-21840. http://dx.doi.org/10.1007/s11042-020-08980-w
[18] Senalp, F.M., Ceylan, M. (2020). Enhancement of low resolution thermal face image resolution using deep learning. European Journal of Science & Technology, S131-S135. https://doi.org/10.31590/ejosat.802174
[19] Ornek, A.H., Ceylan, M., Ervural, S. (2019). Health status detection of neonates using infrared thermography and deep convolutional neural networks. Infrared Physics & Technology, 103: 103044. http://dx.doi.org/10.1016/j.infrared.2019.103044
[20] Savasci, D., Ceylan, M., Ornek, A.H., Konak, M., Soylu, H. (2020). Heart disease detection from neonatal ınfrared thermograms using multiresolution features and data augmentation. International Journal of Intelligent Systems and Applications in Engineering, 8(1): 28-36. http://dx.doi.org/10.18201/ijisae.2020158886
[21] Ledig, C., Theis, L., Huszar, F., Caballero, J., Cunningham, A., Acosta, A., Aitken, A., Tejani, A., Totz, J., Wang, Z., Shi, W. (2017). Photo-realistic single image super-resolution using a generative adversarial network. 2017 IEEE Conference on Computer Vision and Pattern Recognition (CVPR), Honolulu, pp. 105-114. http://dx.doi.org/10.1109/CVPR.2017.19
[22] Johnson, J., Alahi, A., Li, F. (2016). Perceptual losses for real-time style transfer and super resolution. In European Conference on Computer Vision (ECCV) Springer, 694-711. http://dx.doi.org/10.1007/978-3-319-46475-6_43
[23] Du, W., Addepalli, P., Zhao, Y. (2019). The spatial resolution enhancement for a thermogram enabled by controlled sub-pixel movements. IEEE Transactions on Instrumentation and Measurement, 69(6): 3566-3575. http://dx.doi.org/10.1109/TIM.2019.2932175
[24] Dosovitskiy, A., Brox, T. (2016). Generating images with perceptual similarity metrics based on deep networks. In Advances in Neural Information Processing Systems (NIPS), pp. 658-666.
[25] Goodfellow, I., Pouget-Abadie, J., Mirza, M., Xu, B., Warde-Farley, D., Ozair, S., Courville, A., Bengio, Y. (2014). Generative adversarial networks. Communications of the ACM, 63(11): 139-144. http://dx.doi.org/10.1145/3422622
[26] Anwar, S., Khan, S., Barnes, N. (2020). A deep journey into super-resolution: A survey. ACM Computing Surveys, 53(3): 1-34. http://dx.doi.org/10.1145/3390462
[27] Ioffe, S., Szegedy, C. (2015). Batch normalization: accelerating deep network training by reducing internal covariate shift. Proceedings of The 32nd International Conference on Machine Learning (ICML), pp. 448-456.
[28] Rivadeneira, R., Sappa, A., Vintimilla, B. (2020). Thermal image super-resolution: A novel architecture and dataset. 15th International Conference on Computer Vision Theory and Applications, pp. 111-119. http://dx.doi.org/10.5220/0009173601110119
[29] Javaid, H., Babar, T.K., Rasool, A., Saghir, R.U. (2013). Video colour variation detection and motion magnification to observe subtle changes. M.Sc. Thesis, Blekinge Institute of Technology, Faisalabad, Pakistan.
[30] Lai, Z., Deng, H. (2018). Medical image classification based on deep features extracted by deep model and statistic feature fusion with multilayer perceptron. Computational Intelligence and Neuroscience, 2018: 1-13. https://doi.org/10.1155/2018/2061516
[31] Miranda, E., Aryuni, M., Irwansyah, E. (2016). A survey of medical image classification techniques. 2016 International Conference on Information Management and Technology (ICIMTech), pp. 56-61. http://dx.doi.org/10.1109/ICIMTech.2016.7930302
[32] Loussaief, S., Abdelkrim, A. (2018). Machine learning framework for image classification. Advances in Science, Technology and Engineering Systems Journal, 3(1): 1-10. http://dx.doi.org/10.25046/aj030101
[33] Xin, M., Wang, Y. (2019). Research on image classification model based on deep convolution neural network. EURASIP Journal on Image and Video Processing. http://dx.doi.org/10.1186/s13640-019-0417-8