Xue Wang
© 2021 IIETA. This article is published by IIETA and is licensed under the CC BY 4.0 license (http://creativecommons.org/licenses/by/4.0/).
OPEN ACCESS
Container handling is a key link in container transport. In an automated handling terminal, the work efficiency directly depends on the time cost of the alignment between the spreader and the lock holes of the container. This paper attempts to improve the recognition and location of container lock holes with the aid of machine vision. Firstly, a lock hole recognition algorithm was designed based on local binary pattern (LBP) feature and classifier. After feature extraction and classifier training, multi-scale sliding window was used to recognize each lock hole. To realize real-time, accurate recognition of lock holes, the convolutional neural network (CNN) with improved threshold was incorporated to our algorithm. The tests on actual datasets show that our algorithm can effectively locate container lock holes.
convolutional neural network (CNN), feature extraction, target detection, sliding window, automated terminal
With the boom of international trade, container transport has become a cornerstone of import and export. To cope with the surging container traffic, the port cranes must be made more automated and intelligent to handle containers more efficiently. For example, the container handling could be guided by machine vision technology.
During the loading/unloading of containers, a critical issue is to quickly align the spreader with the four lock holes of the container. Traditionally, container handling is controlled manually. The manual control is time-consuming, and easy to cause accidents, making container handling slow and inefficient.
Under the above background, it is important to develop an intelligent handling terminal based on machine vision. The intelligent handling terminal should be able to accurately determine the container position, and guide the rapid alignment between the spreader and the container lock holes.
Most containers are cuboids. Their structures and specifications generally conform to international standards. Every corner of a container has three lock holes. To handle the container, the bridge crane driver needs to manually insert the sliding locks into the lock holes. Due to the small size of lock holes, the insertion is extremely difficult in actual handling process. To make matters worse, the camera that captures the image of the container is often far away from the container during loading/unloading. Besides, the lock holes may have strains and light shadows, adding to the difficulty to the operation by bridge crane driver.
Therefore, more and more high and new technologies have been introduced to the construction of container terminals. In an intelligent handling terminal, the operators could rely on machine vision to locate each lock hole, and then guide the spreader to the position of the lock hole, which greatly facilitating the handling of container goods.
Based on machine vision, this paper proposes a recognition and location method for container lock holes. By identifying and positioning the holes, our algorithm helps to spreader to grasp the container automatically. The automation of container handling will significantly lower the working intensity of the bridge crane driver, and reduce the cost of human resources.
The automatic transport at ports is in vogue among developers. Hence, more and more researchers have tried to automate the loading/unloading of containers through machine vision.
Xiao et al. [1] designed a simulation system for container loading/unloading, which includes hardware like motion controller and motor driver, and software for image acquisition and target recognition. Wu et al. [2] used the support vector machine (SVM) classifier to identify containers: the geometric, color, and texture features of the container were synthetized and inputted to the SVM classifier; a suitable SVM model was designed; the affine transform was implemented to locate the container and measure the exact distance between the container and the spreader. Hui et al. [3] identified and located the container with binocular stereo vision: the container image acquired by a calibrated binocular camera was preprocessed, and the lock holes were identified and located in the image through template matching. Shen et al. [4] designed a machine vision-based method to position the container and the spreader: the container image was segmented by the texture features of the container and the geometric features of lock holes; the lock holes were fitted through Hough transform; the image was defogged with dark channel extraction, such that the method can extract the image features in foggy weather. For real-time detection and accurate positioning of container lock holes, Kunimitsu et al. [5] combined classifier training with sliding window detection to recognize lock holes, and carried out linear iterative fitting based on the recognized lock hole areas, thereby pinpointing the position of each lock hole. With the help of machine vision system, Sacks et al. [6] assisted the operation of container crane, and protected the safety of workers. Dan et al. [7] developed machine vision systems to track and guide crane operations. To improve container loading/unloading, Xiong et al. [8] proposed a container recognition system based on stereo vision: the original image was segmented; the container was recognized and located by binocular stereo vision system; the container-spreader distance was computed based on the container position. Bin and Sun [9] derived a new programming model to analyze the position of container and improve the operation efficiency of crane.
The existing recognition technologies for container lock holes have not formed a mature system. The recognition and positioning performance still faces several problems. First, the lock holes can be detected accurately in the container image with a uniform background and salient features. In actual terminal environment, however, the container image usually has a complex background, with shape elements similar to the contour of the container. It is very difficult to recognize the container in such an image by the current technologies. Second, the container image quality is worsened by the diverse angles and light intensities of lock holes. The poor quality will lead to false detection. Third, the spreader position shakes at a high elevation when it is aligned with the lock holes. The shooting angle of the camera will change accordingly, affecting the detection result.
Traditionally, container lock holes are recognized in the following process: Preprocessing the container image, segmenting the image, and identifying the lock holes by color. However, the traditional approach is not stable enough to locate and track the lock holes, if the illumination and background are very complex.
Feature extraction lies at the core of automatic recognition and location of container lock holes. The algorithm of feature extraction bears on the speed and accuracy of target recognition. In target detection, the common geometric features include histogram of oriented gradients (HOG) [10], local binary pattern (LBP) [11], and Harr feature [12].
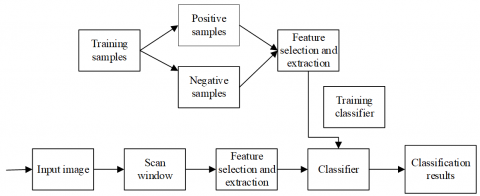
Because no public dataset is available for container lock holes, this paper collects samples of these holes first, then divides them into positive and negative samples, and extracts features for classifier training. Figure 1 shows our framework for lock hole recognition.
Figure 1. Framework of lock hole recognition
For machine learning-based lock hole recognition, the quality of extracted features is the key to classifier training. In this paper, the LBP feature, an operator about image texture, is selected to eliminate the interference of light and shadow.
The idea of the LBP is to describe the variation in image texture by reporting the pixel value at a specific position and the pixel values of the region near that position. In a 3×3 window, the pixel value at the positive center pixel (x, y) is taken as the threshold, and the pixel value of (x, y) is compared with that of every other pixel (starting from (x-1, y)) in counterclockwise direction. If the other pixel is greater than the center pixel, the comparison result is recorded as 1; otherwise, it is recorded as 0. This operation generates an 8-bit binary code, which will be converted into decimal number. This number is the value of the LBP feature at (x, y), which reflects the texture variation of the image:
$\operatorname{LBP}(\mathrm{x}, \mathrm{y})=\sum_{\mathrm{i}=0}^{7} \mathrm{R}\left(\mathrm{f}_{\mathrm{i}}(\mathrm{x}, \mathrm{y})-\mathrm{f}(\mathrm{x}, \mathrm{y})\right) \times 2^{7-\mathrm{i}}$ (1)
$\mathrm{R}\left(\mathrm{f}_{\mathrm{i}}(\mathrm{x}, \mathrm{y})-\mathrm{f}(\mathrm{x}, \mathrm{y})\right)=\left\{\begin{array}{ll}1, & \mathrm{f}_{\mathrm{i}}(\mathrm{x}, \mathrm{y})-\mathrm{f}(\mathrm{x}, \mathrm{y}) \geq 0 \\ 0, & \mathrm{f}_{\mathrm{i}}(\mathrm{x}, \mathrm{y})-\mathrm{f}(\mathrm{x}, \mathrm{y})<0\end{array}\right.$ (2)
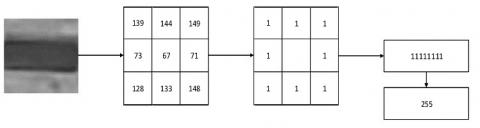
where, $\mathrm{f}(\mathrm{x}, \mathrm{y})$ is the value of the center pixel; $\mathrm{f}_{\mathrm{i}}(\mathrm{x}, \mathrm{y})$ is the value of a pixel within 8 points from the center pixel. Figure 2 illustrates the calculation process of the LBP feature.
Figure 2. Calculation process of LBP feature
As can be seen from Figure 2, the extracted LBP operator can be converted into a code for each pixel, such that an image can be described by several codes. In reality, however, the position difference will bring a huge error, if only the features from pixel pairs are subject to discriminant analysis. To mitigate the error, the original image should be split into multiple sub-regions, and the pixels should be extracted from each sub-region to establish a histogram of LBP features. In this way, an image can be expressed as the combination of several statistical histograms.
In this paper, the AdaBoost [13] algorithm is chosen as the classifier. The algorithm first trains several weak classifiers with the sample set, and then combines these weak classifiers into a strong classifier. The classification accuracy of the strong classifier depends on that of every weak classifier. Figure 3 presents the basic framework of AdaBoost algorithm.
Figure 3. Basic framework of AdaBoost algorithm
Every strong classifier is a polynomial algorithm with strong learning ability and high classification accuracy. Let $S=\left\{\left(x_{1}, B_{1}\right),\left(x_{2}, B_{2}\right), \ldots,\left(x_{n}, B_{n}\right)\right\}$ be the training set, where $x_{i}$ is randomly selected as an independent data in an unknown distribution $\mathrm{D}(\mathrm{x})$, $\mathrm{B}_{\mathrm{i}}=\mathrm{f}\left(\mathrm{x}_{\mathrm{i}}\right)$ is a known set of Boolean functions. For any $\mathrm{D}(\mathrm{x})$ and $\mathrm{f}()$, $\varepsilon \geq 0, \alpha \leq 1 / 2$, and the algorithm can find a probability satisfying Pr[h(x)]≤ε is greater than or equal to 1-α.
Each weak classifier is an algorithm slightly more accurate than random guess. In practice, it is easier to obtain a weak classifier than a strong classifier. Through repeated training, a series of weak classifiers can be synthesized into a strong classifier. Let $\mathrm{h}_{1}, \mathrm{~h}_{2}, \ldots \mathrm{h}_{\mathrm{n}}$ be the hypotheses that constrain the synthesis. The general hypothesis can be defined as:
$f(x)=\sum_{i=1}^{n} a_{i} h_{i}(x)$ (3)
where, ${a}_{i}$ is the coefficient of ${h}_{i}$(). The AdaBoost mainly solves the probability of the next iteration data, and assigns the weight to each weak classifier that constitute the strong classifier.
Each lock hole was recognized according to the shape features of outer and inner circles. Combined with image pyramid, a sliding window was adopted to choose the target image. The window size was kept constant, while the size of target image could be increased or reduced during the real-time sliding process. Hence, depending on the lock hole size, the target image was expanded or reduced during the recognition. Despite its high accuracy, the sliding window consumed too much time, as it needs to transverse the entire large image.
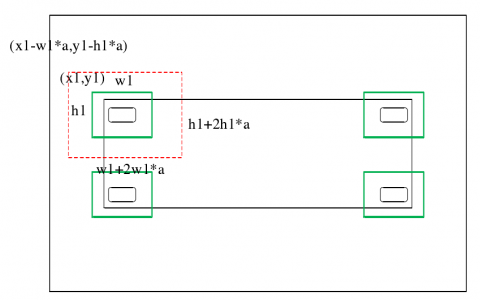
To solve the problem, the first frame of the video was scanned globally to determine the coordinates of the potential area of the lock hole. In Figure 4, (x1, y1) are the coordinates of the upper left corner; w1 and h1 are the width and height of the potential area of the lock hole in the upper left corner, respectively.
Then, a sliding area was defined in the next frame for the sliding window (Figure 5). In this way, the irrelevant areas will not be scanned, speeding up the recognition process. According to the offset of lock hole positions in the previous frame during actual loading/unloading, the sliding area of that frame was expanded by a certain scale to obtain the sliding area of the next frame. In Figure 5, $(x 1-w 1 \times a, y 1-h 1 \times a)$ are the coordinates of the upper left corner; $\mathrm{w} 1+2 \mathrm{w} 1 \times \mathrm{a}$ and $\mathrm{h} 1+2 \mathrm{~h} 1 \times \mathrm{a}$ are the width and height of the sliding area of the lock hole in the upper left corner, respectively; a is a user-defined scale factor.
Figure 4. Global recognition of the first frame
Figure 5. Sliding area of the next frame
To verify the proposed recognition algorithm for container lock holes, the images collected in a port were organized into a training set, and a test set (Table 1). The test set contains 1,000 samples. The number of positive and negative samples the training set were set to different levels. Then, the classifier designed based on feature extraction and strong classifier was trained by three different training sets. The recognition accuracy of the trained classifier was judged against the benchmark of no missing/false recognition. The test results (Table 1) show that the recognition accuracy increased with the number of positive and negative samples. The highest accuracy was realized by the classifier trained on test set 3. But that classifier consumed 449ms to recognize each image, which fails to meet the real-time requirement.
Table 1. Recognition accuracies under different positive and negative samples
|
Training set number |
Number of positive samples |
Number of negative samples |
Accuracy |
Error rate |
Mean time |
|
1 |
1,000 |
4,000 |
65.5% |
22.5% |
241ms |
|
2 |
2,000 |
8,000 |
76.9% |
11.4% |
319ms |
|
3 |
3,000 |
12,000 |
87.5% |
6.15% |
449ms |
In traditional target detection strategies, the targets are recognized after the image features are extracted and classified. There are many problems with this traditional approach, namely, the features are expressed inaccurately, the classifier has a high error rate, the classification faces time delays. By contrast, deep learning-based target detection chooses a region of interest (ROI) based on the features automatically extracted by the convolution layers. Compared with sliding window, the ROI can greatly improve the recognition effect.
At present, the CNN-based detection algorithms are implemented either in two stages or in one stage. The two-stage algorithms are represented by region-based CNN (R-CNN) [14], fast R-CNN [15], and faster R-CNN [16]. These algorithms first generate several ROIs, and then classify and adjust the positions of these regions. The typical one-stage algorithm is you only look once [17], which directly obtains the class probability and position of the target without needing to create ROIs. YOLO boasts fast detection speed and good real-time performance. Therefore, this paper selects YOLO as the target detection model of container lock holes. The framework of the YOLO model is shown in Figure 6.
Figure 6. Framework of YOLO model
Known for its excellent speed and accuracy, YOLO is an end-to-end detector that condensates the multiple steps of target recognition into one process, and detects targets with only one network. Target detection by YOLO can be roughly divided into three steps: adjusting image size, importing the image to the CNN, and acquiring the detection frame of the target boundary through non-maximum suppression.
Once the original image has been adjusted to the size of the input required by the CNN, the image is meshed into $S \times S$ grids. The network will detect the target in each grid, and calculate the confidence. For each grid, B bounding boxes of different scales and their confidences will be obtained. The confidence of a box reflects the probability for the target to appear in the box, and the accuracy of target positioning. Let $\mathrm{P}_{\mathrm{r}}(\mathrm{O})$ be the probability for a box to contain a target; $\mathrm{IOU}_{\mathrm{p}}^{\mathrm{t}}$ be the intersection-over-union ratio of predicted box and real target, that is, the overlap rate of candidate box and marker box. The optimal value of $\mathrm{IOU}_{\mathrm{p}}^{\mathrm{t}}$ is one. During the target recognition, when each grid detects the probability of a class and the confidence of B boxes, we have:
$\mathrm{P}_{\mathrm{r}}\left(\right.$ class $\left._{\mathrm{i}} \mid \mathrm{O}\right) \times \mathrm{P}_{\mathrm{r}}(\mathrm{O}) \times \mathrm{IOU}_{\mathrm{p}}^{\mathrm{t}}=\mathrm{P}_{\mathrm{r}}\left(\right.$ class $\left._{\mathrm{i}}\right) \times \mathrm{IOU}_{\mathrm{p}}^{\mathrm{t}}$ (4)
where, $\mathrm{P}_{\mathrm{r}}\left(\right.$ class $\left._{\mathrm{i}} \mid \mathrm{O}\right)$ is the probability for a target to belong to class W.
Apart from identifying the class of each target, the YOLO algorithm can measure the accuracy of the target box. The detection result can be represented as an $\mathrm{S} \times \mathrm{S} \times(\mathrm{B} \times 5+\mathrm{W})$ vector.
In addition, the YOLO algorithm clusters the wide and high dimensions of reference frame by K-means algorithm [18]. The distance function of the clustering standard can be established as:
distance(box, center) $=1-\mathrm{IOU}($ box, center $)$ (5)
A total of five anchors is adopted by YOLO to predict the border. Each anchor detects targets within its region. The predicted value for each border can be denoted as $\mathrm{b}_{\mathrm{x}}$, $\mathrm{b}_{\mathrm{y}}$, $\mathrm{b}_{\mathrm{w}}$, $\mathrm{b}_{\mathrm{h}}$ and $\mathrm{b}_{\mathrm{o}}$, the coordinates of the upper left corner of the grid as $\left(\mathrm{c}_{\mathrm{x}}, \mathrm{c}_{\mathrm{y}}\right)$, and the height of anchor as $\left(p_{w}, p_{h}\right)$ the center coordinates $\left(\mathrm{O}_{\mathrm{X}}, \mathrm{O}_{\mathrm{y}}\right)$ of the predicted border can be described as:
$\mathrm{o}_{\mathrm{x}}=\rho\left(\mathrm{t}_{\mathrm{x}}\right)+\mathrm{c}_{\mathrm{x}}$ (6)
$o_{y}=\rho\left(t_{y}\right)+c_{y}$ (7)
where, $\rho\left(\mathrm{t}_{\mathrm{x}}\right)$ and $\rho\left(\mathrm{t}_{\mathrm{y}}\right)$ are the relative positions between the center of the border and the abscissa and ordinate of the upper left corner of the grid, respectively. The width and height of the predicted border can be respectively calculated by:
$o_{w}=p_{w} \exp \left(b_{w}\right)$ (8)
$\mathrm{o}_{\mathrm{h}}=\mathrm{p}_{\mathrm{h}} \exp \left(\mathrm{b}_{\mathrm{h}}\right)$ (9)
The performance of target detection can be measured by multiple indices, including but not limited to precision, recall, and mean average precision (mAP). Precision is the fraction of relevant instances among the retrieved instances, while is the fraction of relevant instances that were retrieved. True positive (TP), false positive (FP), true negative (TN), and false negative (FN) are defined as the number of correctly detected targets and the number of boxes meeting the IOU, the number of detected targets, the number of incorrectly detected targets and the number of boxes exceeding the IOU, and the number of undetected targets, respectively. The confusion matrix is shown in Table 2.
Table 2. Confusion matrix
|
|
Relevant |
Non-Relevant |
|
Retrieved |
TPs |
FPs |
|
Not Retrieved |
FNs |
TNs |
Three kinds of anchors are available for the YOLO model. The mesh sizes of them are 13, 26, and 52, in turn. The minimum box size is 8 × 8. In this paper, the minimum box size is too small, because the lock hole images captured by the camera are generally larger than 8 × 8. As for the mesh size of 52 × 52, the prediction tensor will be so large as to increase the detection time. Therefore, this paper chooses the anchors of 13 × 13 and 26 × 26 to ensure the detection ability and save time cost. In our experiments, the kernel sizes of convolutional layer and pooling layer were set to 3 × 3 and 2 × 2, respectively. The former layer aims to extract image features, and the latter seeks to reduce data dimension.
Figure 7. 10-layer network model
Figure 8. 15-layer network model
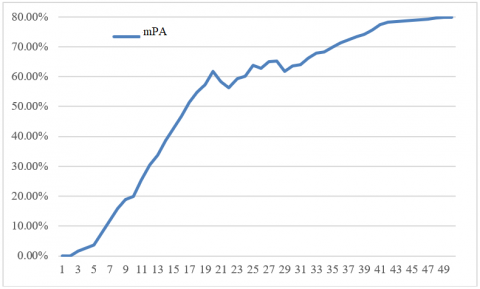
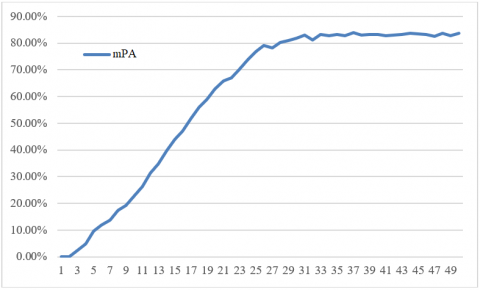
Figure 9. 50-layer network model
During network training, the VGG network was employed to build a 10-layer network and a 15-layer network, and the residual network (ResNet) was selected to build a 50-layer network. The three networks were tested in search for the model with the highest mAP in each network. The threshold was adjusted repeatedly during the test. The model performance was evaluated by precision, recall, and IOU. Each network was trained iteratively for 10,000 cycles, and a model was generated every 200 cycles. The experimental results are presented in Figures 7-9, respectively.
The above three figures show that the 50-layer network model achieved the best performance: the more the network layers, the greater the mAP of the detection model, and the more stable the model.
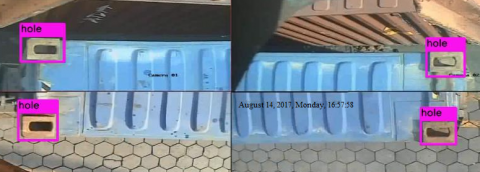
Therefore, the 50-layer network was selected for the recognition model of container lock holes. The actual recognition result is shown in Figure 10, which testifies the good real-time performance and accuracy of our model.
Figure 10. Actual recognition result of the YOLO-based model
This paper applies machine vision to identify and position the lock holes of the container, as the container is being handled at the port. Firstly, a lock hole recognition algorithm was designed by coupling LBP and AdaBoost. But the algorithm was found to consume too much time. To solve the problem, the neural network was improved according to the lock hole size during the recognition process, and the threshold was adjusted in the light of the actual demand. In this way, a YOLO-based recognition algorithm was derived for container lock holes. The feasibility and effectiveness of the algorithm were proved through experiments.
[1] Xiao, A., Chen, R., Li, D., Chen, Y., Wu, D. (2018). An indoor positioning system based on static objects in large indoor scenes by using smartphone cameras. Sensors, 18(7): 2229. https://doi.org/10.3390/s18072229
[2] Wu, Z., Fu, K., Jedari, E., Shuvra, S.R., Rashidzadeh, R., Saif, M. (2016). A fast and resource efficient method for indoor positioning using received signal strength. IEEE Transactions on Vehicular Technology, 65(12): 9747-9758. https://doi.org/10.1109/TVT.2016.2530761
[3] Hui, J., Yang, Y., Hui, Y., Luo, L. (2016). Research on identify matching of object and location algorithm based on binocular vision. Journal of Computational and Theoretical Nanoscience, 13(3): 2006-2013. https://doi.org/10.1166/jctn.2016.5147
[4] Shen, Y., Mi, W., Zhang, Z. (2017). A positioning lockholes of container corner castings method based on image recognition. Polish Maritime Research, 24(3): 95-101. https://doi.org/10.1515/pomr-2017-0110
[5] Kunimitsu, S., Asama, H., Kawabata, K. (2001). Measurement of relative position of container with image processing for automatic container cranes. IEEJ Transactions on Electronics, Information and Systems, 121(5): 882-891. https://doi.org/10.1541/ieejeiss1987.121.5_882
[6] Sacks, R., Navon, R., Brodetskaia, I., Shapira, A. (2005). Feasibility of automated monitoring of lifting equipment in support of project control. Journal of Construction Engineering and Management, 131(5): 604-614. https://doi.org/10.1061/(ASCE)0733-9364(2005)131:5(604)
[7] Dan, D., Dan, Q. (2021). Automatic recognition of surface cracks in bridges based on 2D-APES and mobile machine vision. Measurement, 168: 108429. https://doi.org/10.1016/j.measurement.2020.108429
[8] Xiong, L., Teng, G.W., Yu, Z.P., Zhang, W.X., Feng, Y. (2016). Novel stability control strategy for distributed drive electric vehicle based on driver operation intention. International Journal of Automotive Technology, 17(4): 651-663. https://doi.org/10.1007/s12239-016-0064-3
[9] Bin, S., Sun, G. (2020). Optimal energy resources allocation method of wireless sensor networks for intelligent railway systems. Sensors, 20(2): 482. https://doi.org/10.3390/s20020482
[10] Nguyen, D.T., Park, K.R. (2016). Enhanced gender recognition system using an improved histogram of oriented gradient (HOG) feature from quality assessment of visible light and thermal images of the human body. Sensors, 16(7): 1134. https://doi.org/10.3390/s16071134
[11] Yan, X.D., Song, X.G. (2020). An image recognition algorithm of bolt loss in underground pipelines based on local binary pattern operator. Traitement du Signal, 37(4): 679-685. https://doi.org/10.18280/ts.370418
[12] Park, K.Y., Hwang, S.Y. (2014). An improved Haar-like feature for efficient object detection. Pattern Recognition Letters, 42: 148-153. https://doi.org/10.1016/j.patrec.2014.02.015
[13] Yang, X.Y., Liang, N.N., Zhou, W., Lu, H.M. (2020). A face detection method based on skin color model and improved AdaBoost algorithm. Traitement du Signal, 37(6): 929-937. https://doi.org/10.18280/ts.370606
[14] Xiao, Y., Li, C., Song, L., Yang, J., Su, J.F. (2021). A multidimensional information fusion-based matching decision method for manufacturing service resource. IEEE Access, 9: 39839-39851. https://doi.org/10.1109/ACCESS.2021.3063277
[15] Zhu, X., Chen, C., Zheng, B., Yang, X., Gan, H., Zheng, C., Xue, Y. (2020). Automatic recognition of lactating sow postures by refined two-stream RGB-D faster R-CNN. Biosystems Engineering, 189: 116-132. https://doi.org/10.1016/j.biosystemseng.2019.11.013
[16] Aroulanandam, V.V., Latchoumi, T.P., Bhavya, B., Sultana, S.S. (2019). Object detection in convolution neural networks using iterative refinements. Revue d'Intelligence Artificielle, 33(5): 67-372. https://doi.org/10.18280/ria.330506
[17] Shafiee, M.J., Chywl, B., Li, F., Wong, A. (2017). Fast YOLO: A fast you only look once system for real-time embedded object detection in video. arXiv preprint arXiv:1709.05943.
[18] Likas, A., Vlassis, N., Verbeek, J.J. (2003). The global k-means clustering algorithm. Pattern Recognition, 36(2): 451-461. https://doi.org/10.1016/S0031-3203(02)00060-2