Oana Diana Eva* | Anca Mihaela Lazar
© 2019 IIETA. This article is published by IIETA and is licensed under the CC BY 4.0 license (http://creativecommons.org/licenses/by/4.0/).
OPEN ACCESS
The goal of this research involving a motor imagery brain-computer interface paradigm is to assess the possibility of enhancing the classification rate handling a feature vector based on the modulation of electrophysiological brain activity in specific bands. A new amplitude modulation energy index of the cerebral rhythms is proposed as feature vector concept. The method is proven on a public database and on a set of electroencephalographic data recorded in our own laboratory. In both cases, only eight electrodes are used in order to reach high performance classifying rates. The discrimination of motor tasks (imagination of right and left hand movements) is analyzed by means of five classifiers: support vector machine, k nearest neighbor, linear discriminant analysis, quadratic discriminant analysis and Mahalanobis distance based classifier. For our database, the medians of the classification rates for two of classifiers are very high (94.62 % - 97.76 %) when some rhythms are modulated in theta and alpha bands. Significantly higher classification rates reported herein (greater than 90 % for both of the databases) compared with classifiers trained on the other features prove that the index may be very useful for highlighting the modulation found in certain bands of the EEG rhythms.
classification algorithms, EEG rhythms electroencephalography, features extraction, Hilbert transform, motor imagery, modulation bands, temporal envelope
A brain computer interface (BCI) measures the electrical neural activity and converts it into commands for a computer or for external equipment represented by a wheelchair or a neuroprosthetic device. The main purpose of BCI is to offer to disabled people with neuromuscular disorder the possibility to communicate with his/her environment without muscle action, measuring only the brain activity that is to decode human intentions into messages or control signals for an output device [1-3].
The development during the last 10 years of technologies based on BCI systems leads to the improvement of the quality of life for people with severe neuromotor disabilities.
A BCI electroencephalographic (EEG) based system is the best choice from the point of view of simplicity, safety, temporal resolution and costs. Such a system can detect and classify specific features enclosed in EEG signals that are associated with different activities or tasks.
The user of the BCI system has to perform different tasks and to adopt mental strategies to produce significant EEG features. The most common mental strategies are selective based paradigms (focusing on different goals) and motor imagery (MI) ones [4].
The well-known features elicited by selective attention are the P300 event related potential [5, 6] and the steady-state visual evoked potential (SSVEP) [6-8].
Sensorimotor rhythms (SMR) represent oscillations recorded in the motor cortex. The brain oscillations are classified according to the following specific frequency bands: Delta (0.1 – 4 Hz), Theta (4 - 8 Hz), Alpha (8 - 12 Hz), Beta (12 - 30 Hz) and Gamma (30 - 60 Hz). The Alpha rhythm activity recorded in the sensorimotor area is also called Mu rhythm. Decreasing oscillatory activity in a specific frequency band (event related desynchronization - ERD) and increasing oscillatory activity in a specific frequency band (event related synchronization - ERS) may be produced even by motor imagery, not only by a real movement of a limb, [9-12].
The most known feature extraction methods implemented for discriminating the motor tasks are: the principal component analysis (PCA) [13-15] the independent component analysis (ICA) [16-18], the autoregressive spectral estimation [19], the fractal spectra [20], the phase synchronization [18, 21-23] and the wavelet transform [24-26].
The purpose of the research is to implement a method in order to extract and classify the features of the brain signals based on the amplitude modulation found in certain bands of the EEG rhythms in the case of a MI based BCI paradigm. An amplitude modulation energy index is proposed to construct the feature vector on which classification methods are applied using a publicly available database, as well as our own data.
The leftovers of this paper are structured as it follows: Section 2 presents the two databases handled in order to validate the method, the amplitude modulation analysis and how the amplitude modulation energy index is expressed. The results obtained are presented in Section 3 and the last one reviews the conclusions.
2.1 Databases
The first set of data contains the EEG recordings from 50 healthy volunteers performed in the Biomedical Signal Processing Laboratory of the Medical Bioengineering Faculty. The trials were operated on different days and all volunteers signed an informed consent form. They were seated in front of a PC monitor that displayed left or right arrows. They had to imagine the hand movement indicated by an arrow and when the screen was white the volunteer had to relax. The arrows appeared 30 times for left hand and 30 times for right hand imagination, in a random manner. Before trials, in order to avoid artifacts generation, the volunteer was advised not to move, to sallow, to move the eyes or to blink. The EEG acquisition system is a g.tec Guger Technologies based one [27]. The active electrodes were mounted at positions C3, Cz, C4, P3, Pz, P3, CP3, CP4, according to 10-20 International System of electrode placement. The mentioned channels are considered significant to highlight real or imagined motor activity [11, 28]. The sampling frequency was 256 Hz and the reference electrode were placed on the right ear.
The second set of data consists of EEG signals recorded from nine well trained subjects when they performed motor imagery tasks. It was made available by Dr. Allen Osman of the University of Pennsylvania at the 2002 BCI Competition [29]. The signals were acquired from 59 electrodes placed on the scalp in accordance with the International System 10-20 and sampled with a frequency of 100 Hz. The subjects had to imagine the left index finger movement or the right index finger movement when letter “L” or “R” appeared on the computer screen. The subjects had to relax when letter “N” was displayed. Each trial session consists of 45 motor imagery left hand movements and 45 motor imagery right hand movements. For signal processing purposes, only the same 8 channels (C3, Cz, C4, P3, Pz, P3, CP3, CP4) were selected.
2.2 Amplitude modulation analysis applied to EEG signals
Two motor imagery datasets were formed: one composed by the EEG signals acquired during right hand movement mental task and the second one by the EEG signals acquired during left hand movement mental task.
In order to obtain signals in 4 – 8 Hz, 8 – 12 Hz, 12 – 30 Hz, 30 – 60 Hz frequency bands, the EEG signal when the subject was accomplishing the right hand imagination task, denoted by $R \operatorname{sig}(n)$, where n represents the time, was band passed filtered. The mentioned frequency bands correspond to the well-known cerebral rhythms Delta, Theta, Alpha, Beta and Gamma respectively [30].
So, the filtered right signals EEG $R \operatorname{sig}(n)$ are defined by:
$R \operatorname{sig}_{i}(n)=\operatorname{Rsig}(n)^{*} h_{i}(n)$ (1)
where, hi(n) represents the impulse response of the bandpass filter for the corresponding frequency band (that is i=1 for Delta, i=2 for Theta, i=3 for Beta and i=4 for Gamma rhythms). R denotes Right direction.
The Hilbert transform $H\{ .\}$ of $R \operatorname{sig}_{i}(n)$ is defined as [22]:
$H\left\{R \operatorname{sig}_{i}(n)\right\}=\frac{1}{\pi} P V \int_{-\infty}^{+\infty} \frac{R \operatorname{sig}_{i}(n)}{t-\pi} d t$ (2)
where, PV , is the Cauchy principal value.
The analytic signal $\operatorname{Rsig}_{i}(n)_{a}$ is defined as:
$R \operatorname{sig}_{i}(n)_{a}=R \operatorname{sig}_{i}(n)+j H\left\{R \operatorname{sig}_{i}(n)\right\}$ (3)
where, $R \operatorname{sig}_{i}(n)$ and $H\left\{R \operatorname{sig}_{i}(n)\right\}$ are defined in $(1)$ and $(2)$ respectively.
The amplitude modulation, named $\operatorname{Ram}_{i}(n)$ (or the temporal envelope), for $R \operatorname{sig}_{i}(n)_{a}$ from $(3),$ is its absolute value:
$\operatorname{Ram}_{i}(n)=\sqrt{\operatorname{Rsig}_{i}(n)^{2}+H\left\{R \operatorname{sig}_{i}(n)\right\}^{2}}$ (4)
Then, in order to get the temporal envelope for the m-th frame, denoted by $\operatorname{Ram}_{i}(m, n), \operatorname{Ram}_{i}(n)$, expressed in (4), is multiplied by a 5 s Hamming window with 0.5 s overlap.
For each rhythm i, the modulus of the Fourier transform of the temporal envelope m is then computed:
$\operatorname{Ram}_{i}(m, f)=\left|F\left\{\operatorname{Ram}_{i}(m, n)\right\}\right|$ (5)
where, f is the frequency and $F\left\{\operatorname{Ram}_{i}(m, n)\right\}$ is the discrete Fourier transform of the m-th frame, $\operatorname{Ram}_{i}(m, n)$.
In order to measure the frequency content of the temporal envelope, $\operatorname{Ram}_{i}(m, f)$ was further decomposed into four frequency bands, hereafter named modulation bands [31]. It is worth preserving the same names for modulation bands as those of the rhythms. This is justified by the assertion that the frequency content of the envelope of the analytic signal can be up to the maximum frequency of the signal. Because modulation in the gamma band is possible only in the gamma rhythm, this modulation band was not taken into account. Therefore, there are thirteen options (Table 1) corresponding to four cerebral rhythms and four modulation bands. Table 1 depicts these cases.
Table 1. The modulation bands corresponding to different rhythms
|
Modulation band |
Rhythm |
|||
|
Theta |
Alpha |
Beta |
Gamma |
|
|
delta |
delta_theta |
delta_alpha |
delta_beta |
delta_gamma |
|
theta |
theta_theta |
theta_alpha |
alpha_beta |
theta_gamma |
|
alpha |
----------- |
alpha_alpha |
alpha_beta |
alpha_gamma |
|
beta |
----------- |
----------- |
beta_beta |
beta_gamma |
Then we compute the energy of each modulation j band corresponding to each rhythm i, denoted by $R E_{i, j}(m, f)$:
$R E_{i, j}(m, f)=\operatorname{Ram}_{i, j}(m, f)^{2}$ (6)
and the average of energies over all the frames, represented by $\overline{R E(m, f)_{i, j}}$.
Taking into account the energy defined in $(6)$ and $\overline{R E(m, f)_{i, j}},$ a new measure, named amplitude modulation energy index, $R A M E I_{i, j}(f)$, is proposed:
$R A M E I_{i, j}(f)=\frac{\overline{R E_{i, j}(m, f)}}{\sum_{j=1}^{K} \overline{R E_{i, j}(m, f)}}$ (7)
where, K may be 2, 3 or 4, related to the appropriate rhythm. For instance, for the theta rhythm K=2 because only Delta and Theta modulation bands are possible, but for Beta rhythm and Gamma rhythm K=4 as there are four modulation bands (delta, theta, alpha and beta). We have to mention that the denominator is a sum for one rhythm only, not for all the possible rhythms as the index in [30] is represented.
The steps described above for right hand movement imagery were followed by the trials corresponding to left hand movement imagery, leading to the amplitude modulation energy index for this case, named $L A M E I_{i, j}(f)$ (L designates Left).
2.3 The feature extraction and classification
To get the feature vector, $R A M E I_{i, j}(f)$ and $L A M E I_{i, j}(f)$ were computed (for each rhythm i and each possible amplitude modulation, that is 13 cases for each of the 8 channels).
Discrimination of motor tasks (right and left) was assessed with five classifiers: support vector machine (SVM) [32, 33], k-nearest neighbor (kNN) - k (1, 2, 3, 4 and 5) [34], linear discriminant analysis (LDA) [34, 35], quadratic discriminant analysis (QDA) [36] and Mahalanobis distance (MD) [37]. The fivefold cross validation approach was employed to carry out the classification tests. So, the data was randomly split into five sets, from which only one was used as the test set and the remaining four as train set. The procedure was repeated five times and finally, the average classification rate across all was computed to get the most accurate results.
Considering our database, after passband filtering of the EEG signals from all the 8 channels on the four rhythms, the Hilbert transforms and the envelopes of the analytic signals were obtained.
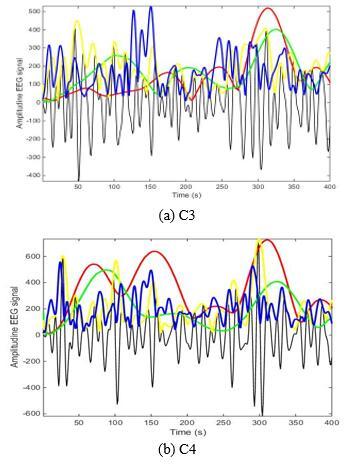
In Figure 1 the EEG beta rhythm recorded on C3 and C4 channel and delta, theta, alpha and beta amplitude modulations are plotted for right and left hand imagination for the TR17i subject.
The classification rates obtained for RA60i subject for all classifiers and for all possible amplitude modulations are displayed in Table 2. Classification rates higher than 87 % for all classifiers were obtained for rhythm Alpha with alpha modulation and for rhythm Beta with theta modulation.
Figure 1. The amplitude modulations of EEG beta rhythm on C3 and C4 for the TR17i subject, right hand imagination (black - EEG rhythm, red - delta, green - theta, yellow - alpha and blue - beta amplitude modulation)
Table 2. Classification rates (%) attained for subject RA60i for all classifiers and for all amplitude modulations
RA60i Subject
|
Modulation_rhythm |
LDA |
QDA |
MD |
kNN |
SVM |
||||
|
1 |
2 |
3 |
4 |
5 |
|||||
|
delta_theta |
64 |
73 |
72 |
87.69 |
87.96 |
88.04 |
88.19 |
88 |
51.5 |
|
theta_theta |
79 |
91.5 |
94 |
93.27 |
93.15 |
93.13 |
93.02 |
93 |
62 |
|
delta_alpha |
79 |
92.5 |
92.5 |
91.54 |
91.57 |
91.61 |
91.64 |
91.75 |
49 |
|
theta_alpha |
80.5 |
82.5 |
83 |
96.06 |
96.2 |
96.34 |
96.47 |
96.5 |
85 |
|
alpha_alpha |
100 |
100 |
100 |
100 |
100 |
100 |
100 |
100 |
99.5 |
|
delta_beta |
62.5 |
89 |
89 |
90.1 |
90.46 |
90.8 |
91.12 |
91.33 |
43.5 |
|
theta_beta |
87.5 |
92.5 |
90.5 |
95.87 |
96.02 |
95.98 |
96.12 |
96.17 |
98 |
|
alpha_beta |
69 |
75 |
73 |
91.15 |
91.48 |
91.61 |
91.81 |
91.67 |
95 |
|
beta_beta |
61 |
53.5 |
53 |
68.75 |
68.43 |
67.77 |
67.24 |
66.75 |
55 |
|
delta_gamma |
76 |
82.5 |
83 |
89.52 |
89.54 |
89.55 |
89.57 |
89.5 |
50.5 |
|
theta_gamma |
73 |
82 |
83 |
92.31 |
92.5 |
92.41 |
92.41 |
92.08 |
92.5 |
|
alpha_gamma |
61.5 |
88.5 |
87.5 |
94.52 |
94.72 |
94.64 |
94.74 |
94.67 |
91 |
|
beta_gamma |
52 |
54 |
58 |
59.9 |
59.91 |
60.18 |
60.34 |
60.33 |
57 |
For all the 50 subjects the attained classification rates are highest for alpha_alpha, theta_beta, alpha_beta, theta_gamma and alpha_gamma. We have chosen a threshold of 90 % for the classification rate which is a high one, according to the previous research. The number of the subjects who attained at least 90 % is included in Table 3 for the best cases already mentioned.
It is obvious that the kNN and SVM outperform LDA, QDA and MD classifiers. So, for kNN and SVM almost all of the 50 subjects attained at least 90 % rate of classification (marked with green in Table 3). Although the most common statistics handled to measure the center of a dataset is the mean, it may be not a good representation of the data because it is significantly influenced by outliers. A better choice is the median as it splits the data into equal sets of numbers. So, in what follows we present the outcomes when using this statistic.
In Table 4 there are included the medians of the classification rate for all the used classifiers, for the same types (combinations) of modulations and rhythms as in Table 3.
Table 3. The number of subjects with the classification rate equal or greater than 90 % (our database)
|
Classifiers |
Modulation_rhythm |
||||
|
alpha_alpha |
theta_beta |
alpha_beta |
theta_gamma |
alpha_gamma |
|
|
LDA |
26 |
8 |
5 |
9 |
6 |
|
QDA |
28 |
29 |
20 |
29 |
26 |
|
MD |
30 |
23 |
18 |
23 |
17 |
|
kNN1/3/4/5 |
49 |
48 |
47 |
48 |
46 |
|
kNN2 |
49 |
48 |
47 |
49 |
47 |
|
SVM |
47 |
46 |
48 |
48 |
47 |
Table 4. The medians of the classification rates (%) (our database)
|
Classifiers |
Modulation_rhythm |
||||
|
alpha_alpha |
theta_beta |
alpha_beta |
theta_gamma |
alpha_gamma |
|
|
LDA |
90.50 |
81.00 |
74.75 |
79.00 |
77.00 |
|
QDA |
92.00 |
90.75 |
88.75 |
90.25 |
91.00 |
|
MD |
91.25 |
89.25 |
88.25 |
89.25 |
87.75 |
|
kNN1 |
97.74 |
96.01 |
95.82 |
94.62 |
95.20 |
|
kNN2 |
97.69 |
96.11 |
95.88 |
94.82 |
95.28 |
|
kNN3 |
97.73 |
96.12 |
96.03 |
94.82 |
95.18 |
|
kNN4 |
97.76 |
96.17 |
96.08 |
94.87 |
95.35 |
|
kNN5 |
97.75 |
96.04 |
96.00 |
94.75 |
95.30 |
|
SVM |
97.75 |
96.04 |
96.00 |
94.75 |
95.30 |
The medians are very high (94.62 % - 97.76 %) for alpha and theta modulation bands of Alpha, Beta and Gamma rhythms, especially for kNN and SVM.
The same steps were performed for the second database (named Osman database in what follows). Unfortunately, it has only 9 subjects, but they are well trained compared with the subjects from our database who were not trained at all.
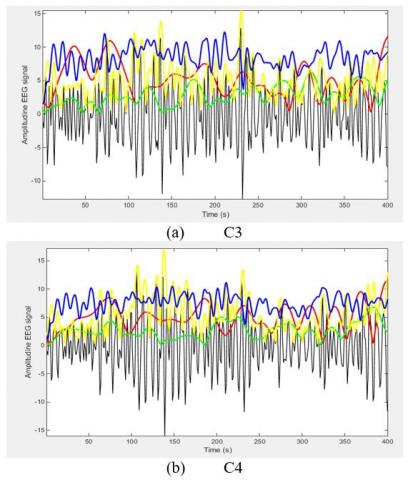
In Figure 2 the EEG beta rhythm recorded on C3 and C4 channel and the delta, theta, alpha, beta amplitude modulations are plotted for right hand imagination for subject 9.
In Table 5 are presented the classification rates obtained
for subject 1 for all classifiers and for all possible amplitude modulations bands.
The best classification rates, higher than 85 %, for all classifiers were obtained for Alpha rhythm with alpha modulation and Beta rhythm with theta modulation.
It is important to mention that the best results were achieved on the same modulation bands of the same rhythms as in the previous reported cases.
In Table 6 are included the modulations of different rhythms where the number of subjects who have classification rate between the imagination of right hand and the imagination of left hand greater or equal with 90 %.
For theta_beta, all the 9 subjects get more than 90 % for classification rate when KNN or SVM classifier is used. For alpha_gamma, 6 subjects when KNN classifier is handled and only 3 in the case of SVM. Except the modulation in alpha band of alpha rhythm, all the other possibilities lead to the worst performances when LDA, QDA or MD is performed.
Figure 2. The amplitude modulations of EEG beta rhythm on C3 and C4 for subject 9, right hand imagination (black - EEG rhythm, red - delta, green - theta, yellow - alpha and blue - beta amplitude modulation)
Table 5. Classification rates (%) obtained for subject 1 (Osman database)
|
Subject 1 |
|||||||||
|
Modulation_rhythm |
LDA |
QDA |
MD |
kNN |
SVM |
||||
|
1 |
2 |
3 |
4 |
5 |
|||||
|
delta_theta |
81 |
82.5 |
83 |
90.38 |
90.46 |
90.54 |
90.6 |
90.5 |
58.5 |
|
theta_theta |
76 |
64.5 |
71.5 |
84.81 |
85.19 |
85.18 |
85.17 |
85 |
50 |
|
delta_alpha |
76 |
65 |
74.5 |
85 |
85.28 |
85.63 |
85.86 |
85.92 |
50.5 |
|
theta_alpha |
79 |
71.5 |
80.5 |
93.85 |
94.07 |
94.2 |
94.31 |
94.17 |
77.5 |
|
alpha_alpha |
97 |
96.5 |
96 |
98.85 |
98.8 |
98.75 |
98.71 |
98.75 |
99 |
|
delta_beta |
78 |
88.5 |
90.5 |
92.02 |
91.76 |
91.34 |
91.12 |
90.67 |
51 |
|
theta_beta |
85.5 |
90 |
90 |
95.58 |
95.74 |
95.71 |
95.86 |
95.5 |
94 |
|
alpha_beta |
72.5 |
84.5 |
83 |
94.42 |
94.63 |
94.55 |
94.57 |
94.42 |
90.5 |
|
beta_beta |
60.5 |
52 |
55 |
68.08 |
67.41 |
67.41 |
67.16 |
67.08 |
51.5 |
|
delta_gamma |
96 |
99 |
98.5 |
90.19 |
90.09 |
90.09 |
90 |
89.92 |
60.5 |
|
theta_gamma |
79 |
93 |
93 |
93.75 |
93.89 |
94.02 |
94.14 |
94.08 |
90.5 |
|
alpha_gamma |
76 |
90.5 |
88.5 |
89.52 |
89.63 |
89.64 |
89.83 |
89.92 |
76.5 |
|
beta_gamma |
66 |
57.5 |
57 |
64.23 |
64.54 |
64.82 |
65.09 |
65.58 |
54 |
Table 6. The number of subjects with the classification rate equal or greater than 90 % (Osman database)
|
Classifiers |
Modulation_rhythm |
||||
|
alpha_alpha |
theta_beta |
alpha_beta |
theta_gamma |
alpha_gamma |
|
|
LDA |
6 |
0 |
0 |
1 |
1 |
|
QDA |
8 |
3 |
4 |
5 |
4 |
|
MD |
6 |
3 |
2 |
5 |
3 |
|
kNN1/5 |
8 |
9 |
9 |
7 |
6 |
|
kNN2/3/4 |
8 |
9 |
9 |
8 |
6 |
|
SVM |
8 |
9 |
8 |
5 |
3 |
The medians for the classification rates of all the 9 subjects are included in Table 7.
Table 7. The medians of the classification rates (%) (Osman database)
|
Classifiers |
Modulation_rhythm |
||||
|
alpha_alpha |
theta_beta |
alpha_beta |
theta_gamma |
alpha_gamma |
|
|
LDA |
94 |
84 |
77.50 |
76 |
71.50 |
|
QDA |
93 |
88 |
84.50 |
90 |
87.50 |
|
MD |
94 |
88.50 |
84 |
91.50 |
88.50 |
|
kNN1 |
96.06 |
95.19 |
94.81 |
93.75 |
90.19 |
|
kNN2 |
96.2 |
95.37 |
94.91 |
93.89 |
90.37 |
|
kNN3 |
96.34 |
95.36 |
94.82 |
94.02 |
90.63 |
|
kNN4 |
96.47 |
95.43 |
94.91 |
94.14 |
90.86 |
|
kNN5 |
96.42 |
95.42 |
95 |
94.08 |
91.08 |
|
SVM |
95.50 |
94 |
91.50 |
90.50 |
78.50 |
As expected, for all the cases, the higher median values of the classification rates are found when applying kNN or SVM classifiers, as evidenced in Table 7. Only for alpha_alpha, LDA, QDA and MD have high medians of the classification rates (about 93 %).
The proposed method, tested on two databases, shows that when a person performs a motor task, such as imagination of the right or left hand movement, this determines a modulation of electrophysiological brain activity in specific bands.
A new index, labeled amplitude modulation energy index, was developed and used to generate the feature vector, computed for the two classes (left and right) considered for investigation. The performance was reported by means of the classification rate obtained when LDA, QDA, MD, kNN and SVM classifier were employed.
The classification rates greater than 90 % were attained for our own database of 50 subjects, when gamma, alpha or beta rhythms are modulated in theta (4-8 Hz) and alpha (8-12 Hz) bands. The medians of the classification rates are very high (94.62 % - 97.76 %) especially for kNN and SVM. It was shown that it can achieve significantly higher classification rates (with medians greater than 94 % in many situations) relative to classifiers trained on the other feature - based amplitude modulation index proposed in [38] (when the medians were no greater than 70 %).
For the Osman database, our outcomes are compared with the reported results in [39-41]. In [39], where a new adaptive time–frequency feature extraction strategy is investigated, for subject 1, classification rates in the range of 74.2 – 81.1 % with LDA classifier were achieved. Using multiple frequency-spatial synthesized features and SVM classifier in [40], a classification rate of 67.80% was obtained for subject 1. In [41], a dynamical ensemble learning framework is mentioned with model-friendly classifiers (SVM, kNN and LDA) for domain adaptation and for which subject 1 achieved classification rates of 67.89 %, 68.25 % and 70.22 % respectively. Applying our method, subject 1 changed the following discrimination rates for alpha modulation of Alpha rhythm: LDA – 97 %, QDA – 96.5 %, MD – 96 %, kNN (1, 2, 3, 4, 5 neighbors) - 98.85 %, 98.80 %, 98.71 %, 98.75 %, 98.83 respectively and SVM – 99 % (Table 5). Taking into account all these results, it is obvious that our method outperforms the others named in [39-41].
We may conclude that the newly developed metric of the temporal envelope, the amplitude modulation energy index, would be a valuable feature in order to classify motor tasks such as movement imagination of right /left hand.
The future work implies improving classification rates by testing combinations of classifiers and applying the method on other databases (both of health subjects and patients). Therefore, additionally, a new database of EEG signals recorded from patients with neuromotor disorders has to be created.
An everyday challenge is to get high performances using limited data, so using less than 8 EEG channels must be considered for the processing steps.
[1] McFarland, D.J., Wolpaw, J.R. (2017). EEG-based brain–computer interfaces. Current Opinion in Biomedical Engineering, 4: 194-200. https://doi.org/10.1016/j.cobme.2017.11.004
[2] Hintermüller, G., Kapeller, C., Edlinger, G., Guger, C. (2013). BCI integration: Application interfaces. In Brain-Computer Interface Systems – Recent Progress and Future Prospects, Fazel-Rezai, R., InTech, pp. 21-41. http://dx.doi.org/10.5772/55806
[3] Rad, S.M., Nejad, M.B. (2019). New analog processing technique in multichannel neural signal recording with reduce data rate and reduce power consumption. Traitement du Signal, 36(2): 133-137. https://doi.org/10.18280/ts.360202
[4] Neuper, C., Scherer, R., Reiner, M., Pfurtscheller, G. (2005). Imagery of motor actions: Differential effects of kinesthetic and visual-motor mode of imagery in single-trial EEG. Cogn. Brain. Res., 25: 668-677. https://doi.org/10.1016/j.cogbrainres.2005.08.014
[5] Fira, M., Goras, L. (2012). A new method for EEG compressive sensing. AECE. 1: 4(12). https://doi.org/10.4316/AECE.2012.04011
[6] Liu, Y.H., Wang, S.H., Hu, M.R. (2016). A self-paced P300 healthcare brain-computer interface system with SSVEP-based switching control and kernel FDA+ SVM-based detector. Applied Sciences, 6(5): 142. https://doi.org/10.3390/app6050142
[7] Allison, B.Z., Wolpow, E.W., Wolpaw, J.R. (2007) Brain–computer interface systems: progress and prospects. Expert Rev. Med. Devices., 4: 463-474. https://doi.org/10.1586/17434440.4.4.463
[8] Amiri, S., Rabbi, A., Azinfar, L., Fazel-Rezai, R. A. (2013). Review of P300, SSVEP, and hybrid P300/SSVEP brain-computer interface systems. In Brain-Computer Interface Systems – Recent Progress and Future Prospects, Fazel-Rezai, R., InTech, pp. 195-213. https://doi.org/10.5772/56135
[9] Pfurtscheller, G., Lopes da Silva, F.H. (1999). Event-related EEG/MEG synchronization and desynchronization: Basic principles. Journal of Clinical Neurophysiology, 110: 1842-1857. https://doi.org/10.1016/S1388-2457(99)00141-8
[10] Neuper, C., Pfurtscheller, G. (1998). ERD/ERS based brain computer interface (BCI): Effects of motor imagery on sensorimotor rhythms. International Journal of Psychophysiology, 1(30): 53-54. https://doi.org/10.1016/S0167-8760(98)90134-9
[11] Pfurtscheller, G., Brunner, C., Schlögl, A., Da Silva, F.L. (2006). Mu rhythm (de) synchronization and EEG single-trial classification of different motor imagery tasks. NeuroImage, 31(1): 153-159.
https://doi.org/10.1016/j.neuroimage.2005.12.003
[12] Pfurtscheller, G., Berghold, A. (1989). Patterns of cortical activation during planning of voluntary movement. Electroencephalography and clinical neurophysiology, 72(3): 250-258. https://doi.org/10.1016/0013-4694(89)90250-2
[13]Kottaimalai, R., Rajasekaran, M.P., Selvam, V., Kannapiran, B. (2013). EEG signal classification using principal component analysis with neural network in brain computer interface applications. In Emerging Trends in Computing, Communication and Nanotechnology, pp. 227-231. https://doi.org/10.1109/ICE-CCN.2013.6528498
[14]Rejer, I. (2012). EEG feature selection for BCI based on motor imaginary task. Foundations of Computing and Decision Sciences, 37(4): 283-292. https://doi.org/10.2478/v10209-011-0016-7
[15] Yu, X., Park, S.M., Ko, K.E., Sim, K.B. (2013). Discriminative power feature selection method for motor imagery EEG classification in brain computer interface systems. International Journal of Fuzzy Logic and Intelligent Systems, 13(1): 12-18. https://doi.org/10.5391/IJFIS.2013.13.1.12
[16]Qi, H., Zhu, Y., Ming, D., Wan, B. (2009). Independent component analysis using clustering on motor imagery EEG. EMBC, 4735-4738. https://doi.org/10.1109/IEMBS.2009.5334189
[17]Kachenoura, A., Albera, L., Senhadji, L., Comon, P. (2008). ICA: A potential tool for BCI systems. IEEE Signal Processing Magazine, 25(1): 57-68. https://doi.org/10.1109/MSP.2008.4408442
[18]Qureshi, M.N.I., Cho, D., Lee, B. (2017). EEG classification for motor imagery BCI using phase-only features extracted by independent component analysis. EMBC, 2097-2100. https://doi.org/10.1109/EMBC.2017.8037267
[19]McFarland, D.J., Wolpaw, J.R. (2008). Sensorimotor rhythm-based brain–computer interface (BCI): model order selection for autoregressive spectral analysis. Journal of Neural Engineering, 5(2): 155-62. https://doi.org/10.1088/1741-2560/5/2/006
[20] Finotello, F., Scarpa, F., Zanon, M. (2015). EEG signal features extraction based on fractal dimension. Conf Proc IEEE Eng. Med Biol Soc., pp. 4154-4157. https://doi.org/10.1109/EMBC.2015.7319309
[21] Caramia, N., Lotte, F., Ramat, S. (2014). Optimizing spatial filter pairs for EEG classification based on phase synchronization. International Conference on Audio, Speech and Signal Processing. https://doi.org/10.1109/ICASSP.2014.6853959
[22] Gysels, E., Celka, P. (2004). Phase synchronization for the recognition of mental tasks in a brain-computer interface. IEEE Transactions on Neural Systems and Rehabilitation Engineering, 12(4): 406-415. https://doi.org/10.1109/TNSRE.2004.838443
[23] Loboda, A., Margineanu, A., Rotariu, G., Lazar, A.M. (2014). Discrimination of EEG-based motor imagery tasks by means of a simple phase information method. IJARAI. 3(10). http://dx.doi.org/10.14569/IJARAI.2014.031002
[24] Alomari, M.H., Awada, E.A., Samaha, A., Alkamha, K. (2014). Wavelet-based feature extraction for the analysis of EEG signals associated with imagined fists and feet movements. Computer and Information Science, 7(2): 17. https://doi.org/10.5539/cis.v7n2p17
[25] Xu, B., Song, A. (2008). Pattern recognition of motor imagery EEG using wavelet transform. Journal of Biomedical Science and Engineering, 1(01): 64.
[26] Li, M.A., Zhu, W., Liu, H.N., Yang, J.F. (2017). Adaptive feature extraction of motor imagery EEG with optimal wavelet packets and SE-isomap. Applied Sciences, 7(4): 390. https://doi.org/10.3390/app7040390
[27] www.gtec.at (accessed on 1.09.2018).
[28] McFarland, D.J., Miner, L.A., Vaughan, T.M., Wolpaw, J.R. (2000). Mu and beta rhythm topographies during motor imagery and actual movements. Brain topography, 12(3): 177-186.
[29] Osman, A., Robert, A. (2001). Time-course of cortical activation during overt and imagined movements. Proc. Cognitive Neuroscience Annu. Meet. New York, 1: 1842-1852.
[30] Fraga, F.J., Falk, T.H., Kanda, P.A., Anghinah, R. (2013). Characterizing Alzheimer’s disease severity via resting-awake EEG amplitude modulation analysis. PLoS One, 8(8): e72240. https://doi.org/10.1371/journal.pone.0072240
[31] Fraga, F.J., Falk, T.H., Trambaiolli, L.R., Oliveira, E.F., Pinaya, W.H., Kanda, P.A., Anghinah, R. (2013). Towards an EEG-based biomarker for Alzheimer's disease: Improving amplitude modulation analysis features. ICASSP, 1207-1211. https://doi.org/10.1109/ICASSP.2013.6637842
[32] Lee, F., Scherer, R., Leeb, R., Neuper, C., Bischof, H., Pfurtscheller, G. (2005). A comparative analysis of multi-class EEG classification for brain computer interface. In Proceedings of the 10th Computer Vision Winter Workshop, pp. 195-204.
[33] Martisius, I., Damasevicius, R., Jusas, V., Birvinskas, D. (2012). Using Higher Order Nonlinear Operators for SVM Classification of EEG Data. Elektronika Ir Elektrotechnika, 119(3): 99-102. http://dx.doi.org/10.5755/j01.eee.119.3.1373
[34] Lotte, F., Bougrain, L., Cichocki, A., Clerc, M., Congedo, M., Rakotomamonjy, A., Yger, F. (2018). A review of classification algorithms for EEG-based brain–computer interfaces: A 10 year update. Journal of Neural Engineering, 15(3): 031005. https://doi.org/10.1088/1741-2552/aab2f2
[35] Resalat, S.N., Saba, V. (2016). A Study of Various Feature Extraction Methods on a Motor Imagery Based Brain Computer Interface System, Basic Clin Neurosci., 7(1): 13-19.
[36] Barreto, G.A., Frota, R.A., de Medeiros, F.N. (2004). On the classification of mental tasks: A performance comparison of neural and statistical approaches. In Machine Learning for Signal Processing, Proceedings of the 14th IEEE Signal Processing Society Workshop, pp. 529-538. https://doi.org/10.1109/MLSP.2004.1423016
[37] Babiloni, F., Bianchi, L., Semeraro, F., del R Millan, J., Mourino, J., Cattini, A., Salinari, S., Marciani, M.G., Cincotti, F. (2001). Mahalanobis distance-based classifiers are able to recognize EEG patterns by using few EEG electrodes. Engineering in Medicine and Biology Society, Proceedings of the 23rd Annual International Conference of the IEEE, 1. https://doi.org/10.1109/IEMBS.2001.1019019
[38] Eva, O.D., Lazar, A.M. (2018). An Amplitude Modulation of Cerebral Rhythms based Method in a Motor Task BCI Paradigm. IJACSA, 9(9): 26-31. https://doi.org/10.14569/IJACSA.2018.090904
[39] Ince, N.F., Tewfik, A.H., Arica, S. (2007). Extraction subject-specific motor imagery time–frequency patterns for single trial EEG classification. Computers in Biology and Medicine, 37(4): 499-508. https://doi.org/10.1016/j.compbiomed.2006.08.014
[40] Shan, H., Xu, H., Zhu, S., He, B. (2015). A novel channel selection method for optimal classification in different motor imagery BCI paradigms. Biomedical Engineering Online, 14(1): 93. https://doi.org/10.1186/s12938-015-0087-4
[41] Tu W., Sun S. (2012). Dynamical ensemble learning with model-friendly classifiers for domain adaptation. Proceedings of the 21st International Conference on Pattern Recognition (ICPR), pp. 1181-1184.