Abd El Mouméne Zerari*![]() | Hathem Khelil
| Hathem Khelil![]() | Leila Djerou
| Leila Djerou![]() | Mohamed Chaouki Babahenini
| Mohamed Chaouki Babahenini![]()
© 2024 The authors. This article is published by IIETA and is licensed under the CC BY 4.0 license (http://creativecommons.org/licenses/by/4.0/).
OPEN ACCESS
Digital pathology involves the conversion of histology slides into digital format to generate high-resolution images. Tissue classification, particularly for identifying common types of non-Hodgkin lymphomas like mantle cell lymphoma, follicular lymphoma, and chronic lymphocytic leukemia, is a crucial application of this technology. Due to the complexity of these lymphomas, pathologists often encounter challenges in their diagnosis. However, the limited availability of image data in the dataset poses a significant challenge. To solve this issue, we present a new technique for augmenting the dataset and enabling more efficient model training. In this article, we propose a technique capable of approaching lymphoma images. Our idea is to generate lymphoma images by adding a segmented image. The reference images are taken from the available dataset. We use two re neural networks. The first neural network is image-to-image translation, a technique used to transform the appearance or style of images, particularly adversarial neural networks, facilitates this process by using inputs from the source domain to produce images that closely match the target domain. The second neural network, we use an improved convolutional neural network (CNN) algorithm for classifying non-Hodgkin lymphomas. Trained on this augmented dataset, the proposed model achieves a classification accuracy of 99.91%. This precision is higher than that reported by Khelil et al. in their study. Moreover, we acknowledge the ethical implications of generating synthetic medical images and propose guidelines for ensuring the ethical conduct of our proposed technique.
digital pathology, conditional generative adversarial networks, convolutional neural network, classification, image-to-image translation
The field of digital pathology pertains to the collection, organization, dissemination, and interpretation of pathology data and slides within a digital environment. Glass slides are scanned with a scanning apparatus to create digital slides, which are high-resolution digital pictures that may be seen on computer screens or mobile devices. With the introduction of digital scanners that can generate virtual slides, the area of digital pathology (DP) has arisen as a critical avenue in diagnostic medicine [1]. This revolutionary technology provides high-resolution images of histology slides, allowing for more accurate, faster, and cost-effective cancer diagnosis, prognosis, and prediction [2]. One of the most notable benefits of DP is its capacity to enable computer-aided diagnostics (CAD), which combines imaging data with disease variables to help pathologists make better clinical decisions [3].
The application of CAD (computer-aided diagnosis) technologies has showed promise in speeding up the evaluation and classification of histopathology pictures by lesion grade or type [4]. These technologies use machine learning and artificial intelligence algorithms to help pathologists make accurate diagnosis. One significant way that CAD improves histopathology image processing is by automating repetitive processes and identifying regions of interest, which reduces diagnosis time and increases efficiency. This is particularly crucial when it comes to early cancer detection and treatment, because prompt action is critical in halting or regulating the spread and advancement of malignant cells [5].
Non-Hodgkin lymphoma (NHL) is a serious problem in oncology, with rapid evolution and several subtypes complicating correct diagnosis and therapy [6]. NHL, which accounts for a significant number of cancer cases and fatalities worldwide, is made up of several subtypes, including Chronic Lymphocytic Leukemia (CLL), Mantle Cell Lymphoma (MCL), and Follicle Cell Lymphoma (FL) [7]. Distinguishing between these subtypes has traditionally relied on pathologists' expertise When examining tissue samples stained with Hematoxylin-Eosin (H&E), a difficult task due to overlapping histopathological characteristics and the requirement for comprehensive morphological examination [8]. While deep learning (DL) algorithms have proven potential for improving pathology diagnosis [7], their performance is strongly dependent on the availability and quality of training datasets [8].
In recent years, machine learning approaches, notably deep learning (DL), have demonstrated promise in improving pathology diagnosis via computer-aided diagnostic systems [9]. While research classifying lymphoma subtypes using deep learning have yielded promising results [10], the accuracy and computational efficiency of such systems are dependent on optimising deep learning algorithms, this entail carefully setting network setups and parameters and creating training datasets [11].
To ensure the proper functioning of the classifier and ensure the accuracy of the classification, a large dataset is essential. A large number of images allows the model to capture a variety of features and patterns, thus promoting better generalization and greater robustness.
To overcome the issue of poor image availability in datasets, novel techniques such as Image-to-image translation (called Pix2Pix) have evolved [12]. Pix2Pix are a type of Conditional Generative Adversarial Networks [13] (CGANs) used in machine learning. They are a type of Generative Adversarial Network in which the generator network is limited by extra information, such as labels or attributes. This conditioning enables CGANs to generate outputs with certain qualities or properties.
Pix2Pixoffer a fresh solution by generating additional images, thereby enhancing the size and diversity of datasets. In this article, we integrate Pix2Pixinto the synthetic framework of non-Hodgkin's lymphoma images to improve the dataset.
Specifically, our main contributions include: suggests an optimisation of the Convolutional Neural Network (CNN) algorithm for properly classifying NHL subtypes (CLL, FL, and MCL). The study enhances computer-aided diagnosis for improved cancer management by leveraging recent advances in deep learning and integrating images generated by Pix2Pixinto the dataset.
When using Pix2pix to generate synthetic images for medical diagnosis, ethical concerns arise. Despite applying validation metrics like as RMSE and SSIM, biases and errors might still occur, potentially leading to incorrect diagnoses or treatment plans. To reduce risks and maintain patient safety, rigorous validation against real-world data is critical.
In Section 2, we examine the current literature to contextualize our approach. Section 3 provides a comprehensive assessment of approaches that are closely related to the subject of our work. Following that, Section 4 carefully explains the complexities of our novel technique. Moving on to Section 6, we methodically provide the results and rigorously validate the efficacy of our proposed method. Our voyage concludes in a brief conclusion in the final section, which summarizes major results and offers insights into potential future directions.
Medical imaging applications of deep learning are relatively new. Around 2012, neural networks started to outperform conventional computer vision techniques. This was a turning point, as evidenced by the ImageNet Large Scale Visual Recognition Challenge [14]. Subsequently, there has been an exponential growth in research on deep learning for medical imaging [15], with ongoing attempts being made to create faster, deeper, and more effective networks.
Researchers have recently introduced a range of deep learning-based techniques using deep neural networks to automatically classify Non-Hodgkin lymphoma (NHL). In their work, Janowczyk and Madabhushi [10] applied the AlexNet network for various Pathological Diagnosis (PD) tasks, including the classification of lymphoma subtypes. Another notable contribution is the proposal of a Semantic Histopathological Slide Segmentation Model named EU-Net, which is presented in the study [11] for classifying Cutaneous Lymphoma and Eczema. In the domain of lymph node analysis, Syrykh et al. [16] propose a Bayesian neural network (BNN) to automatically differentiate between follicular hyperplasia (FL) and benign follicular hyperplasia (FH) using whole-slide images. Furthermore, the authors [17] utilized the Inception-V3 network design to classify NHL, squamous cell carcinoma, and other pathological images. Extending the applications, Steinbuss et al. [18] employed an EfficientNet convolutional neural network to classify various lymph node conditions, including tumor-free reference lymph nodes, nodal diffuse large B-cell lymphoma, and nodal small lymphocytic lymphoma/chronic lymphocytic leukemia. Hematoxylin and Eosin-stained histology images for breast cancer and lymphoma are automatically analyzed using the FusionNet architecture by Tambe et al [19]. Various convolutional neural network designs, such as VGGNet and GoogLeNet, were proposed by Brousset et al. [20] to differentiate between DLBCL and LF. Soltane et al. [21] classified seven lymphoma subtypes (NHL and HL) using a transfer learning technique using RestNet50 as a pre-trained model.
There have been numerous attempts at deep learning network designs in order to achieve the best features and accuracy in NHL multi-classification in CLL, FL, and MCL. Zhang et al. [22] classified CLL, FL, and MCL lymphomas with a 98.63% accuracy rate using the ResNet-50 network model. A lymphoma subtype categorization based on the Initiation V3 network was described by Tambe et al. [19], yielding a 97.33% accuracy rate. Ganguly and colleagues employed a pretrained Resnet50 model [23] to classify NHL subtypes with a 98.13% accuracy rate. FusionNet, a residual convolutional autoencoder, was used by Brancati et al. [24] with a 96.67% accuracy rate to classify lymphomas in MCL, FL, and CLL.
Janowczyk and Madabhushi [10] achieved a 96.58% accuracy rate for NHL subtype classification using the AlexNet Network.
Khelil and Djerou [25] propose an approach regarding digital pathology. The authors describe using an improved CNN algorithm along with deep learning approaches to develop a model for classifying non-Hodgkin lymphomas. This model outperformed existing deep learning-based methods for this challenge, with a classification accuracy of 98.7% after training on a curated dataset.
While these researches have shown promise in classifying MCL, FL, and CLL lymphoma using deep learning approaches, there is still a need for pre-processing of the training dataset and a suitable network configuration in order to achieve higher classification accuracy.
The use of deep learning in recent years, particularly neural networks of diverse architectures, has seen exponential growth, offering solutions to various problems including domain transformation. In the deep learning field, domain transfer—which is defined as the process of moving data from one domain to another by finding commonalities and creating connections between them—has attracted a lot of interest [26]. This approach proves instrumental in addressing challenges such as image/scene discrepancies during both training and practical application, allowing for the modification of specific data features while preserving others [27].
Conditional Generative Adversarial Networks (CGANs) have emerged as a pivotal advancement in domain transfer, significantly enhancing the effectiveness of this process [28]. By introducing conditional variables, CGANs enable greater control over the behavior of the generative network, ensuring outputs adhere to user-specified distributions and exhibit enhanced stability [29]. Despite this control, CGANs maintain diversity in generated results, contributing to their widespread adoption across various domains and problem-solving contexts [30].
The introduction of conditional variables represents a significant departure [13]. This innovation addresses a critical limitation of GANs, namely, the inability to control output, thereby enhancing the practicality and applicability of generative models [31]. CGANs have since been subject to extensive research and refinement, with numerous studies exploring enhancements and adaptations tailored to specific application scenarios [32-34].
Despite the proliferation of research on GANs and CGANs, there remains a notable gap in comprehensive surveys focusing specifically on the subject of domain transfer CGANs. While existing literature provides valuable insights into the models and applications of GANs, there is a need for more targeted investigations into the unique challenges and opportunities presented by CGANs in domain transfer contexts [13]. In order to close this gap, this work provides an extensive analysis of CGANs, discussing key research findings, and identifying ongoing challenges and avenues for future exploration. Through this endeavor, we hope to stimulate further research and innovation in the field of CGANs and domain transfer.
The first comprehensive framework for conditional GANs-based image-to-image translation was presented by Isola et al. [12], then Wang et al. [35] developed it to produce high-resolution images. Recently, research have sought to teach visual translation without supervision.
This approach aims to optimize the CNN method by leveraging deep learning principles for precise detection of MCL, CLL, and FL NHL subtypes from whole slideimages. Furthermore, the dataset will be augmented through the utilization of conditional generative adversarial networks. Enhancing the accuracy of tumor identification while maintaining the integrity and dependability of the findings is the main goal of this technology.
3.1 Generative adversarial network
In 2014, Mirza and Osindero [13] and colleagues proposed generative adversarial networks, or GANs. These neural networks show off their ability to produce realistic images from random noise by competing with one another. The generator makes synthetic data, while the discriminator tries to separate created data from real data. Numerous advancements in the production of realistic images and data have been made possible by this method. Numerous GAN variants have been created. Radford et al. [36] introduced DCGANs in 2016, which increased the quality and stability of the generated images. Arjovsky et al. [37] introduced WGANs in 2017, a novel loss function designed to enhance the convergence of GANs. By adjusting the style and attributes of the photos, Karras et al.'s 2018 [38] development StyleGANs allowed for the generation of even more realistic images. Since then, GANs have developed further, becoming a strong and adaptable instrument in numerous computer vision and machine learning domains.
Generative neural networks, particularly generative adversarial networks, have been widely used in image processing [13]. The discriminator and generator are the two key components of this architecture. The objective of the generator is to produce samples that closely resemble authentic data, while the discriminator's role is to differentiate between genuine samples and those that are artificially generated. To be more precise, the generator creates data samples, such pictures, from noise, which is usually taken from a latent probability distribution. Conversely, the discriminator, which is often implemented as a convolutional neural network based classifier, receives both synthetic samples generated by the generator and actual samples from the dataset. Its job is to determine whether these samples are phony or authentic. As training progresses, the discriminator aims to increase classification accuracy, The generator seeks to generate more realistic samples. This dynamic is captured in the GAN's cost function:
$\begin{gathered}\min _G \max _D V(D, G)=E_{x \sim P_{\text {Data }(x)}}[\log D(x)] \\ \left.+E_{Z \sim P_{Z(Z)}}[\log (1-G(Z)))\right]\end{gathered}$ (1)
The networks that D and G represent are the discriminator and generator respectively, x is the input data, while z is a latent space.
GANs in medical imaging help with disease identification, treatment planning, data augmentation, and picture production. They help video game developers generate procedural content, build immersive environments, and enhance non-player character behavior. GANs are used in the film and visual effects industries for producing virtual sets, character designs, enhanced special effects, and face animation.
3.2 Image-to-image translation
Image-to-image translation [12], the process of converting one image into another while preserving some visual aspects of the source. For this method to understand complex correlations between input and output images, it uses sophisticated machine learning techniques such as GANs, conditional adversarial networks, and convolutional neural networks.
Pix2Pix is a special type of CGAN designed for generating images by performing image-to-image translation.
To make sure that the outputs cannot be discriminated from "real" images, pix2pix uses adversarial training loss LcGAN in addition to the pixelwise regression loss L1 between the translated image and the ground truth. The aim is:
$L=\min$$G$$\max$$D$$L_{c G A N}(G, D)+\lambda L_{L_1}(G)$ (2)
In this paper, we provide a novel technique to diagnosing non-Hodgkin's lymphoma that employs two neural networks. To begin, we use a conditional generative adversarial network (cGAN) to create synthetic images of histology slides and thereby augmenting the dataset. Second, we use a CNN to precisely classify NHL subtypes (CLL, FL, and MCL).
4.1 Description of the proposed system
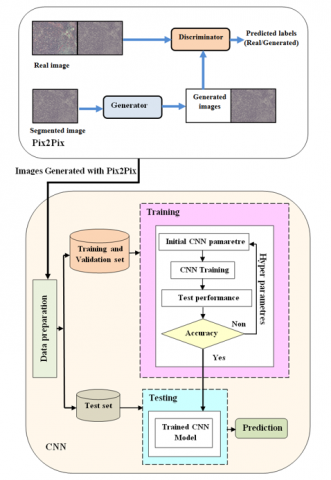
This section details our technique, with our primary objective being the reproduction of authentic high-resolution images of histological slides for the diagnosis of non-Hodgkin lymphoma. In Figure 1, we illustrate the architecture of our approach.
Our approach begins with getting the dataset, which is then augmented with extra data via Pix2Pix. The data is then pre-processed before being put into the CNN. The preprocessed dataset is then divided into three steps: data collection, preprocessing, and dataset splitting.
Figure 1. Diagram depicting the conceptual framework of the proposed system
4.2 Image-to-image translation description
In this section, we detail the specific process of the Image-to-image translation neural network as illustrated in Figure 1. Here is an overview of the steps:
This process incorporates semantic segmentation information into the image-to-image translation pipeline, potentially improving the quality and semantic consistency of the generated images.
4.3 Dataset description
The National Intelligence Authority (NIA) vetted the dataset for the identification of three forms of lymphomas: mantle cell lymphoma (MCL), follicular lymphoma (FL), and chronic lymphocytic leukemia (CLL) [40]. With a resolution of 1388 × 1040 pixels, it consists of 374 photos in total. In particular, there are 139 photos for follicular lymphoma, 122 images for mantle cell lymphoma, and 113 images for chronic lymphocytic leukemia (see Table 1).
Table 1. Dataset description
|
Lymphoma |
CLL |
FL |
MCL |
|
Before |
113 |
139 |
122 |
|
After |
226 |
278 |
244 |
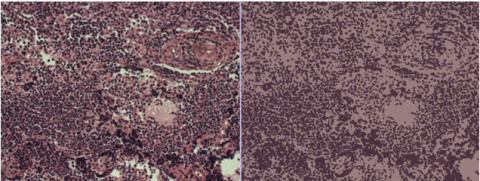
Figure 2. The input of the discriminator, left: real image, right: segmented image
We use the Pix2pix neural network to augment this dataset, as explained in section 4.2We begin by segmenting all of the images in the dataset using semantic segmentation [37]. These images will subsequently be treated as entering the generator. We next concatenate each genuine image with its segmented equivalent, as illustrated in Figure 2. Next, we concatenate each image generated by the generator with its segmented counterpart. These photos will subsequently be used as a secondary input to the network's discriminator. All the images produced will be added to the initial dataset, then the latter will be sent for data preparation.
4.4 Preprocessing
Before inputting data into the CNN, the initial phase is Data Preparation, consisting of three key components: Data Collection, Preprocessing, and Dataset Splitting.
The data is prepared using two preprocessing steps: normalization and patch extraction. Rescaling is a simple normalization technique [10] that modifies image pixel values to fall within the range [0,1]. The consistency of various components within a data structure is enhanced by the use of data normalization. The first stage in this method is to eliminate any duplicate entries from the dataset. Once this is done, the focus turns to logically structuring the data. Dataset normalization is essential because the range of data values can impact how effective neural networks are. We use the MAX-MIN scaling technique in our strategy, which is represented by the following equation:
$F\left(x_i\right)=\frac{x_i-\operatorname{moin}(x)}{\max (x)-\min (x)}$ (3)
The process of extracting patches from a dataset entails splitting each image into smaller patches and assigning each patch to the appropriate class. The learning dataset is enhanced by this procedure [41]. In this particular case, each normalized image is divided into 64×64 patches that overlap by 4 pixels. Next, these patches are taken out of every picture in the normalized dataset. In the NIA curated dataset, 374 photos yield a total of 292468samples (patches), which are further divided into three sub-types.
Table 2 displays the amount of photos and patches for each class (CLL, FL, MCL) in Dataset and Paches-Dataset, respectively.
Table 2. Whole sample dataset as well as patch dataset
|
|
CLL |
FL |
MCL |
Total Samples |
|
Dataset |
266 |
278 |
244 |
748 images |
|
Patches-Dataset |
88366 |
108698 |
95404 |
292468 patches |
The data is prepared using two preprocessing steps:
In data analysis, it is usual procedure to partition a dataset into test, validation, and training sets. Although the k-fold cross-validation method is generally used for smaller datasets [42], we chose not to apply this strategy because our large dataset consisted of 292468 items. Rather, we divided up the patches from each class into three categories: training, validation, and testing.
Using the training set, the training phase seeks to create a function that can correctly map input patches to the relevant labels (MCL, CLL, or FL). CNNs are a type of supervised deep neural network composed of convolutional, pooling, and fully connected layers, are used to accomplish this. In feature extraction, the convolution and pooling layers are essential because they allow the network to recognize unique patterns in the data [43].
To extract and map local features from the training set, the architecture first alternates between a convolutional layer and a pooling layer. A series of fully connected layers come after this. The feature maps are classified using a softmax function in the last layer. It also assigns scores reflecting the likelihood that each patch corresponds to one of the previously learned classes.
The softmax function has the following formula:
$\operatorname{softmax}\left(z_i\right)=\frac{\exp \left(z_i\right)}{\sum_j \exp \left(z_j\right)}$ (4)
The Z represents the values obtained from the output layer's neurons. The exponential serves as the nonlinear function. Later, these values are normalized by dividing them by the total of exponential values before being converted into probabilities.
4.5 Convolutional neural networks learning
Many computer vision applications rely heavily on convolutional neural networks [9], examples include natural language processing and picture processing. A mathematical technique called "convolution" combines many functions A pooling layer and a completely connected layer come after one or more convolutional layers in a typical CNN design [9]. The accuracy of the total forecast is heavily influenced by how the CNN parameters are initialized. The hyperparameters were empirically established at first and adjusted in the training process. Through numerous training-validation cycles, we continuously tweaked these hyperparameters, then refined the training dataset until the CNN achieved a satisfactory degree of learning accuracy. Finally, we used the test set to evaluate the performance of the finished model.
4.6 Evaluation metrics
There are several approaches for assessing the performance of categorization models. A frequent way is to use a confusion matrix, which provides a short assessment of the model's effectiveness. This matrix computes metrics such as True Negatives and True Positives (TP) for accurately predicted situations, as well as False Positives (FP) and False Negatives (FN) for examples that are misclassified. Furthermore, our models were evaluated using measures such as Recall, Precision, F1-score, and AUC, as detailed in Table 3.
These latter measures are frequently used to assess classification models, however they are not always appropriate for image generating algorithms such as Pix2Pix. To evaluate these models, particular metrics such as visual quality, diversity of generated samples, image sharpness, and subjective criteria like aesthetics and consistency must be used.
The cost function used follows the usual GAN formulation. To appropriately describe the distribution of the input data, we integrate the Lgan equation, which is defined in Eq. 2. Furthermore, to achieve great structural similarity with the reference image, we integrate the structural similarity index (SSIM) in the cost function. This inclusion seeks to reduce the disparity between the generated image and the ground truth image. The SSIM value is calculated by the following formula.
Table 3. Evaluation metrics for categorization models
|
Metric |
Definition |
Formula |
|
Precision |
Assesses the model’s overall predictive performance across multiple classes. |
Precision = $\frac{T P}{T P+F P}$ |
|
Recall |
Analyzes the model’s ability to discover all positive individuals. |
Recall = $=\frac{T P}{T P+F N}$ |
|
F1-score |
A metric that combines precision and recall values. |
F1-score = $\frac{2 * \text { Precision } * \text { Recall }}{\text { Precision }+ \text { Recall }}$ |
|
AUC |
AUC stands for Area Under the Curve. AUC curve represents the relationship between false positives (FPR) and true positives (PR) |
PR = $\frac{T P}{T P+F N}$
FPR = $\frac{F P}{F P+T N}$ |
SSIM $=\frac{2\left(\mu_x \mu_y+\mathrm{C}_1\right)\left(\sigma_{x y}+\mathrm{C}_2\right)}{\left(\mu_x{ }^2+\mu_y^2+\mathrm{C}_1\right)\left(\mu_x^2+\mu_y^2+\mathrm{C}_2\right)}$ (5)
where, μx and μy represent image windows. x and y are the averages of windows x and y, respectively. The x and y variances of the window are μx2 and μy2, respectively. Covariance between x and y is σxy.C1, C2 are constants. To achieve the end objective, we combine Eqs. (2) and (5).
$\begin{aligned} \min _G \max _D V(D, G) & =L_{c G A N}(G, D) +\beta I_{\text {ssim }}\left(I_{\text {ref }} \cdot I_{\text {pred }}\right)\end{aligned}$ (6)
Lssim=1−SSIM generates images that are structurally similar to the reference images.
In this section, we test our neural networks' performance using datasets created by the study [40] as well as our own datasets presented in Section 4.2. Furthermore, we conduct a thorough comparison, both quantitatively and qualitatively, against conventional methods, and conduct an ablation research to illustrate the efficacy of the attention module built into our model.
Our work made extensive use of the Kaggle platform account, the T4 GTU accelerator, and open-source machine learning technologies such as TensorFlow, Keras, and Pandas. We used these resources to create and train our models, utilizing a categorical Cross-Entropy Loss Function and an Adam Optimizer for model compilation. Our training sessions lasted 150 epochs, which ensured that the model was completely trained and optimized.
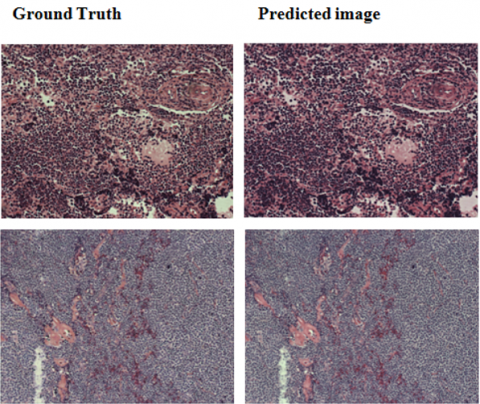
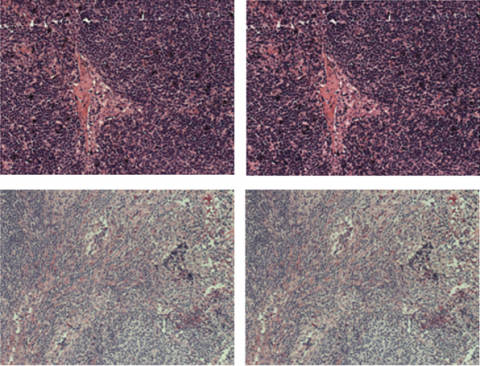
Figure 3 shows a visual comparison of our generative model's outcomes to the reference images generated by the study [40]. Our generative neural network is capable of producing results that are consistent with reference images. This is supported by the quantitative comparisons in Table 4 and Table 5. With little effort, our method offers satisfactory precision and visual quality results.
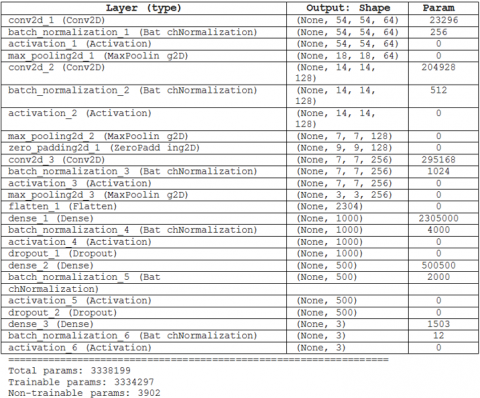
Figure 4 depicts the architecture of our CNN, as stated in Figure 1, which includes convolution layers, batch normalization layers, fully linked layers, and dense layers. Figures 5-7, as well as Table 5, indicate the progression of learning and validation rates.
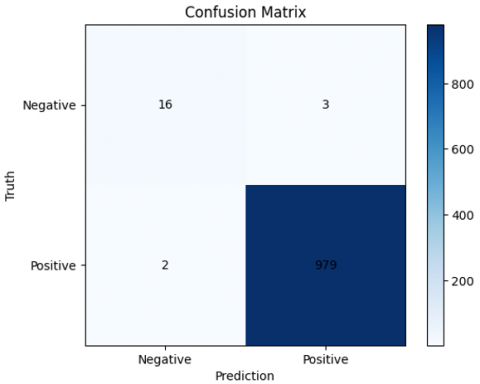
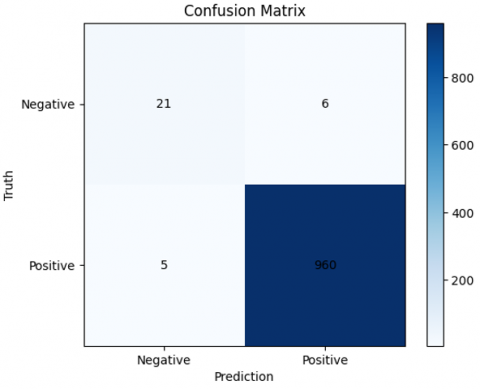
To evaluate the proposed model, a confusion matrix is computed on the test set (see Figure 5, 6 and 7), with 1000 image patches selected at random from each class as instances.
The investigation of the confusion matrix offers useful information about the model's performance. Out of 1000 picture patches per class, the proposed model achieves remarkable prediction accuracy, correctly detecting 983 MCL, 988 FL, and 975 CLL. However, there is significant uncertainty over the CLL class and both CLL and FL. These misclassifications may be due to the underlying similarities between CLL and the other classes, as reported in earlier investigations [5]. This demonstrates the need for further improvement in identifying features between these classes in order to improve model accuracy.
Figure 3. Visual comparison left: real image, right: predicted image
The performance evaluation of our proposed method is detailed in Table 6. Additionally, Table 6 also provides the test outcomes and a comparison with other learning-based techniques for Non-Hodgkin lymphoma (LNH) classification utilizing the identical dataset [40].
Figure 4. Architecture of our neural network
Table 4. Quantitative comparison with images from our Pix2pix model with dataset [40] in terms of average SSIM/RMSE
|
DataSet |
RMSE |
SSIM |
|
CLL |
0.0345 |
0.945 |
|
FL |
0.0245 |
0.951 |
|
MCL |
0.0318 |
0.918 |
Table 5. Results achieved by the CNN model
|
Predicted Class |
Precision |
Recall |
F1-Score |
|
CLL |
99.26% |
99.13% |
99.29% |
|
FL |
99.48% |
99.31% |
99.15% |
|
MCL |
99.79% |
99.09% |
99.55% |
Table 6. Test performance compared to learning-based techniques
|
Method |
Accuracy |
|
AlexNet [10] |
0.965 |
|
Inception V3 Network [17] |
0.973 |
|
FusionNet [19] |
0.976 |
|
Resnet50[23] |
0.981 |
|
Khelil [25] |
0.987 |
|
Proposed technique |
0.991 |
Figure 5. The confusion matrix MCL
Figure 6. The confusion matrix FL
Figure 7. The confusion matrix CLL
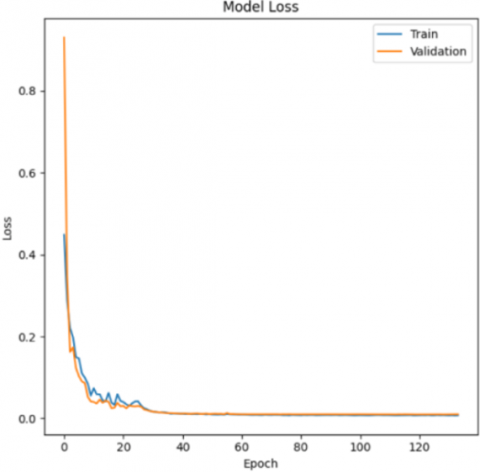
The results indicate that the model correctly caught the underlying patterns during the training process, as shown by its high accuracy ratings. Notably, the model's incredibly low loss value of 0.0080, as shown in Figure 8, demonstrates its ability to effectively diagnose errors using our technique. Furthermore, a recall score of 0.99 for "Class 1", which represents the healthy system, demonstrates the model's capacity to properly identify 98% of true healthy instances, with only 1% of marginals identified as false negatives. When it comes to detecting defects in proposed systems, it is critical to prioritize precise tumeur categorization over healthy instances. Even if a tiny percentage of healthy system instances are misclassified, the model's overall performance is commendable, effectively addressing security problems related with misidentifying failures as healthy instances.
The study results show that the model has good precision and recall, indicating that it can recognize all 3 tumor types at the same time. The performance suggests that the modified dataset produced better results.
Training with synthetic data can greatly improve the accuracy and resilience of the model. By adding diversity to the training dataset, synthetic data assist avoid overfitting and enhance generalization to new data. Additionally, it corrects dataset imbalances and improves the model's resistance to noise and fluctuations. Compared to gathering data from the real world, synthetic data are more affordable and hasten the convergence of models. To prevent introducing biases, it is imperative to ensure the quality of synthetic data. Overall, by using varied, balanced, and noise-tolerant training examples, synthetic data help create machine learning models that are more effective.
Figure 8. Accuracy and loss evolution in the suggested CNN tumor detection technique
In this study, we suggested a robust technique for improving non-Hodgkin's lymphoma (NHL) diagnosis by integrating two powerful neural networks. First, we applied an updated CNN algorithm to help pathologists diagnose NHL subtypes such as MCL, FL, and CLL. On the other hand, we used a Pix2Pix-type conditional generative adversarial network (cGAN) to create synthetic images of histology slides, allowing us to augment our traditional training dataset. This combination of two complimentary strategies enabled not just an increase in the diversity of the training data set, supporting better model generalization, but also a significant improvement in performance. Our model obtained a great classification accuracy of 99.91%, illustrating the efficiency of our technique.
In the future, we are contemplating numerous areas of R&D:
·Improving the diversity of synthetic data: We will investigate more advanced approaches for increasing the variety of synthetic data produced, which could lead to improved model adaptation to varied clinical scenarios.
·Extension to other forms of cancer: Our approach could be applied to other types of cancer, creating new options for early detection and therapeutic management of patients.
·Multimodal data integration: We aim to incorporate data from various modes, such as magnetic resonance imaging (MRI) or positron emission tomography (TEP), to provide a more comprehensive assessment of tumors and their responses to treatment.
·Clinical validation and practical implementation: Clinical studies will be required to validate the effectiveness of our model in real-world settings. We also envision progressive integration into clinical practices so that patients can benefit directly. A preliminary cost study for deploying our system in a real-world clinical setting is critical, particularly for cost-conscious medical facilities.
·By combining these viewpoints with ongoing advances in artificial intelligence and medicine, our approach may open up new avenues for the diagnosis and treatment of cancer. This could help to improve clinical outcomes and the quality of life for cancer patients.
The following developments in the use of neural networks to clinical practice have the potential to completely transform healthcare:
·Enhanced Accuracy: AI is capable of making diagnoses that are more accurate, but it is essential to offer unbiased training data.
·Streamlined Workflow: Healthcare workers can gain time back via automation, but a smooth AI integration is necessary.
·Personalized Care: AI is capable of creating customized treatment regimens, but good advice dissemination is essential.
·Early Disease Detection: AI can identify illnesses at an early stage, but it might be difficult to keep false-positive rates low.
·Effective Resource Allocation: AI is capable of optimizing resource utilization, but its suggestions must take ethics into account.
·Constant Improvement: AI is able to pick up new skills from fresh data, but its effectiveness and security must be closely observed.
·Data Privacy: While AI is capable of handling patient data securely, maintaining legal compliance and safeguarding privacy are essential.
[1] Aeffner, F., Zarella, M.D., Buchbinder, N., Bui, M.M., Goodman, M.R., Hartman, D.J., Lujan, G.M., Molani, M.A., Parwani, A.V., Lillard, K., Turner, O.C., Vemuri, V.N.P., Yuil-Valdes, A.G., Bowman, D. (2019). Introduction to digital image analysis in whole-slide imaging: A white paper from the digital pathology association. Journal of Pathology Informatics, 10(1): 9. https://doi.org/10.4103/jpi.jpi_82_18
[2] Sertel, O., Lozanski, G., Shana’ah, A., Gurcan, M.N. (2010). Computer-aided detection of centroblasts for follicular lymphoma grading using adaptive likelihood-based cell segmentation. IEEE Transactions on Biomedical Engineering, 57(10): 2613-2616. https://doi.org/10.1109/TBME.2010.2055058
[3] Liew, X.Y., Hameed, N., Clos, J. (2021). A review of computer-aided expert systems for breast cancer diagnosis. Cancers, 13(11): 2764. https://doi.org/10.3390/cancers13112764
[4] El Achi, H., Belousova, T., Chen, L., Wahed, A., Wang, I., Hu, Z., Kanaan, Z., Rios, A., Nguyen, A.N. (2019). Automated diagnosis of lymphoma with digital pathology images using deep learning. Annals of Clinical & Laboratory Science, 49(2): 153-160. https://doi.org/10.48550/arXiv.1811.02668
[5] Canellos, G.P., et al. (2006). The Lymphomas. Second ed. London: Saunders.
[6] Tosta, T.A.A., Neves, L.A., do Nascimento, M.Z. (2017). Segmentation methods of H&E-stained histological images of lymphoma: A review. Informatics in Medicine Unlocked, 9: 35-43. https://doi.org/10.1016/j.imu.2017.05.009
[7] National Cancer Institute. Cancer Stat Facts: Non-Hodgkin Lymphoma. https://seer.cancer.gov/statfacts/html/nhl.html,/ accessed on Jan. 29, 2024.
[8] Alom, M.Z., Taha, T.M., Yakopcic, C., Westberg, S., Sidike, P., Nasrin, M.S., Hasan, M., Van Essen, B.C., Awwal, A.A.S., Asari, V.K. (2019). A state-of-the-art survey on deep learning theory and architectures. Electronics, 8(3): 292. https://doi.org/10.3390/electronics8030292
[9] Ayachi, R., Afif, M., Said, Y., Atri, M. (2020). Strided convolution instead of max pooling for memory efficiency of convolutional neural networks. In Proceedings of the 8th International Conference on Sciences of Electronics, Technologies of Information and Telecommunications (SETIT’18), pp. 234-243. https://doi.org/10.1007/978-3-030-21005-2_23
[10] Janowczyk, A., Madabhushi, A. (2016). Deep learning for digital pathology image analysis: A comprehensive tutorial with selected use cases. Journal of Pathology Informatics, 7(1): 29. https://doi.org/10.4103/2153-3539.186902
[11] Scheurer, J., Ferrari, C., Berenguer Todo Bom, L., Beer, M., Kempf, W., Haug, L. (2020). Semantic segmentation of histopathological slides for the classification of cutaneous lymphoma and eczema. In Annual Conference on Medical Image Understanding and Analysis, pp. 26-42. https://doi.org/10.1007/978-3-030-52791-4_3
[12] Isola, P., Zhu, J.Y., Zhou, T., Efros, A.A. (2017). Image-to-image translation with conditional adversarial networks. In Proceedings of the IEEE Conference on Computer Vision and Pattern Recognition, pp. 1125-1134. https://doi.org/10.1109/BIBM49941.2020.9313466
[13] Mirza, M., Osindero, S. (2014). Conditional generative adversarial nets. ArXiv, abs/1411.1784. https://doi.org/10.48550/arXiv.1411.1784
[14] Alom, M.Z., Taha, T.M., Yakopcic, C., Westberg, S., Sidike, P., Nasrin, M.S., Van Esesn, B.C., Awwal, A.A.S., Asari, V.K. (2018). The history began from alexnet: A comprehensive survey on deep learning approaches. arXiv preprint arXiv:1803.01164. https://doi.org/10.48550/arXiv.1803.01164.
[15] Ravì, D., Wong, C., Deligianni, F., Berthelot, M., Andreu-Perez, J., Lo, B., Yang, G.Z. (2016). Deep learning for health informatics. IEEE Journal of Biomedical and Health Informatics, 21(1): 4-21. https://doi.org/10.1109/JBHI.2016.2636665
[16] Syrykh, C., Abreu, A., Amara, N., Siegfried, A., Maisongrosse, V., Frenois, F.X., Martin, L., Rossi, C., Brousset, P. (2020). Accurate diagnosis of lymphoma on whole-slide histopathology images using deep learning. NPJ Digital Medicine, 3(1): 63.https://doi.org/10.1038/s41746-020-0272-0.
[17] Guan, Q., Wan, X., Lu, H., Ping, B., Li, D., Wang, L., Zhu,Y., Wang, Y., Xiang, J. (2019). Deep convolutional neural network Inception-v3 model for differential diagnosing of lymph node in cytological images: A pilot study. Annals of Translational Medicine, 7(14): 307.https://doi.org/10.21037/atm.2019.06.29
[18] Steinbuss, G., Kriegsmann, M., Zgorzelski, C., Brobeil, A., Goeppert, B., Dietrich, S., Mechtersheimer, G., Kriegsmann, K. (2021). Deep learning for the classification of non-Hodgkin lymphoma on histopathological images. Cancers, 13(10): 2419.https://doi.org/10.3390/cancers13102419
[19] Tambe, R., Mahajan, S., Shah, U., Agrawal, M., Garware, B. (2019). Towards designing an automated classification of lymphoma subtypes using deep neural networks. In Proceedings of the ACM India Joint International Conference on Data Science and Management of Data, pp. 143-149.https://doi.org/10.1145/3297001.3297019
[20] Brousset, P., Syrykh, C., Abreu, A., Amara, N., Laurent, C. (2019). Diagnosis and classification assistance from lymphoma microscopic images using deep learning. Hematological Oncology, 37: 138-138.https://doi.org/10.1002/hon.97_2629
[21] Soltane, S., Alsharif, S., Eldin, S.M.S. (2022). Classification and diagnosis of lymphoma's histopathological images using transfer learning. Computer Systems Science & Engineering, 40(2): 629-644. https://doi.org/10.32604/csse.2022.019333
[22] Zhang, X., Zhang, K., Jiang, M., Yang, L. (2021). Research on the classification of lymphoma pathological images based on deep residual neural network. Technology and Health Care, 29(S1): 335-344.https://doi.org/10.3233/thc-218031
[23] Ganguly, A., Das, R., Setua, S.K. (2020). Histopathological image and lymphoma image classification using customized deep learning models and different optimization algorithms. In 2020 11th International Conference on Computing, Communication and Networking Technologies (ICCCNT), pp. 1-7. https://doi.org/10.1109/ICCCNT49239.2020.9225616
[24] Brancati, N., De Pietro, G., Frucci, M., Riccio, D. (2019). A deep learning approach for breast invasive ductal carcinoma detection and lymphoma multi-classification in histological images. IEEE Access, 7: 44709-44720. https://doi.org/10.1109/ACCESS.2019.2908724
[25] Khelil, H., Djerou, L. (2022). Accurate diagnosis of non-Hodgkin lymphoma on whole-slide images using deep learning. In 2022 IEEE 9th International Conference on Sciences of Electronics, Technologies of Information and Telecommunications (SETIT), pp. 447-451. https://doi.org/10.1109/SETIT54465.2022.9875482
[26] Laloy, E., Linde, N., Jacques, D. (2021). Approaching geoscientific inverse problems with vector-to-image domain transfer networks. Advances in Water Resources, 152: 103917. https://doi.org/10.1016/j.advwatres.2021.103917
[27] Li, L., Li, J., Lv, C., Yuan, Y., Zhao, B. (2021). Maize residue segmentation using Siamese domain transfer network. Computers and Electronics in Agriculture, 187: 106261. https://doi.org/10.1016/j.compag.2021.106261
[28] Liu, H., Guo, F., Xia, D. (2021). Domain adaptation with structural knowledge transfer learning for person re-identification. Multimedia Tools and Applications, 80(19): 29321-29337. https://doi.org/10.1007/s11042-021-11139-w
[29] Liu, J., Li, Q., Zhang, P., Zhang, G., Liu, M. (2020). Unpaired domain transfer for data augment in face recognition. IEEE Access, 8: 39349-39360. https://doi.org/10.1109/ACCESS.2020.2976207
[30] Al-Shannaq, A., Elrefaei, L. (2020). Age estimation using specific domain transfer learning. Jordanian Journal of Computers and Information Technology (JJCIT), 6(2): 122-139. https://doi.org/10.5455/jjcit.71-1571410322
[31] Suh, Y., Han, B., Kim, W., Lee, K.M. (2019). Stochastic class-based hard example mining for deep metric learning. In Proceedings of the IEEE/CVF Conference on Computer Vision and Pattern Recognition, pp. 7251-7259. https://doi.org/10.1109/CVPR.2019.00742
[32] Sun, P., Zhang, R., Jiang, Y., Kong, T., Xu, C., Zhan, W., Tomizuka, M., Li, L., Yuan, Z., Wang, C., Luo, P. (2021). Sparse R-CNN: End-to-end object detection with learnable proposals. In Proceedings of the IEEE/CVF Conference on Computer Vision and Pattern Recognition, pp. 14454-14463. https://doi.org/10.48550/arXiv.2011.12450
[33] Mao, J., Wang, H., Spencer Jr, B.F. (2021). Toward data anomaly detection for automated structural health monitoring: Exploiting generative adversarial nets and autoencoders. Structural Health Monitoring, 20(4): 1609-1626. https://doi.org/10.1177/1475921720924601
[34] Xia, Y., Zhang, L., Ravikumar, N., Attar, R., Piechnik, S.K., Neubauer, S., Petersen, S.E., Frangi, A.F. (2021). Recovering from missing data in population imaging–Cardiac MR image imputation via conditional generative adversarial nets. Medical Image Analysis, 67: 101812. https://doi.org/10.1016/j.media.2020.101812
[35] Wang, T.C., Liu, M.Y., Zhu, J.Y., Tao, A., Kautz, J., Catanzaro, B. (2018). High-resolution image synthesis and semantic manipulation with conditional gans. In Proceedings of the IEEE conference on computer vision and pattern recognition, pp. 8798-8807. https://doi.org/10.48550/arXiv.1711.11585
[36] Radford, A., Metz, L., Chintala, S. (2015). Unsupervised representation learning with deep convolutional generative adversarial networks. arXiv preprint arXiv:1511.06434. https://doi.org/10.48550/arXiv.1511.06434
[37] Arjovsky, M., Chintala, S., Bottou, L. (2017). Wasserstein generative adversarial networks. In International Conference on Machine Learning, pp. 214-223.
[38] Karras, T., Laine, S., Aila, T. (2019). A style-based generator architecture for generative adversarial networks. In Proceedings of the IEEE/CVF conference on computer vision and pattern recognition, pp. 4401-4410. https://doi.org/10.1109/CVPR.2019.00453
[39] Long, J., Shelhamer, E., Darrell, T. (2015). Fully convolutional networks for semantic segmentation. In Proceedings of the IEEE conference on computer vision and pattern recognition, pp. 3431-3440. https://doi.org/10.1109/CVPR.2015.7298965
[40] Deep learning datasets. http://www.andrewjanowczyk.com/deep-learning
[41] De Matos, J., Britto Jr, A.D.S., Oliveira, L.E., Koerich, A.L. (2019). Histopathologic image processing: A review. arXiv preprint arXiv:1904.07900. https://doi.org/10.48550/arXiv.1904.07900
[42] Rodriguez, J.D., Perez, A., Lozano, J.A. (2009). Sensitivity analysis of k-fold cross validation in prediction error estimation. IEEE Transactions on Pattern Analysis and Machine Intelligence, 32(3): 569-575.https://doi.org/10.1109/TPAMI.2009.187
[43] Mukkapati, N., Anbarasi, M.S. (2022). Braintumor classification based on enhanced CNN model. d'Intelligence Artificielle, 36(1): 125-130. https://doi.org/10.18280/ria.360114