Teddy Aristan![]() | Gede Putra Kusuma*
| Gede Putra Kusuma*![]()
© 2023 IIETA. This article is published by IIETA and is licensed under the CC BY 4.0 license (http://creativecommons.org/licenses/by/4.0/).
OPEN ACCESS
Farmers in rural areas with limitation of internet connectivity can be made possible for early plant diseases detection by using optimization of mobile devices which implemented an application based on Convolutional Neural Network (CNN) because of the computational efficiency. The researchers used a dataset containing 79 different classes of plant which was merged from several public domain datasets, which was evaluated and compared using four CNN models, consisting of MobileNetV3, EfficientNetB0, Mason model, and ShuffleNetV2. The experiment results showed that Mason model has a highest accuracy of 90.54% and the smallest output file of 0.85MB, MobileNetV3 88.83% with 16.85MB, EfficientNetB0 88.75% with 16.08MB, and ShuffleNetV2 83.52% with 15.89MB, which the four models have a slight accuracy decrease on both workstation and mobile devices. However, on resource consumption overall, MobileNetV3 consumed less than the others model, even though the value hasn’t a huge difference of several points. It can be concluded that Mason model is the most suitable model to be implemented on mobile devices because of accuracy and low resource consumption.
Convolutional Neural Network, plant diseases classification, mobile device, low compute device, resource requirement evaluation
Plant diseases are one of the utmost threats to crop production and expansion. Plant diseases can hamper the target of agricultural production every year where about 85% are caused by fungi or fungus-like organisms. The repeated failure to meet production targets can cause food insecurity for a country and even the world.
Using pesticides and insecticides could give a short solution but it is not helpful for long-term. Therefore, early detection and identification for plant diseases is one of best options in minimizing the damage level of plants. This option can be used because symptoms of plant diseases can mostly be identified on the leaves, such as chlorosis (the yellowing or lightening of the green parts of plants) and curl (rolling, cupping, or puckering of leaves).
For the farmers, who lack knowledge of plant diseases, will call the experts to help them identify plant diseases. In most cases, the experts need to use a microscope for carrying out in-depth analysis or need to convert the sample into electromagnetic spectrum. However, this method tends to be time-consuming and expensive, even while the experts are far away from the farmers or laboratory assistance required to diagnose the diseases.
The new technology appeared over the past few years like computer vision can be an alternative way to solve the limitations of traditional methods. The recent applications of computer vision through deep learning have made enormous advances in various studies, such as object segmentation, object recognition, image segmentation, and image classification. Furthermore, deep learning is not limited to being implemented on Personal Computer (PC), the others can be synchronized with mobile devices. Mobile devices have significantly increased usage during covid-19 pandemic, where people unwillingly work and study from home, or need to scan entries ticket via QR code if want to enter public places even apartments. These uncommon activities during the pandemic contribute to changing the perspective of mobile devices usage as an intermediary medium. This opportunity shown from mobile devices can be one of the potentially good mediums to reach farmers in rural areas.
However, some rural and plantation areas in Indonesia still not have enough internet connections support. Therefore, building a plant diseases diagnosis system with limited internet connectivity through a mobile application can be very helpful for farmers.
The system is expected to be able to identify diseases from leaf images and to provide accurate and quick labeling of a plant disease. The mechanism of identification refers to the similarity between the diseases on pictures of plants with actual plant disease by using deep learning algorithms.
Deep learning algorithms work using several layers of neural network algorithms to process data and create patterns in decision making automatically. The subset of deep learning algorithms is Convolution Neural Network (CNN) which is currently one of machine learning popular methods for solving image classification problems. There have been a lot of studies that use CNN in classifying plant diseases, as have been done by Jadhav et al. [1] that achieve accuracy rate of 96.25% by implementing AlexNet with some modifications in hyperparameters using 650 disease and 550 healthy soybean images. Upadhyay and Kumar [2] reached identification accuracy of 99.7%, using simple layers of CNN including batch normalization layer, one fully connected, and softmax layer with Rice Leaf Image dataset. Then, Sembiring et al. [3] classify ten tomato leaf diseases from PlantVillage Dataset and achieve the accuracy rate of 98.28%. Two versions of PlantVillage dataset (Augmented and Original) were evaluated by Atila et al. [4] by using several different CNN models, the highest accuracy of each version dataset, EfficientNet-B4 at 99.97% and EfficientNet-B5 at 99.91% respectively. Then, Liu et al. [5] achieved identification accuracy of 97.22% from DICNN model using 107,366 images of augmented 7,669 grape leaf images which are generated via image enhancement technique.
Based on previous research, there are only two studies that focus on the application of deep learning techniques to be used on mobile devices, specifically the research of plant disease classification. In 2019, Syamsuri and Kusuma [6] evaluate several pre-trained deep learning Convolutional Neural Network (CNN) on mobile devices, MobileNet reached accuracy of 92.83%, followed by MNasNet at 94.87%, and Inception V3 at 95.79%. Then, Bimorogo and Kusuma [7] expands the previous research by adding two classes of coffee plants and four classes of rice plants by using MobileNet V2 that achieve accuracy of 96.55%, then NasNet Mobile at 97,31%, DenseNet 121 layer at 96.21%, and Inception V3 at 98,45%. Both studies can achieve high accuracy and can be said to be almost perfect. However, the use of the PlantVillage dataset as the main dataset on both studies has drawbacks where [8] shows a decrease in accuracy by ten to twenty percent when tested with images of different lighting conditions. From the background above, there is a motivation to build a system that has the ability to recognize many variants of diseases with good accuracy performance and resource requirements in helping farmers in rural areas who are still difficult to reach by a fast internet network.
In this research, the authors use CNN model that has fewer parameters and has been demonstrated to be highly accurate on a certain disease dataset, namely Mason model [9], which compared to another less parameters CNN models that have been proven to be highly accurate on ImageNet dataset such as MobileNetV3 [10], ShuffleNetV2 [11], and EfficientNetB0 [12]. The motivation of using less parameters models is to reduce computation cost and require less resources.
Furthermore, this research extends more plant disease classes which consisted of 104,282 images from 21 kind of plants, in order to enrich the variation of dataset and build robust identification system with more variation of plant diseases.
The evaluation design in this research is carried out in two parts, namely on the workstation which is to find the best model performance based on its loss and then it is tested on a mobile device to evaluate the required resource requirements, namely file size, memory, CPU, detection speed, and power consumption. The evaluation results show that the Mason model shows better performance results compared to other models even though still needs some minor improvement in the future.
This paper is organized as follows. Section 2 presents the related work to the detection of plant diseases. Section 3 shows the experimental design method by mentioning merged datasets detail and illustrating workflow experimental on workstation and a mobile device. Section 4 discusses the experimental results on workstation and mobile devices which are displayed in table form and has an explanation. Section 5 shows the conclusion of the experimental results that have been carried out.
In their research [1], they used AlexNet and GoogleNet for identifying soybean leaf diseases including healthy soybean with five-fold cross-validation and transfer learning. The result of this study shows AlexNet achieved the higher accuracy rate of 98,75% using 1199 images taken in Kolhapur district, India.
Research by Upadhyay and Kumar [2] proposed simple CNN architecture for classifying rice leaf diseases in India using 4000 images taken by the authors. Then, the dataset was preprocessed using several methods such as resizing, removing noise, and cropping. The accuracy achieved using the proposed architecture was 99.7%.
Sembiring et al. [3] compared several CNN models to identify tomato leaf diseases using ten classes of PlantVillage dataset. The authors evaluated the proposed model, VGG16, ShuffleNet, and SqueezeNet with fine tuning, learning rate 0.0003 and sgdm optimization. VGG16 obtained the best accuracy score of 98.28%. However, the proposed model has achieved an accuracy score of 97.15% and faster in training time of around one hour than VGG16 by around five hours.
Other research that used several CNN models has been done by Atila et al. [4]. AlexNet, ResNet50, VGG16, InceptionV3, and EfficientNet B0-B7 were carried out using two versions of the PlantVillage dataset, original and augmented. The models trained either adam optimizer with learning rate 0.001 or sgd optimizer with learning rate 0.01. The architecture of the EfficientNet B5 achieved a success rate of 99.91% for the original version and EfficientNet B4 at 99.97% for the augmented version.
In the research conducted by Liu et al. [5], they proposed Dense Inception Convolutional Neural Networks (DICNN) to classify six grape leaf diseases and healthy grape. Using 107,336 images after implementing several augmentation techniques implemented to enumerate number of images. This study also compared another different algorithm such as back-propagation, SVM, VGG16, VGG19, GoogLeNet, ResNet34, and DenseNet169. With learning rate 0.001, DICNN was superior in accuracy rate of 97.22% than other algorithms.
There are more than these studies mentioned above that the research using CNN deep learning on plant disease detection even almost achieved perfection accuracy. However, only two studies that evaluated explicitly run CNN deep learning on mobile devices. The first, the research was conducted by Syamsuri and Kusuma [6] that focus classify coffee plants diseases, three CNN models (InceptionV3, MobileNet, and MNasNet) achieved classification accuracy of 95.79%, 92.83%, and 94.87% respectively on mobile devices. For the time latency, MobileNet was the lowest with 394.70 ms, followed by MNasNet at 430.20 ms, and InceptionV3 at 2236.10 ms. The models were trained using PlantVillage dataset which extended to coffee leaf. The second, Bimorogo and Kusuma [7] compared four CNN models that consist of MobileNet V2, NasNet Mobile, DenseNet 121 layer, and Inception V3 using PlantVillage dataset which extended to two classes of coffee plants and four classes of rice plants. The experiments showed that Inception V3 was the most stable model with highest accuracy of 98.45%, followed by NasNet Mobile at 97.31%, MobileNet V2 at 96.55%, and DenseNet 121 layer at 96.21%. Although Inception V3 was the most stable, it consumes a lot of resources.
These two studies can obtain high and almost perfect accuracy but the use of the PlantVillage dataset as the main dataset can decrease in accuracy when tested with images that have outdoor lighting conditions. In addition, the recommended models in these two studies still have a large number of parameters and resource requirements and to be more efficient and effective for farmers who have mobile devices with low specifications.
Furthermore, this research used the CNN model (Mason model) [9], which have fewer parameters and have been demonstrated to be highly accurate on certain diseases dataset, to be compared with with another fewer parameters CNN models (MobileNetV3 [10], ShuffleNetV2 [11], and EfficientNetB0 [12]), which has been proven to be highly accurate on ImageNet dataset. This study also expanded the dataset that was used on Syamsuri and Kusuma [6] and Bimorogo and Kusuma [7] with other public plant disease datasets in order to enrich the variation of datasets and build a robust identification system of many variations of plant diseases.
3.1 Dataset
Several sources of datasets were used in this research, these are The PlantVillage dataset that collected by Hughes and Salathé [13], with extended cassava leaf disease that used in competition held by Makerere University AI Lab [14], Plant Pathology dataset that was the dataset of Plant Pathology 2020 Challenge [15], a robusta coffee leaf images called RoCole dataset [16], then an apple scab dataset collected by Institute of Hulticulture [17], bean disease dataset from public domain, PlantDoc dataset [18], corn leaf disease dataset [19], cotton leaf disease dataset [20], DiaMOS plant dataset which contains four pear leaf disease [21], some disease species from Digipathos dataset [22] that have more than 20 images, rice leaf diseases dataset that gathered from a farming community [23], citrus leaf diseases dataset [24], cassava leaf diseases dataset [25], bean diseases dataset [26], and some manual searching for two classes, rice gray leaf spot and rice healthy. Total images were 104,282 images consisting of 21 plant species in 79 different classes with 19 healthy plants and 60 combinations of diseased plants. Next, the authors removed some background images from the datasets which have like the other and renamed properly all the images file after the dataset merged. The detail of the dataset is mentioned in Table 1.
Then, the dataset will be separated into three parts datasets, training, validation, and testing, using stratified random sampling with composition 60% (62,568 images), 20% (20,857 images), and 20% (20,857 images) respectively. Due to the manual image picking process in mobile, the testing data would be 158 images for testing on mobile devices and uses all of testing data for evaluating TFlite models’ accuracy on PC.
Table 1. Merged Dataset
|
No |
Class Name |
Train |
Val. |
Test |
|
1 |
Apple Complex |
1291 |
430 |
430 |
|
2 |
Apple Frog Eye Leaf Spot |
1909 |
636 |
636 |
|
3 |
Apple Powdery Mildew |
710 |
237 |
237 |
|
4 |
Apple Scab |
967 |
323 |
323 |
|
5 |
Apple Black Rot |
373 |
124 |
124 |
|
6 |
Apple Rust |
165 |
55 |
55 |
|
7 |
Apple Healthy |
1111 |
371 |
370 |
|
8 |
Bean Angular Leaf Spot |
490 |
163 |
163 |
|
9 |
Bean Healthy |
487 |
162 |
162 |
|
10 |
Bean Rust |
482 |
161 |
161 |
|
11 |
Blueberry Healthy |
901 |
301 |
300 |
|
12 |
Cassava Bacterial Blight |
931 |
311 |
311 |
|
13 |
Cassava Brown Streak |
2179 |
726 |
727 |
|
14 |
Cassava Green Mottle |
1895 |
632 |
632 |
|
15 |
Cassava Healthy |
1735 |
579 |
579 |
|
16 |
Cassava Mosaic |
9490 |
3163 |
3163 |
|
17 |
Cherry Healthy |
511 |
171 |
171 |
|
18 |
Cherry Powdery Mildew |
631 |
211 |
210 |
|
19 |
Coffee Healthy |
475 |
158 |
158 |
|
20 |
Coffee Red Spider Mite |
100 |
34 |
33 |
|
21 |
Coffee Rust level 1 |
232 |
78 |
78 |
|
22 |
Coffee Rust level 2 |
100 |
33 |
33 |
|
23 |
Coffee Rust level 3 |
38 |
12 |
12 |
|
24 |
Coffee Rust level 4 |
18 |
6 |
6 |
|
25 |
Corn Northern Leaf Blight |
1279 |
426 |
426 |
|
26 |
Corn Gray Leaf Blight |
652 |
218 |
217 |
|
27 |
Corn Common Rust |
1498 |
500 |
500 |
|
28 |
Corn Healthy |
775 |
258 |
258 |
|
29 |
Cotton Bacterial Blight |
268 |
90 |
90 |
|
30 |
Cotton Curl Virus |
250 |
84 |
84 |
|
31 |
Cotton Fussarium Wilt |
251 |
85 |
85 |
|
32 |
Cotton Healthy |
256 |
85 |
85 |
|
33 |
Grape Black Rot |
708 |
236 |
236 |
|
34 |
Grape Esca |
829 |
277 |
277 |
|
35 |
Grape Healthy |
253 |
85 |
85 |
|
36 |
Grape Leaf Blight |
646 |
215 |
215 |
|
37 |
Orange Citrus Black Spot |
103 |
34 |
34 |
|
38 |
Orange Citrus Canker |
98 |
32 |
33 |
|
39 |
Orange Citrus Healthy |
35 |
11 |
12 |
|
40 |
Orange Citrus Greening |
3427 |
1142 |
1142 |
|
41 |
Peach Healthy |
1517 |
506 |
506 |
|
42 |
Peach Bacterial Spot |
1378 |
460 |
459 |
|
43 |
Pear Curl |
32 |
11 |
11 |
|
44 |
Pear Healthy |
26 |
8 |
9 |
|
45 |
Pear Slug |
1215 |
405 |
405 |
|
46 |
Pear Spot |
530 |
177 |
177 |
|
47 |
Pepper Bell Bacterial Spot |
598 |
200 |
199 |
|
48 |
Pepper Bell Healthy |
886 |
295 |
295 |
|
49 |
Potato Early Blight |
600 |
200 |
200 |
|
50 |
Potato Healthy |
92 |
30 |
30 |
|
51 |
Potato Late Blight |
600 |
200 |
200 |
|
52 |
Raspberry Healthy |
223 |
74 |
74 |
|
53 |
Rice Bacterial Leaf Blight |
27 |
9 |
9 |
|
54 |
Rice Brown Spot |
30 |
10 |
10 |
|
55 |
Rice Gray Leaf Spot |
14 |
4 |
5 |
|
56 |
Rice Healthy |
14 |
4 |
5 |
|
57 |
Rice Leaf Smut |
24 |
8 |
8 |
|
58 |
Soybean Bacterial Blight |
34 |
11 |
11 |
|
59 |
Soybean Brown Spot |
20 |
6 |
7 |
|
60 |
Soybean Copper Phytotoxicity |
14 |
4 |
5 |
|
61 |
Soybean Downy Mildew |
20 |
6 |
6 |
|
62 |
Soybean Mosaic |
14 |
4 |
4 |
|
63 |
Soybean Powdery Mildew |
47 |
15 |
15 |
|
64 |
Soybean Rust |
39 |
13 |
13 |
|
65 |
Soybean Southern Blight |
38 |
12 |
12 |
|
66 |
Soybean Healthy |
3053 |
1-18 |
1018 |
|
67 |
Squash Powdery Mildew |
1101 |
367 |
367 |
|
68 |
Strawberry Healthy |
274 |
91 |
91 |
|
69 |
Strawberry Leaf Scorch |
665 |
222 |
222 |
|
70 |
Tomato Bacterial Spot |
1276 |
425 |
425 |
|
71 |
Tomato Early Blight |
600 |
200 |
200 |
|
72 |
Tomato Healthy |
954 |
318 |
318 |
|
73 |
Tomato Late Blight |
1145 |
382 |
382 |
|
74 |
Tomato Leaf Mold |
571 |
191 |
190 |
|
75 |
Tomato Septoria Leaf Spot |
1063 |
354 |
354 |
|
76 |
Tomato Two-Spotted Spider Mite |
1006 |
335 |
335 |
|
77 |
Tomato Target Spot |
842 |
281 |
281 |
|
78 |
Tomato Mosaic |
223 |
75 |
75 |
|
79 |
Tomato Curl |
3214 |
1071 |
1072 |
|
|
Total |
62568 |
20857 |
20857 |
3.2 CNN models
This research implemented transfer learning method to the CNN models. Transfer learning works by gained the weight of pre-trained CNN models before on a large-scale and general dataset, namely ImageNet. So, the CNN models can learn basic knowledge from existing models instead of starting from scratch each time. However, the authors cannot find two saved weights of transfer learning on ImageNet for ShuffleNetV2 and Mason model. The alternative, both models will be trained first using merged dataset with 20 epochs without early stopping using learning rate SGD 0.001 and Adam 0.001 respectively.
This work also fine-tuned the last ten layers of each model. By fine tuning, the information from transfer learning is not lost at all when the model to be retrained. For the final layers, each model used two fully connected layers (FCs) with relu activation function that has nodes same as the number of classes including a softmax layer.
3.2.1 Mason model
Mason model is popularized by Masud et al. [9] which has less parameters around 200 thousand. This model is supported by four convolution layers, a Global Average Pooling (GAP), two Fully Connected (FC), and a softmax output layer. Each convolution block has 3 x 3 rectified linear units (ReLUs), a connected convolution block 1 x 1 with ReLu and a max pooling block.
Zero padding is implemented before reaching convolution block for keeping the size of each convolution block. Mini-batch normalization is also used for accelerating the training. Then, in the middle of convolution block and max pooling, there is convolution block connector.
This model was able to obtain prediction accuracy of 97.9% in pulmonary nodule detection using CT Scan images of Lung Image Database Consortium (LIDC) dataset on mobile devices.
3.2.2 MobileNetV3
MobileNetV3 is a next generation model from its predecessor MobileNetV2 which was made to enhance computation efficiency, accuracy, and latency reduction. This model was made by combination of MobileNetV2 and MNasNet as building blocks.
In the new architecture proposed, there includes non-linearity, h-swish, and new version of swish non-linearity for enlarging friendly computation and quantization. In addition, the new design of MobileNetV3 switched the final layer in MobileNetV2 design to after final average pooling position, so the final layer will only count 1 x 1 spatial resolution.
Overall, MobileNetV3 has two versions that consists of MobileNetV3-Large and MobileNetV3-Small. This work used the large one which still has less parameters and good accuracy at [10].
3.2.3 ShuffleNetV2
ShuffleNet V2 is the second edition of ShuffleNet which proposed channel split concept and switching channel shuffle to bottom block [11]. This concept is designed to reduce the cost of pointwise group convolutions and bottleneck structure.
Overall, the performance of the model from its authors shown 58% faster from MobileNet V2 and 63% faster from ShuffleNet V1.
3.2.4 EfficientNet B0
EfficientNet B0 is a sub-model of EfficientNet group which was introduced by Tan and Le [12]. The baseline of this model was built from a combination of MobileNet and ResNet. The compound scaling approach was proposed to scale up calculation stability of dimension, width, and resolution depth. By this approach, the layers can be stretched up or down automatically in getting receptive field and fine-grained based on the input images.
3.3 Evaluation
The research was divided into two versions of implementation, those consist of experiments on workstation and experiments on a mobile device. In the experiments of workstation, mainly, the authors implement pre-trained CNN models with two hyperparameter (Adam and SGD) and learning rate (0.01 and 0.001) to find the best accuracy on PC. Then, in the experiments on a mobile device, primarily, the authors chose the four best models to be tested on a mobile device.
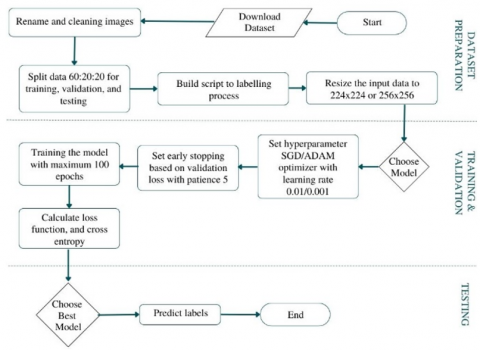
3.3.1 Experiments on a workstation
The experiments process supported by TensorFlow V2, TensorFlow-lite deep learning model, Python 3.7, and Visual Studio Code. The workflow in the experiments on workstation is illustrated by a flowchart that is shown in Figure 1.
Figure 1. Experiments process chart on workstation
The CNN model that has been trained was chosen based on the highest validation accuracy rate. Then, each model was saved in disk using “model.save()” function from TensorFlow. The experiments were carried out on a workstation which has the specifications that are shown in Table 2.
Table 2. The workstation specification
|
No |
Hardware |
Specification |
|
1 |
Memory |
16GB |
|
2 |
Processor |
Intel®Core™ i5-1035G1 @ 1.00GHz (8 CPUs) |
|
3 |
GPU |
NVIDIA GeForce MX250 |
|
4 |
Operating System |
Windows 10 Home 64-bit (19044) |
3.3.2 Experiments on a mobile device
In the beginning, the best trained models that saved by “model.save()” function was recalled to be converted into TensorFlow-lite (TFlite) models. The standard of converted TFlite models have default float32 version. This version needed to be optimized for reducing the storage size, less memory usage, and smaller download size without decreasing the accuracy. This work used float16 quantization because it provides minimal impact on accuracy and up to 50% model size reduction [26].
Then, the optimized TFlite models were carried out to predict the testing data on a workstation. Furthermore, the mobile application was built as a medium to read the TFlite models on a mobile device using kotlin language and android studio.
The experiments process on a mobile device is illustrated by a flowchart which is depicted in Figure 2.
Figure 2. Experiments chart on a mobile device
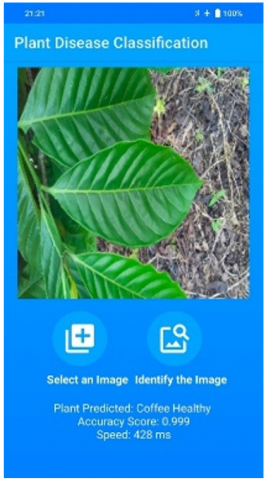
The application was used to evaluate model CNN on a mobile device illustrated in Figure 3.
There were ten repetitions to be tested on a mobile device for evaluating the resource requirements which consist of CPU, memory, and power consumption. The mobile battery was fully charged, on airplane mode, and restarted on every repetition to get the baseline and to ensure no other application are running. The numeric output data from the AccuBattery application, application to count resource requirements, during the testing on a mobile device was noted into excel. The experiments were carried out on a mobile device which has the specifications that are shown in Table 3.
Figure 3. Mobile application prototype
Table 3. The mobile device specification
|
No |
Hardware |
Specification |
|
1 |
Memory |
8GB |
|
2 |
Processor |
Qualcomm®Snapdragon™ 720G |
|
3 |
Battery Capacity |
4000mAh |
|
4 |
Operating System |
Funtouch OS 11.1 |
4.1 Experimental results on the model performance
The first experiment on the workstation was done in Jupyter notebook by running a script program that was distinguished on each model. The training and validation performance of each model trained was illustrated graphically in Figure 4 for training and validation loss and Figure 5 for training and validation accuracy.
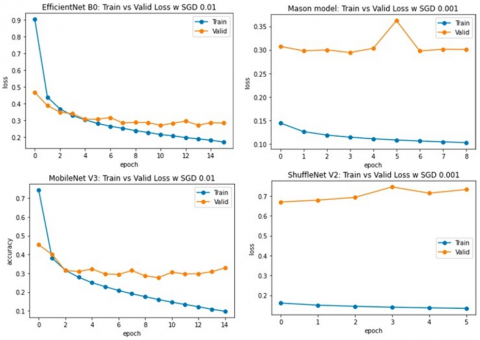
Figure 4. Training and Validation loss of each model
Figure 4 showed that MobileNetV3 has achieved the lowest training loss of 0.097 in epoch 15, followed by ShuffleNetV2 with the training loss of 0.098, Mason model of 0.103, and EfficientNetB0 of 0.171. Meanwhile, EfficientNetB0 has achieved the lowest validation loss of 0.284 in epoch 16, followed by Mason model of 0.301, MobileNetV3 of 0.328, and ShuffleNetV2 of 0.951.
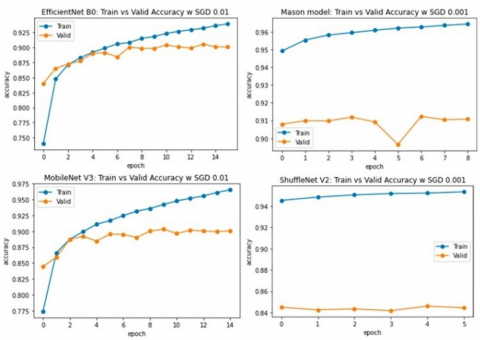
Figure 5. Training and Validation accuracy of each model
Figure 5 shows that the training and validation process of EfficientNet B0 stops at epoch 16 with the accuracy value of 0.9390 or 93.90% and a validation accuracy value of 0.9008 or 90.08%. While the training and validation process of MobileNet V3 stops at epoch 15 with an accuracy rate of 0.9655 or 96.55% and a validation rate of 0.9010 or 90.10%.
Then, Mason model achieved an accuracy value of 0.9644 or 96.44% and a validation value of 0.9108 or 91.08% at epoch 9. The last model, ShuffleNet V2 achieved an accuracy value of 0.9671 or 96.71% and a validation value of 0.8503 or 85.03% at epoch 5.
However, in these training and validation processes, the Mason model which has the fewest parameters is leading on the accuracy performance compared to other models. Then, overall, in the training and validation process, there is an indication of overfitting in the results obtained. However, when a maximum overfitting tolerance limit of seven percent is set, there are three out of four models that are not overfitting, namely EfficientNetB0, MobileNetV3, and Mason model.
The summary of hyperparameters used on each model which help to achieve the lowest validation loss is summarized in Table 4.
Table 4. Hyperparameters summary
|
Models |
Optimizers |
Learning rate |
|
EfficientNetB0 |
SGD |
0.01 |
|
MobileNetV3 |
SGD |
0.01 |
|
Mason model |
SGD |
0.001 |
|
ShuffleNetV2 |
SGD |
0.001 |
Table 4 shows that SGD optimizer gave better accuracy value of four models than Adam optimizer and both learning rates have equal percentage on this experiment. From this best specification, each model is converted to Tensorflow-lite version and optimized with float16 quantization in order to suit to the mobile device application.
Another experimental result is the accuracy per class that the model gets when tested on workstations and mobile devices. the configuration on workstations and mobile devices is slightly different due to the different programming languages used between workstations (python) and mobile devices (kotlin). However, the author tries to form the configuration as similar as possible between the two devices.
The experimental results showed that Mason model has a slight decrease in accuracy on the mobile device, such as apple powdery mildew, bean angular leaf spot, bean rust, cassava green mottle, coffee rust level 1, grape leaf blight, and soybean mosaic. Meanwhile, the slight increase in accuracy such as grape healthy and soybean southern blight. For the bad performance of classes or achieve null percentage such as rice gray leaf spot, rice healthy, soybean brown spot, and soybean mosaic.
Another model, EfficientNetB0 experienced a significant accuracy degradation on the mobile device such as pear curl and pear healthy. For the very poor performance of classes such as cassava green mottle, coffee red spider mite, coffee rust level 1-4, pear curl, pear healthy.
MobileNetV3 has a slight accuracy degradation on the mobile device such as soybean rust and soybean southern blight. Otherwise, the very poor performance of classes such as cassava bacterial blight, cassava green mottle, cassava healthy, coffee red spider mite, coffee rust level 1-4, rice gray leaf spot, soybean copper phytotoxicity, and soybean downy mildew.
ShuffleNetV2 has many classes which achieved very poor performance, consists of cassava bacterial blight, cassava green mottle, cassava healthy, coffee red spider mite, coffee rust level 1-4, cotton bacterial blight, pear curl, pear healthy, rice brown spot, rice gray leaf spot, rice healthy, rice leaf smut, soybean brown spot, soybean copper phytotoxicity, soybean downy mildew, and soybean mosaic. However, there two classes of soybean powdery mildew and soybean southern blight have a slight accuracy increase from workstation into mobile.
There are some of the same classes that cannot be identified by the four models in this study such as the class of coffee plants and rice plants. This can be due to the background or disturbance in the image that makes the focal point of the infected area in the image unfocused. For the average accuracy of each model, the average accuracy is summarized using weighted average and illustrated on Table 5.
Table 5. Weighted average performance of each model
|
Models |
Weighted Average |
|||||
|
Workstation |
Mobile Device |
|||||
|
Pre-cision |
Re-call |
F1-Score |
Pre-cision |
Re-call |
F1-Score |
|
|
Efficient-NetB0 |
0.90 |
0.91 |
0.90 |
0.89 |
0.89 |
0.89 |
|
Mobile-NetV3 |
0.91 |
0.90 |
0.90 |
0.90 |
0.89 |
0.89 |
|
Mason model |
0.91 |
0.91 |
0.91 |
0.90 |
0.91 |
0.90 |
|
Shuffle-NetV2 |
0.84 |
0.84 |
0.84 |
0.84 |
0.84 |
0.83 |
The four models, which have the highest validation accuracy, were converted into Tensorflow-lite (TF-lite) models. Then, each TF-lite model was tested with a testing dataset to measure the accuracy of each model. The comparation of the testing accuracy of each model between on the workstation and the mobile device is illustrated in Table 6.
Table 6. Summary of testing accuracy of tiny version of each model
|
Models |
Testing Accuracy |
|
|
Workstation |
Mobile Device |
|
|
EfficientNet B0 |
91.00 |
88.75 |
|
MobileNet V3 |
90.45 |
88.83 |
|
Mason model |
91.00 |
90.54 |
|
ShuffleNet V2 |
85.00 |
83.52 |
Table 6 shows that EfficientNetB0 and Mason model has the same testing accuracy on the workstation with 90%. Besides that, Mason model is slightly higher of testing accuracy than MobileNetV3 and EfficientNetB0 on the mobile device.
4.2 Experimental results on the resource requirements
The experiment for evaluating resource requirements start with measure the output file size of each model. The best model on workstation was converted to Tensorflow-lite version and optimized using float16 quantization. The size of each model between the mobile device and the workstation is shown in Table 7.
Table 7. Summary of file size of each model
|
Models |
Output File (MB) |
|
|
Workstation |
Mobile Device |
|
|
EfficientNet B0 |
20.40 |
16.08 |
|
MobileNet V3 |
20.20 |
16.85 |
|
Mason model |
1.64 |
0.85 |
|
ShuffleNet V2 |
16.77 |
15.89 |
Table 7 shows that Mason model achieved the lowest file size in Tensorflow-lite version, meanwhile, ShuffleNetV2 has around four MB lower than other three models. The lowest file size of Mason TF-lite model could be happened because the model has a simple architecture that generates small parameters. Meanwhile, the float16 quantization can optimized output file size one to four megabytes from workstation to the mobile device without a significant accuracy decreased.
Table 8. Resource requirement of each model
|
Resource Consump-tion |
Models |
|||
|
EfficientNetB0 |
MobileNetV3 |
Mason model |
Shuffle-NetV2 |
|
|
CPU Load Peak (%) |
31.90 |
31.50 |
20.30 |
18.50 |
|
Memory Peak (MB) |
214.11 |
202.07 |
229.35 |
178.99 |
|
Detection Speed Average (ms) |
181.67 |
60.31 |
184.63 |
173.69 |
|
Energy Reduction / hour (%) |
3.91 |
3.63 |
4.79 |
4.28 |
|
Battery Usage (%) |
0.56 |
0.49 |
0.54 |
0.69 |
|
Battery Usage (mAh) |
26.73 |
23.94 |
26.25 |
28.56 |
The other experiment results on the mobile device through an application were demonstrated in ten repetitions of 158 images which the images were picked randomly from testing dataset and predicted one by one. This experiment generated resource consumption that consists of CPU, memory, detection speed, and battery. The experimental results are illustrated in Table 8.
The results in Table 8 show that overall, MobileNetV3 is the lowest in all resource consumption object except CPU load peak and memory peak compared to the other three models. In the detail of experiments, the model which has the lowest CPU load was ShuffleNetV2 with 18.5% followed by Mason model of 20.3%, MobileNetV3 of 31.5%, and EfficientNetB0 of 31.9%.
While the highest memory peak, Mason model achieved 229.35 MB, followed by EfficientNetB0 with 214.11 MB, MobileNetV3 at 202.07 MB, and ShuffleNetV2 at 178.99 MB. On average speed while predicting plant diseases, MobileNetV3 was the fastest speed of 60.31ms with ShuffleNetV2 of 173.69ms, EfficientNetB0 of 181.67ms, and Mason model of 184.63.
Energy reduction per hour was the percentage decrease of battery capacity. Battery usage was the amount of battery when using an application. The lowest energy reduction when evaluated the models has been achieved by MobileNetV3 of 3.63%, followed by EfficientNetB0 with 3.91%, ShuffleNetV2 with 4.28%, and Mason model with 4.79%. Meanwhile, the lowest battery usage has been accomplished by MobileNetV3 with 0.56% or 23.94 mAh, Mason model with 0.54% or 26.25 mAh, EfficientNetB0 with 0.56% or 26.73 mAh, and ShuffleNetV2 with 0.69% or 28.56 mAh.
This research has evaluated four lightweight models with the transfer learning method which allows the training and validation process to be run on a workstation with low computational costs and has relatively standard specifications.
Based on the training and validation process, it can be concluded that EfficientNetB0 takes slightly longer with different one to eleven epochs with the assumption that one epoch takes three and a half hours compared to the other three models. Meanwhile, the output files after converted to Tensorflow-lite version using Float16 quantization for mobile devices showed that each model has a size decreased around one to four megabytes where the Mason model produces the smallest output file with under one megabyte.
In comparing the accuracy performance of each model on workstations and mobile devices, there is a decrease in accuracy in some specific classes and poor accuracy performance in some specific classes such as coffee plant and pear plant classes. Meanwhile, EfficientNetB0, MobileNetV3, and Mason models get almost the same and high testing accuracy from both workstations and mobile devices along with low loss. However, Mason model is still higher in accuracy than EfficientNetB0 and MobileNetV3 for mobile devices.
Besides that, in the training and validation process, there are indications of overfitting obtained in each model, but three of the four models can still be used, namely EfficienetNetB0, MobileNetV3, and Mason model if the overfitting tolerance limit set in this study is seven percent.
On the resource requirements, Mason model requires slightly higher resource consumption than MobileNetV3 which consumes the least detection time and battery, and ShuffleNetV2 which consumes the least CPU load and memory.
Based on the experimental design and research results, the authors conclude that the Mason model is the most recommended model to be implemented on mobile devices for building robust identification system with many variants of plant diseases with the advantages of high accuracy, low resource requirements, and small output file size.
For the future work, the models in this study still need to be improved in order to reduce the tolerance overfitting percentage if required around one to two percents by adding datasets with live capture of plant diseases with advanced preprocessing to focus the detail of main spot of the disease and also these model in this study can be used for another datasets to prove.
[1] Jadhav, S.B., Udupi, V.R., Patil, S.B. (2021). Identification of plant diseases using convolutional neural networks. International Journal of Information Technology (Singapore), 13(6): 2461-2470. https://doi.org/10.1007/s41870-020-00437-5
[2] Upadhyay, S.K., Kumar, A. (2022). A novel approach for rice plant diseases classification with deep convolutional neural network. international journal of Information Technology (Singapore), 14(1): 185-199. https://doi.org/10.1007/s41870-021-00817-5
[3] Sembiring, A., Away, Y., Arnia, F., Muharar, R. (2021). Development of concise convolutional neural network for tomato plant disease classification based on leaf images. Journal of Physics: Conference Series, 1845(1). https://doi.org/10.1088/1742-6596/1845/1/012009
[4] Atila, Ü., Uçar, M., Akyol, K., Uçar, E. (2021). Plant leaf disease classification using EfficientNet deep learning model. Ecological Informatics, 61: 101182. https://doi.org/10.1016/j.ecoinf.2020.101182
[5] Liu, B., Ding, Z., Tian, L., He, D., Li, S., Wang, H. (2020). Grape leaf disease identification using improved deep convolutional neural networks. Frontiers in Plant Science, 11: 1-14. https://doi.org/10.3389/fpls.2020.01082
[6] Syamsuri, B., Kusuma, G.P. (2019). Plant disease classification using lite pretrained deep Convolutional Neural Network on android mobile device. International Journal of Innovative Technology and Exploring Engineering, 9(2): 2796-2804. https://doi.org/10.35940/ijitee.b6647.129219
[7] Bimorogo, S.D., Kusuma, G.P. (2020). A comparative study of pretrained convolutional neural network model to identify plant diseases on android mobile device. International Journal of Advanced Trends in Computer Science and Engineering, 9(3): 2824-2833. https://doi.org/10.30534/ijatcse/2020/53932020
[8] Rimon, S.I., Islam, M.R., Dey, A., Das, A. (2022). PlantBuddy: An android-based mobile application for plant disease detection using deep Convolutional Neural Network. Lecture Notes in Electrical Engineering. Springer Nature Singapore, pp. 275-285. https://doi.org/10.1007/978-981-16-6448-9_28
[9] Masud, M., Muhammad, G., Hossain, M.S., Alhumyani, H., Alshamrani, S.S., Cheikhrouhou, O., Ibrahim, S. (2020). Light deep model for pulmonary nodule detection from CT scan images for mobile devices. Wireless Communications and Mobile Computing. https://doi.org/10.1155/2020/8893494
[10] Howard, A., Wang, W., Sandler, M., Zhu, Y., Chu, G., Pang, R., Chen, L., Vasudevan, V., Chen, B., Le, Q.V., Tan, M., Adam, H. (2019). Searching for MobileNetV3. In Proceedings of the IEEE/CVF International Conference on Computer Vision, pp. 1314-1324.
[11] Ma, N., Zhang, X., Zheng, H.T., Sun, J. (2018). Shufflenet v2: Practical guidelines for efficient cnn architecture design. In Proceedings of the European conference on computer vision (ECCV), pp. 116-131.
[12] Tan, M., Le, Q.V. (2019). EfficientNet: Rethinking model scaling for convolutional neural networks. In 36th International Conference on Machine Learning, ICML 2019, 2019-June, pp. 10691-10700.
[13] Hughes, D.P., Salathé, M. (2015). An open access repository of images on plant health to enable the development of mobile disease diagnostics. ArXiv Preprint ArXiv:1511.08060. https://doi.org/10.48550/arXiv.1511.08060
[14] Makerere University AI Lab. (2021). Cassava Leaf Disease Classification. https://www.kaggle.com/competitions/cassava-leaf-disease-classification.
[15] Thapa, R., Zhang, K., Snavely, N., Belongie, S., Khan, A. (2020). The plant pathology challenge 2020 data set to classify foliar disease of apples. Applications in Plant Sciences, 8(9): e11390.
[16] Parraga-Alava, J., Cusme, K., Loor, A., Santander, E. (2019). RoCoLe: A robusta coffee leaf images dataset for evaluation of machine learning based methods in plant diseases recognition. Data in Brief, 25: 104414. https://doi.org/10.1016/j.dib.2019.104414
[17] Kodors, S., Lacis, G., Sokolova, O., Zhukovs, V., Apeinans, I., Bartulsons, T. (2021). Apple scab detection using CNN and transfer learning. Agronomy Research, 19(2): 507-519. https://doi.org/10.15159/AR.21.045
[18] Singh, D., Jain, N., Jain, P., Kayal, P., Kumawat, S., Batra, N. (2020). PlantDoc: A dataset for visual plant disease detection. In Proceedings of the 7th ACM IKDD CoDS and 25th COMAD 2020 Jan 5, New York, United States, pp. 249-253. https://doi.org/10.1145/3371158.3371196
[19] Geetharamani, G., Pandian, A. (2019). Identification of plant leaf diseases using a nine-layer deep Convolutional Neural Network. Computers & Electrical Engineering, 76: 323-338. https://doi.org/10.1016/j.compeleceng.2019.04.011
[20] Noon, S.K., Amjad, M., Ali Qureshi, M., Mannan, A. (2021). Computationally light deep learning framework to recognize cotton leaf diseases. Journal of Intelligent & Fuzzy Systems, 40(6): 12383-12398. https://doi.org/10.3233/JIFS-210516
[21] Fenu, G., Malloci, F.M. (2021). DiaMOS plant: A dataset for diagnosis and monitoring plant disease. Agronomy, 11(11): 2107. https://doi.org/10.3390/agronomy11112107
[22] Barbedo, J.G.A., Koenigkan, L.V., Viera, B.A.H, Costa, R.V., Nechet, K.L., Godoy, C.V., Junior, M.L., Patricio, F.R.A, Talamini, V., Chitarra, L.G., Oliviera, S.A.S, Ishida, A.K.N, Fernandes, J.M.C, Santos, T.T., Cavalcanti, F.R., Terao, D., Angelotti, F. (2018). Annotated plant pathology databases for image-based detection and recognition of diseases. IEEE Latin America Transactions, 16(6): 1749-1757. https://doi.org/10.1109/TLA.2018.8444395
[23] Prajapati, H.B., Shah, J.P., Dabhi V.K. (2017). Detection and classification of rice plant diseases. Intelligent Decision Technologies, 11(3): 357-373. https://doi.org/10.3233/IDT-170301
[24] Rauf, H.T., Saleem, B.A., Lali, M.I.U., Khan, M.A., Sharif, M., Bukhari, S.A.C. (2019). A citrus fruits and leaves dataset for detection and classification of citrus diseases through machine learning. Data in brief, 26: 104340. https://doi.org/10.1016/j.dib.2019.104340
[25] Makerere University AI Lab. (2019). Cassava Leaf Disease Classification. Can be accessed in https://www.kaggle.com/competitions/cassava-disease/overview.
[26] Mugalu, B.W., Nakatumba-Nabende, J., Katumba, A., Babirye, C., Tusubira, F.J., Mutebi, C., Nsumba, S., Namanya, G. (2022). Makerere University Beans Image Dataset. https://www.kaggle.com/datasets/therealoise/bean-disease-dataset.