Amrendra Tripathi*![]() | Tanupriya Choudhury
| Tanupriya Choudhury![]()
© 2023 IIETA. This article is published by IIETA and is licensed under the CC BY 4.0 license (http://creativecommons.org/licenses/by/4.0/).
OPEN ACCESS
The automatic human Emotion Recognition (ER) based on Electroencephalography (EEG) signal has gained more attention among the researcher communities with a rapid growth of Human Computer Interaction (HCI). Most of the prior models have not focused on the context-information of the EEG signals. In this research manuscript, a novel automated model is implemented for improving ER using EEG signals. In the initial phase, the signals are acquired from an online database: Database for Emotion Analysis using Physiological Signal (DEAP). Then, the data denoising is carried-out by implementing Empirical Mode Decomposition (EMD) and Variational Mode Decomposition (VMD) filters. These filters aim in eliminating the artifacts and noises in the acquired raw EEG signals, and further, the feature extraction is carried-out utilizing 20 statistical features that extracts discriminative feature information from the decomposed EEG signals. In the last phase, the Long Short Term Memory network (LSTM) is used for human ER as arousal or valence. Additionally, the optimal hyper-parameters of the LSTM network are selected by proposing the Improved Rat Swarm Optimization Algorithm (IRSOA). As denoted in the resulting and discussion section, the IRSOA-LSTM network achieved a mean accuracy of 84.89%, sensitivity of 86.95%, specificity of 86%, precision of 83.68%, and f1-score of 85.28% on the DEAP database. The simulation outcomes state that the proposed IRSOA-LSTM network is better than the existing machine-learning models.
Electrocardiogram, emotion recognition, long short-term memory network, Rat Swarm Optimization Algorithm, Variational Mode Decomposition
In HCI, ER plays a vital role, where it enables machines in perceiving the human emotional mental state. The ER analyses the advantages, due to the progression of the computer-science, cognitive science, modern neuroscience and psychology fields [1, 2]. Especially, in the field of computer-science, the ER by the automated systems aims in enhancing the HCI over a wide range of applications like gaming, military, industrial, and clinical. The human-ER approaches are categorized into two types: (i) non-physiological signals: voice signal, body gesture, and facial expressions, (ii) physiological signals: Electromyogram (EMG), EEG and Electrocardiogram (ECG) signals [3, 4]. Among the available physiological signals, the EEG signal is the common approach used for human ER [5, 6], because it directly captures the brain cortex that effectively reflects the human mental states. The EEG based ER has gained increasing applications, due to the growth of EEG electrode techniques [7]. Usually, human emotions are categorized in two major ways, i.e., the dimension methods and the Discrete Basic Emotion Description (DBED) methods [8, 9]. In the DBED methods, the emotions are divided into six discrete emotions such as Joy, Disgust, Anger, Fear, Surprise and Sadness [10-12]. Further, the dimension method describes the human emotions into two-dimensional continuous forms like arousal and valence [13, 14]. In the present scenario, many automated models are implemented for ER in which deep learning models gained more attention among the researcher’s communities, because of its reliability and scalability [15, 16]. Therefore, a novel optimization based deep learning model is introduced in this research paper for enhancing the classification performance and solving the non-stationary characteristics of the EEG signals, this manuscript’s contributions are pointed below:
The research manuscripts related to EEG based emotion classification are surveyed in Section 2. The theoretical details, simulation outcomes, and the conclusion of the IRSOA-LSTM network is presented in Sections 3, 4, and 5.
A few literatures related to ER are reviewed in this section. Tan [17] have introduced a novel deep learning model: Spiking Neural Network (SNN) for human ER on the multi-modal database. The multi-modal data utilized in this literature were skin conductance, skin temperature, EEG, facial expressions, pupil size, mouth length, and respiration signals. The results show that the SNN model obtained comparable classification accuracy related to other deep learning models, but it was computationally complex.
Ullah et al. [18] have presented a novel ensemble-learning model to automatically compute the discriminative EEG channel subsets for ER. Here, the ensemble-learning model not only decreases the computational time and improves the classification accuracy and computational efficiency. Experiments conducted on the DEAP database demonstrated the efficacy of the ensemble-learning model over the prior models. However, the ensemble-learning model was expensive by means of memory space and time.
Krishna et al. [19] have introduced Tunable Q Wavelet Transformation (TQWT) technique to classify emotions utilizing EEG signals. In this research, the TQWT technique decomposes the raw EEG signals into sub-bands. Then, the features were extracted from the sub-bands by implementing the models like mobility, activity, shape factor, average-amplitude change, crest factor, clearance factor, log detector, absolute square root sum, root-mean square, and absolute sum. The extracted feature vectors were utilized as an input to the extreme learning machine for classifying the human emotions as Sad, Fear, Happy and Relax. Simulation results showed that the presented model obtained better 4-emotion classification-performance related to other existing models. Due to the inclusion of the several models, the computational complexity of the developed framework was higher.
Liu et al. [20] have developed a novel hybrid deep learning model for EEG based emotion classification, which integrates Convolutional Neural Network (CNN), sparse autoencoder, and Deep Neural Network (DNN). Initially, the CNN extracts discriminative deep features from the collected databases, and then, the encoding and decoding was performed on the extracted-features by utilizing a sparse autoencoder. Lastly, the redundant data were given as the input to the DNNs for emotion classification. Experiments carried-out on the DEAP database showed the effectiveness of the implemented hybrid deep learning model in ER. The hybrid deep learning model was computationally costly in the practical applications.
Zeng et al. [21] have implemented Sinc-Net for emotion classification, where it contains three DNN and convolutional layers. The simulation outcomes confirmed that the Sinc-Net converges more quickly than other conventional classifiers. But, the Sinc-Net required an enormous amount of training data, which was computationally costly.
Bajaj et al. [22] have developed a Flexible Analytic Wavelet-Transformation (FAWT) technique for classifying the human emotions as sad, relax, happy, and fear. The FAWT technique categorizes the EEG signals into sub-bands and further, the statistical features were employed to extract vectors from the sub-bands. Finally, the K-Nearest Neighbor (KNN) was implemented for emotion classification, where the KNN was effective in outlier removal, but it includes the issue of overfitting.
Kim and Choi [23] have presented an LSTM network with attention mechanisms for ER by using EEG signals. As a future extension, the presented LSTM network needed to concentrate on class-imbalance problems.
Chakladar and Chakraborty [24] have integrated Higher Order Statistics (HOS) with the correlation-based subset selection for dimensionality reduction in order to obtain better results in ER. In this literature, the emotions were classified into four classes: Harmony, Angry, negative and positive. Still, the implemented model needed to concentrate on the non-linear data by implementing a kernel-based Support Vector Machine (SVM).
Yin, et al. [25] have integrated LSTM and Graph CNN (GCNN) for ER. In the developed framework, the GCNNs was applied for extracting graph-domain vectors, and the LSTM network was utilized for memorizing the relationship between the extracted temporal vectors. In this study, the dense layer was utilized for obtaining the emotion classification results. Experiments-conducted on the DEAP database demonstrated that the developed model achieved better classification results than the existing methods. In this literature study, over-fitting and vanishing gradients were the main concerns faced by the researchers.
Subasi et al. [26] have implemented a new light-weighted human ER framework. First, the Multi-Scale Principal Component Analysis (MSPCA) and Discrete Wavelet Transformation (DWT) technique were employed for artifacts-removal. Further, the TQWT and six statistical techniques were implemented for feature extraction and dimensionality reduction. Finally, the human ER was accomplished utilizing several machine-learning classifiers in that rotation forest ensemble with SVM classifier has attained higher classification results than other classifiers. However, the trade-off between the information loss and dimensionality reduction was a main problem in the MSPCA technique.
Salankar et al. [27] initially used EMD technique for signal decomposition and then the feature extraction was accomplished by implementing 2nd order difference plots. Further, Wilcoxon test was carried-out for ensuring the statistical implication of the extracted features with p-value less than 0.05. Lastly, the multi-class and binary-class classification was carried-out by implementing two hidden layer Multilayer Perceptron’s (MLP) and SVM. Hence, the developed model’s efficacy was validated using statistical measures like accuracy, specificity and classification accuracy. However, the MLP was sensitive to feature scaling and requires a hyper-parameters tuning by means of iteration number, neurons and number of hidden layers.
Gao et al. [28] have initially performed feature extraction using Power Spectral Density (PSD), sample entropy, differential entropy, Hjorth feature and GoogleNet. The extracted spatial and contextual feature information were fed to the SVM for classifying the human emotions. As indicated earlier, the SVM supports only binary-classification and it was inappropriate for multi-class ER.
Sharma et al. [29] have combined a deep learning model with HOS for automatic ER. In addition, Yang et al. [30] developed a CNN model for ER using EEG signals. The deep learning models were computational costly, where it needed high-end systems in order to achieve significant classification performance.
Mert and Akan [31] have integrated Multivariate EMD (MEMD) with the frequency domain features like PSD, Hjorth parameters, power ratio, and entropy for ER as arousal or valence. In addition, Song et al. [32] have implemented a dynamic GCNN model for multi-channel EEG based emotion classification. The extensive experimental investigation confirmed that the dynamic-GCNN model achieved superior recognition performance than the existing models. However, the developed dynamic GCNN model comprises two main issues such as vanishing gradients and overfitting.
Chen et al. [33] have combined EMD with approximation entropy for signal decomposition and feature extraction. The extracted feature values were given as the input to the hybrid classification model: SVM + Deep Belief Networks (DBN) to classify emotions as fear, sad, calm, and happy. However, the DBN model was computationally costly, because it needs a huge amount of data to perform superior classification.
Chao et al. [34] used Capsule Networks (CapsNet) for ER by utilizing EEG signals. In the practical application, the presented CapsNet model was computationally expensive. Zhang et al. [35] integrated kernel matrix with DNNs for ER. The extensive experimental analysis showed that the presented model effectively captures the relation between multi-model physiological EEG signals that gains better recognition results. Pan et al. [36] have used Wavelet packet entropy, Fuzzy entropy, Sample entropy, and approximate entropy for feature extraction. The extracted features were given to the ensemble machine classification technique that integrates SVM, extreme learning machine and decision tree for emotion classification. The integration of numerous machine-learning classifiers was computationally complex.
To address aforementioned issues, a new framework is introduced in the present research manuscript for effective emotion classification using EEG signals.
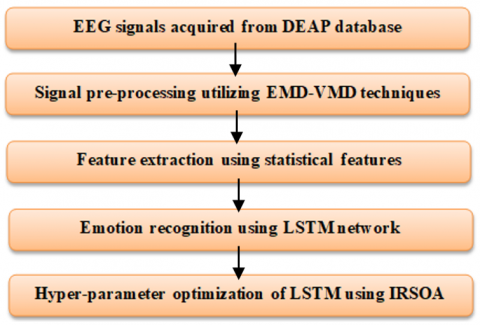
In the EEG based emotion classification, the developed framework includes four phases such as signal collection: DEAP, pre-processing: EMD-VMD techniques, feature-extraction: 20 statistical features, ER: IRSOA- LSTM network. The block-diagram of the developed framework is depicted in Figure 1.
Figure 1. Block-diagram of the developed framework
3.1 Database description
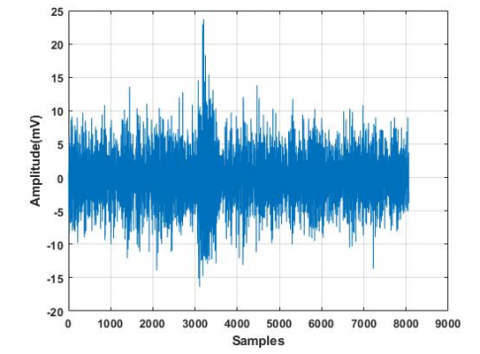
The proposed IRSOA-LSTM network’s efficacy is validated on an online DEAP database. It has 32 subjects’ physiological EEG signals, and the subjects rated every video in light of the valence and arousal levels. Out of 32 subjects, 22 subject’s physiological EEG signals are recorded with frontal facial videos. In the DEAP database, the EEG signals have sampling frequency of 512 Hz, which are recorded from 32 dissimilar locations such as O1, Fp1, AF4, FC2, CP5, FC1, Fp2, PO3, PO4, Fz, FC6, O2, CP1, CP2, Cz, T8, FC5, F4, C4, Oz, CP6, AF3, T7, P4, F8, P7, F3, P3, Pz, P8, C3, and F7. Some statistical information of the DEAP database is represented as follows: sampling-rate is 512 Hz frequency, number of subjects and channels is 32, labels are arousal and valence, and number of videos is 40 [37]. The DEAP database content summary (physiological experiments and online subjective annotations) is stated in Table 1. In addition to this, the sample DEAP database signals are denoted in Figure 2.
DEAPdatabase: https://www.eecs.qmul.ac.uk/mmv/datasets/deap/.
Figure 2. Sample acquired EEG signals
Table 1. Content summary of the DEAP database
|
Physiological experiments |
|
|
Rating values |
Familiarity: discrete scale ranges from 1 to 5 and others: continuous scale ranges from 1 to 9 |
|
Rating scales |
Valence and arousal |
|
Number of videos |
40 |
|
Number of subjects |
32 |
|
Recorded signals |
Facial videos (22 subjects), 32-channels, and 512 Hz physiological EEG signals |
|
Online subjective annotations |
|
|
Rating values |
Discrete scale ranges from 1 to 9 |
|
Rating scales |
Valence and arousal |
|
Number of ratings per video |
14 to 16 |
|
Selection approach |
60 manually selected and 60 selected via affective tags |
|
Video duration |
One minute |
|
Number of videos |
120 |
3.2 Pre-processing and feature extraction
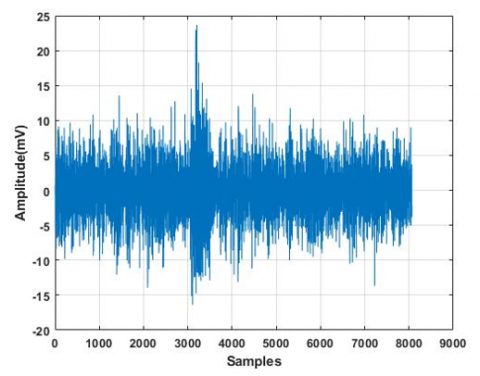
Figure 3. Sample-decomposed EEG signal of EMD technique
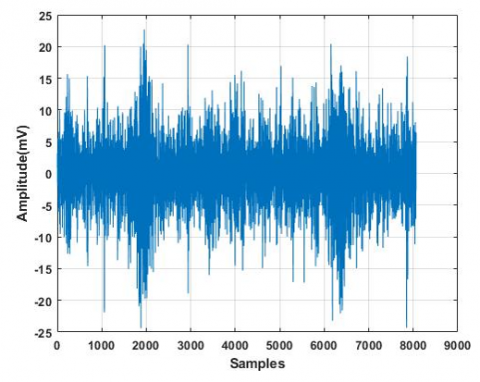
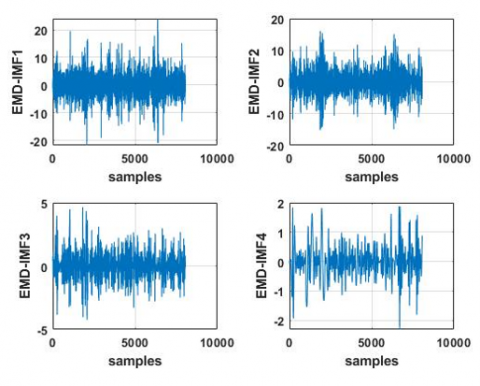
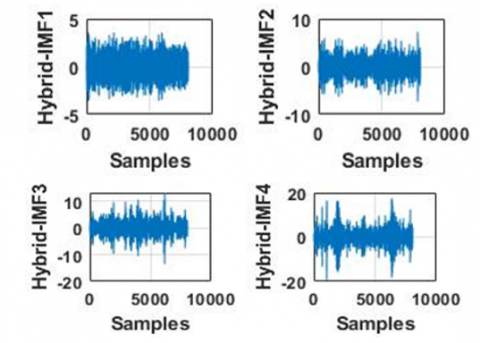
After acquiring the EEG signals from the DEAP database, the EMD/VMD are utilized for decomposing the non-static and non-linear signals to remove unwanted noise and artifacts. In the initial step, the EMD categorizes the collected EEG signals into many Inherent Functions (IMFs). Each IMF is utilized as a sub-band signal, which is utilized for decomposing the sub-strip signal. The EMD splits the EEG signals into two dissimilar types of frequencies like low and high frequencies. The filter recognizes the wave pattern in the high frequency that sharps the wave edges. The wave will be clearer and understandable for the classifiers after applying the smoothing filters; also, there will be no data loss [38, 39]. The sample-decomposed signal of EMD technique is depicted in Figure 3. In addition, the VMD splits the collected EEG signals into several modes (sub-signals). The Hilbert transformation technique is applied on every mode in VMD for measuring the mode’s frequency ranges and unilateral spectrum of frequencies [40]. The modes frequency range is transferred to a measured middle frequency by integrating it with the exponential [41]. In this study, the Gaussian smoothness of the demodulated signal is used for measuring Bandwidth. Both EMD-VMD filters result in the denoised signal, which is cleaned from noise, artifacts, and outside effects during recording. The sample-decomposed signal of hybrid technique is represented in Figure 4. Next, the hybrid feature extraction is carried-out to extract vectors from the cleaned signals. In this reaserch manuscript, the hybrid feature extraction includes statistical techniques: hjorth activity, band power theta, sample entropy, hjorth mobility, hjorth complexity, shannon entropy, standard deviation, band power gamma, variance, band power delta, mean-curve-length, normalized first difference, auto-regressive model, band power beta, zero cross rate, mean teager energy, band power alpha, ratio band power alpha beta, minimum, and maximum [42]. In the two dimensional emotion classification, the hybrid feature extraction extracts feature length of 74 in both arousal and valence classes. The hybrid feature extraction includes the benefits like accuracy improvement, over-fitting risk reduction, improved data-visualization and speed up the training process of LSTM network.
Figure 4. Sample-decomposed EEG signal of hybrid: EMD+VMD technique
3.3 Emotion classification
The extracted feature length of 74 in both arousal and valence classes are given to the LSTM network for two-dimensional emotion classification. Compared to other classification-techniques, the LSTM network has the capability in retaining important information, and has the benefit of managing long-term dependence by performing a self-feedback method. Here, the memory cells in the LSTM network have three gates: output, forget, and input that stores the information to manage long-term problems. The steps involved in the LSTM network are listed as follows:
$\widetilde{g_t}=\tanh \left(W_g \times\left[h_{t-1}, x_t\right]+b_g\right)$ (1)
$i_t=\sigma\left(W_i \times\left[h_{t-1}, x_t\right]+b_i\right)$ (2)
$f_t=\sigma\left(W_i \times\left[h_{t-1}, x_t\right]+b_f\right)$ (3)
$g_t=f_t \times g_{t-1}+i_t \times \widetilde{g_t}$ (4)
$o_t=\sigma\left(W_0 \times\left[h_{t-1}, x_t\right]+b_0\right)$ (5)
$h_t=o_t \times \tanh \left(g_t\right)$ (6)
The LSTM network reset, read, and easily update the long-term information by using the control gates and memory cell that helps in achieving superior two-dimensional emotion classification [43]. The parameter settings of the LSTM are indicated as follows: maximum epochs is 100, gradient decay factor is 0 to 1, initial learning rate is 0.001 to 0.01, minimum batch size is 27, optimizer is adam, gradient threshold is 1, execution environment is auto and L2- regularization is 0.1. These hyper-parameters of the LSTM network are selected by using IRSOA.
3.3.1 Hyper-parameter optimization
In recent decades, the RSOA is an effective metaheuristic optimization technique, which mimics the attacking and following rat behaviours. In the RSOA, the aggressive and following rat actions are modelled for performing hyper-parameter optimization. The RSOA starts with a random solution similar to other population based metaheuristic optimization techniques. In this technique, the rat’s position is considered as a random solution in the search space and it is repeatedly evaluated by an objective function and improved on the basis of aggressive and following rat behaviours [44]. In the RSOA, the initial positions of the eligible solutions (rat’s positions) are randomly estimated in the search space, and it is mathematically represented in Eq. (7).
$x_i=x_{i \min }+\operatorname{rand} \times\left(x_{i \max }-x_{i \min }\right), i=1,2, \ldots N$ (7)
where, $x_{i \max }$ and $x_{i \min }$ states the upper and lower bounds of the $i^{\text {th }}$ variable and $N$ denotes total agents. Hence, the attacking procedure of the rat is mathematically modelled in Eq. (8) that generates the updated rat’s positions.
$\vec{P}_i(x+1)=\left|\vec{P}_r(x)-\vec{P}\right|$ (8)
where, $P^{\prime}_i(x+1)$ states updated positions of the $i^{\text {th }}$ rats, and $\vec{P}_r(x)$ indicates the best optimal solution. The term $P^{\prime}$ is computed by utilizing Eq. (9).
$\vec{P}=A \times \vec{P}_i(x)+C \times\left(\vec{P}_r(x)-\vec{P}_i(x)\right)$ (9)
where, $\vec{P}_i(x)$ indicates the position of $i^{t h}$ rats, and the parameters $A$ and $C$ are computed by utilizing Eqns. (10) and (11)
$A=R-x \times\left(\frac{R}{\text { Iter }_{\max }}\right), x=1,2,3, \ldots$ $Iter _{\max }$ (10)
$C=2 \times$ rand (11)
where, Iter $_{\text {max }}$ denotes maximum iteration, $x$ represents current iteration, $R$ denotes random number $[1,5]$, and $C$ indicates random number $[0,2]$. The parameters assumed in the RSOA are listed as follows: population size is 30 , maximum iteration is 100 , and dimension is 4 .
To further improve the effectiveness and optimization performance of RSOA, an improved version of this optimization technique is implemented based on the opposition-based learning concept. As indicated earlier, the RSOA is one of the effective population-based optimization techniques, where it initially sets the random solutions, and then improves the results towards the best solutions. The random initialization technique is utilized for generating the candidate solutions based on Eq. (7) in the absence of previous knowledge about the solution. The convergence speed and its performance are directly proportional to the distance between the best solutions and the initial solutions. If the randomly generated solution has a limited value of the objective function, the RSOA has better optimization performance.
Based on this idea, an improved version of this technique is proposed named IRSOA for improving the convergence speed and the change of identifying the global optimal solution of the traditional RSOA. In the IRSOA, the opposite positions of every solution are computed on the basis of the opposite number concept. It is essential to define the opposite number concept for describing the new population initialization. N-dimensional vector X is mathematically depicted in Eq. (12).
$X=\left(x_1, x_2, \ldots, x_N\right)$ (12)
where, $x_i \in\left[x i_{\text {min }}, x_{\text {imax }}\right]$, and the opposite point of $x_i$ is represented as $\bar{x}_i$ and it is mentioned in Eq. (13).
$\bar{x}_i=\left(x_{\text {imax }}, x_{\text {imin }}\right)-x_i, i=1,2, \ldots, N$ (13)
On the other hand, the worst solution is replaced by a new solution based on Eq. (14) for increasing the search capability and exploration in the IRSOA at every iteration.
$x_{\text {worst }}=\left\{\begin{array}{cc}\operatorname{rand}_1 \times \vec{P}_r(x), & \text { if } \operatorname{rand}_3 \leq 0.5 \\ \left(x_{\text {imax }}-x_{\text {imin }}\right)-x_i, & \text { if } \operatorname{rand}_3>0.5\end{array}\right.$ (14)
where, $\operatorname{rand}_1, \operatorname{rand}_2$, and $\mathrm{rand}_3$ are denoted as the random numbers, which range between 0 to 1 , and $x_{\text {worst }}$ indicate the solution with a higher value of the objective function. Hence, the following concepts improve the hyper-parameter optimization results by exchanging the position vectors of the least ranked rats with the best solutions achieved so far $\vec{P}_r(x)$ in every generation.
The IRSOA-LSTM network is simulated by using Matlab R2020b with Intel core i7 10th generation processor and 16 GB RAM. In this study, the IRSOA-LSTM network effectiveness is analysed using different evaluation metrics like sensitivity, precision, f1-score, specificity and classification accuracy. Generally, the specificity evaluates the implemented IRSOA-LSTM network’s ability in predicting true- negatives of every category. Similarly, the sensitivity evaluates the IRSOA-LSTM network’s ability in predicting true positives of every available category. In binary classification (valence and arousal), the f1-score is a measure of test accuracy, and it is stated as a harmonic mean value of recall and precision. In the EEG-based ER, the evaluation metric: accuracy directly reflects the proposed IRSOA-LSTM networks efficiency. On the other hand, the evaluation metric: precision is determined as the ratio of total positive observations to the total observations that are accurately classified as positive. Mathematical-formula of the undertaken evaluation metrics is depicted in Eqns. (15) and (19).
Accuracy $=\frac{T N+T P}{T N+T P+F P+F N} \times 100$ (15)
Precision $=\frac{T P}{T P+F P} \times 100$ (16)
Sensitivity $=\frac{T P}{T P+F N} \times 100$ (17)
Specificity $=\frac{T N}{T N+F P} \times 100$ (18)
$F 1-s c o r e=\frac{2 T P}{2 T P+F P+F N} \times 100$ (19)
where, False Positive is stated as FP, True Positive is denoted as TP, False Negative is stated as FN, and True Negative is indicated as TN.
4.1 Quantitative investigation on the DEAP database
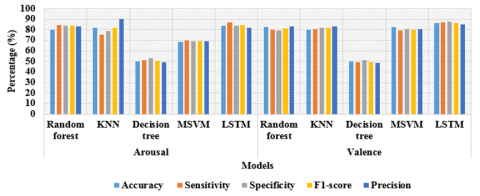
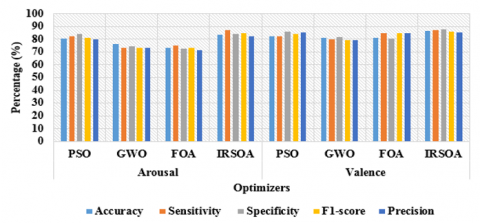
In this section, the simulation results of the proposed IRSOA-LSTM network are tested on the DEAP database. The results are validated with five-fold cross validation technique (20% testing and 80% training). By viewing Table 2, the IRSOA-LSTM network has high results than the comparative machine learning classifiers such as random forest, decision-tree, KNN, and Multi-SVM (MSVM). Here, the experimental results are evaluated for individual classes such as valence and arousal. As denoted in Table 2, the IRSOA-LSTM network has 83.54% of classification accuracy, 86.99% of sensitivity, 84.10% of specificity, 84.45% of f1-score, and 82.05% of precision in arousal-class. Additionally, the IRSOA-LSTM network has 86.25% of classification accuracy, 86.92% of sensitivity, 87.91% of specificity, 86.11% of f1-score, and 85.31% of precision in valence-class. The attained simulation result of the proposed IRSOA-LSTM network is better related to the conventional machine learning models. The extensive experimental results shows that the proposed IRSOA-LSTM network effectively minimized the information loss. Graphical analysis of the proposed IRSOA-LSTM network and other comparative classifiers is depicted in Figure 5. By viewing Table 3, the proposed IRSOA-LSTM network has achieved higher classification results related to other meta-heuristic optimization techniques: Grey Wolf Optimizer (GWO), Particle Swarm Optimizer (PSO) and Firefly Optimization Algorithm (FOA). In both classes: arousal and valence, the proposed IRSOA-LSTM network attained higher classification score related to other optimizers. In arousal-class, the IRSOA-LSTM network has achieved 83.54% of accuracy, 86.99% of sensitivity, 84.10% of specificity, 84.45% of f1-score, and 82.05% of precision. In valence-class, the IRSOA-LSTM network has achieved 86.25% of classification accuracy, 86.92% of sensitivity, 87.91% of specificity, 86.11% of f1-score, and 85.31% of precision. On the other hand, the selection of optimal hyper-parameters by IRSOA effectively reduces the training time of the LSTM. The proposed IRSOA-LSTM network consumed 34.5 seconds of computational time, which is limited related to other classification techniques.
Table 2. Results of the proposed IRSOA-LSTM network and other comparative classifiers
|
Classes |
Classifiers |
Accuracy (%) |
Sensitivity (%) |
Specificity (%) |
F1-score (%) |
Precision (%) |
|
Arousal |
Random forest |
80.13 |
84.67 |
83.92 |
83.76 |
82.86 |
|
KNN |
81.65 |
75.59 |
79 |
82.20 |
90.08 |
|
|
Decision tree |
50 |
51.51 |
53.08 |
50.38 |
49.30 |
|
|
MSVM |
68.44 |
69.74 |
69.07 |
69.29 |
68.85 |
|
|
LSTM |
83.54 |
86.99 |
84.10 |
84.45 |
82.05 |
|
|
Valence |
Random forest |
82.81 |
80.01 |
79.60 |
81.56 |
83.16 |
|
KNN |
80.17 |
80.86 |
81.95 |
82.02 |
83.22 |
|
|
Decision tree |
50 |
49.27 |
51 |
49.11 |
48.95 |
|
|
MSVM |
82.29 |
79.37 |
80.68 |
79.88 |
80.38 |
|
|
LSTM |
86.25 |
86.92 |
87.91 |
86.11 |
85.31 |
Figure 5. Graphical analysis of the proposed IRSOA-LSTM network and other comparative classifiers
Table 3. Results of the proposed IRSOA-LSTM network and other hyper-parameter optimizers
|
Classes |
Optimizers |
Accuracy (%) |
Sensitivity (%) |
Specificity (%) |
F1-score (%) |
Precision (%) |
|
Arousal |
PSO |
80.57 |
82.28 |
84.01 |
81.18 |
80.12 |
|
GWO |
76.44 |
73.43 |
74.22 |
73.27 |
73.10 |
|
|
FOA |
73.45 |
74.86 |
72.55 |
73.12 |
71.47 |
|
|
IRSOA |
83.54 |
86.99 |
84.10 |
84.45 |
82.05 |
|
|
Valence |
PSO |
82.32 |
82.50 |
85.93 |
83.92 |
85.38 |
|
GWO |
80.95 |
79.77 |
81.83 |
79.56 |
79.35 |
|
|
FOA |
81.18 |
84.60 |
80.44 |
84.51 |
84.43 |
|
|
IRSOA |
86.25 |
86.92 |
87.91 |
86.11 |
85.31 |
Figure 6. Graphical analysis of the proposed IRSOA-LSTM network and other hyper-parameter optimizers
Table 4. Results of the proposed model for four classes
|
Classifiers |
Accuracy (%) |
Sensitivity (%) |
Specificity (%) |
F1-score (%) |
Precision (%) |
|
Random forest |
83.25 |
85.54 |
82.69 |
84.55 |
85.49 |
|
KNN |
82.46 |
79.72 |
81.28 |
83.14 |
80.42 |
|
Decision tree |
54.98 |
52.97 |
52.99 |
55.05 |
52.75 |
|
MSVM |
70.38 |
71.36 |
72.33 |
69.91 |
74.89 |
|
LSTM |
88.42 |
89.22 |
85.05 |
88.65 |
89.45 |
The assumed parameters of PSO are: dimension is 4, maximum iteration is 100, population size is 30, threshold is 0.5, inertia weight is 0.9, social factor is 2, and cognitive factor is 2. In addition, the assumed hyper-parameters of GWO are: threshold is 0.50, maximum iteration is 100, dimension is 4 and population size is 30. The following parameters are considered in the FOA: threshold is 0.5, dimension is 4, alpha is 1, theta is 0.97, gamma is 1, population size is 30, beta is 1, and maximum iteration is 100. The graphical analysis of the proposed IRSOA-LSTM network and other comparative hyper-parameter optimizers is specified in Figure 6.
In addition, the results of the proposed and the comparative classifiers for four classes (Arousal low, valence low, valence high, and Arousal high) are depicted in Table 4. As represented in Table 4, the proposed IRSOA-LSTM network has maximum results related to the comparative classifiers by means of sensitivity, precision, f1-score, specificity and classification accuracy. Here, the LSTM network provides an enormous range of parameters like input biases, learning rates and output biases, where it does not require any fine-adjustments. This is the reason behind the LSTM network to achieve higher classification results than the existing classifiers.
4.2 Comparative investigation
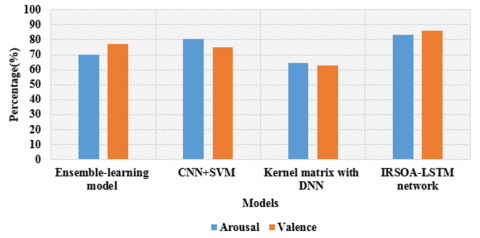
The comparative results between the proposed IRSOA-LSTM network and the existing models is represented in Table 5. H. Ullah et al. [18] introduced an ensemble-learning model for computing the discriminative EEG channel subset for ER. The extensive experiments demonstrated that the ensemble-learning model attained 77.40% and 70.10% of classification accuracy in the valence and arousal classes. Gao et al. [28] have performed hybrid feature extraction: PSD, sample entropy, differential entropy, Hjorth feature and GoogleNet for extracting discriminative feature vectors. Then, the two-dimensional emotion classification was carried-out using the SVM classifier. The simulation outcome demonstrated that the CNN+SVM model obtained 75.22% and 80.52% of accuracy in the valence and arousal classes. Zhang et al. [35] have combined a kernel matrix with DNNs for ER. The extensive experimental investigation showed that the Kernel matrix with DNN model obtained 63.10% and 64.50% of accuracy in the valence and arousal classes. In the two-dimensional ER, the IRSOA-LSTM attained superior performance compared to these traditional models with the accuracy of 83.54% and 86.25%, which is graphically specified in Figure 7.
Figure 7. Graphical diagram of comparative results between the proposed IRSOA-LSTM network and the existing models
Table 5. Comparative results between the proposed IRSOA-LSTM network and the existing models
|
Models |
Classification accuracy (%) |
|
|
Arousal |
Valence |
|
|
Ensemble-learning model [18] |
70.10 |
77.40 |
|
CNN+SVM [28] |
80.52 |
75.22 |
|
Kernel matrix with DNN [35] |
64.50 |
63.10 |
|
IRSOA-LSTM network |
83.54 |
86.25 |
In this research, a novel IRSOA-LSTM network is implemented for effective EEG-based emotion classification. In recent decades, classifying human emotions based on EEG signals has been a complex application. In this research, an online DEAP database is used for finding and classifying human emotions. The developed IRSOA-LSTM network includes four major-steps such as pre-processing, feature extraction, classification, and optimization. In the signal pre-processing segment, two dissimilar methods are utilized, which includes EMD and VMD for eliminating noise from the raw EEG signals in order to retrieve best possible detail. Next, around 20 statistical feature extraction techniques are used for obtaining refined data (feature-values). In the last phase, the refined data are fed as the input to the LSTM for classifying and defining human feelings: arousal and valence, and further, the optimum hyper-parameters are selected by proposing IRSOA. As represented in the resulting segment, the proposed IRSOA-LSTM network’s performance is evaluated by utilizing numerous valuation measures. The obtained simulation result states that the proposed IRSOA-LSTM network has achieved mean accuracy of 84.89%, sensitivity of 86.95%, specificity of 86%, f1-score of 85.28%, and precision of 83.68%. In addition, the proposed IRSOA-LSTM network is effective by means of processing time. In future work, the developed IRSOA-LSTM network is evaluated on other databases for e-learner’s emotion classification. The real time alternative databases give more insights in ER.
[1] Alhalaseh, R., Alasasfeh, S. (2020). Machine-learning-based emotion recognition system using EEG signals. Computers, 9(4): 95. https://doi.org/10.3390/computers9040095
[2] Nandi, A., Xhafa, F., Subirats, L., Fort, S. (2021). Real-time emotion classification using EEG data stream in e-learning contexts. Sensors, 21(5): 1589. https://doi.org/10.3390/s21051589
[3] Wang, K., Guo, P. (2020). An ensemble classification model with unsupervised representation learning for driving stress recognition using physiological signals. IEEE Transactions on Intelligent Transportation Systems, 22(6): 3303-3315. https://doi.org/10.1109/TITS.2020.2980555
[4] Tan, C., Šarlija, M., Kasabov, N. (2021). NeuroSense: Short-term emotion recognition and understanding based on spiking neural network modelling of spatio-temporal EEG patterns. Neurocomputing, 434: 137-148. https://doi.org/10.1016/j.neucom.2020.12.098
[5] Tuncer, T., Dogan, S., Subasi, A. (2021). A new fractal pattern feature generation function based emotion recognition method using EEG. Chaos, Solitons & Fractals, 144: 110671. https://doi.org/10.1016/j.chaos.2021.110671
[6] Yang, J., Huang, X., Wu, H., Yang, X. (2020). EEG-based emotion classification based on bidirectional long short-term memory network. Procedia Computer Science, 174: 491-504. https://doi.org/10.1016/j.procs.2020.06.117
[7] Bălan, O., Moise, G., Petrescu, L., Moldoveanu, A., Leordeanu, M., Moldoveanu, F. (2019). Emotion classification based on biophysical signals and machine learning techniques. Symmetry, 12(1): 21. https://doi.org/10.3390/sym12010021
[8] Islam, M.R., Moni, M.A., Islam, M.M., Rashed-Al-Mahfuz, M., Islam, M.S., Hasan, M.K., Lió, P. (2021). Emotion recognition from EEG signal focusing on deep learning and shallow learning techniques. IEEE Access, 9: 94601-94624. https://doi.org/10.1109/ACCESS.2021.3091487
[9] Hu, J., Wang, C., Jia, Q., Bu, Q., Sutcliffe, R., Feng, J. (2021). ScalingNet: extracting features from raw EEG data for emotion recognition. Neurocomputing, 463, 177-184. https://doi.org/10.1016/j.neucom.2021.08.018
[10] An, Y., Xu, N., Qu, Z. (2021). Leveraging spatial-temporal convolutional features for EEG-based emotion recognition. Biomedical Signal Processing and Control, 69: 102743. https://doi.org/10.1016/j.bspc.2021.102743
[11] Liu, Y., Fu, G. (2021). Emotion recognition by deeply learned multi-channel textual and EEG features. Future Generation Computer Systems, 119: 1-6. https://doi.org/10.1016/j.future.2021.01.010
[12] Song, T., Zheng, W., Liu, S., Zong, Y., Cui, Z., Li, Y. (2021). Graph-embedded convolutional neural network for image-based EEG emotion recognition. IEEE Transactions on Emerging Topics in Computing, 10(3): 1399-1413. https://doi.org/10.1109/TETC.2021.3087174
[13] Shen, F., Peng, Y., Kong, W., Dai, G. (2021). Multi-scale frequency bands ensemble learning for EEG-based emotion recognition. Sensors, 21(4): 1262. https://doi.org/10.3390/s21041262
[14] Pandey, P., Seeja, K.R. (2022). Subject independent emotion recognition from EEG using VMD and deep learning. Journal of King Saud University-Computer and Information Sciences, 34(5): 1730-1738. https://doi.org/10.1016/j.jksuci.2019.11.003
[15] Liu, Y., Ding, Y., Li, C., Cheng, J., Song, R., Wan, F., Chen, X. (2020). Multi-channel EEG-based emotion recognition via a multi-level features guided capsule network. Computers in Biology and Medicine, 123: 103927. https://doi.org/10.1016/j.compbiomed.2020.103927
[16] Koelstra, S., Muhl, C., Soleymani, M., Lee, J.S., Yazdani, A., Ebrahimi, T., Patras, I. (2011). Deap: A database for emotion analysis; using physiological signals. IEEE transactions on affective computing, 3(1): 18-31. https://doi.org/10.1109/T-AFFC.2011.15
[17] Tan, C., Ceballos, G., Kasabov, N., Puthanmadam Subramaniyam, N. (2020). Fusionsense: Emotion classification using feature fusion of multimodal data and deep learning in a brain-inspired spiking neural network. Sensors, 20(18): 5328. https://doi.org/10.3390/s20185328
[18] Ullah, H., Uzair, M., Mahmood, A., Ullah, M., Khan, S. D., Cheikh, F.A. (2019). Internal emotion classification using EEG signal with sparse discriminative ensemble. IEEE Access, 7: 40144-40153. https://doi.org/10.1109/ACCESS.2019.2904400
[19] Krishna, A.H., Sri, A.B., Priyanka, K.Y.V.S., Taran, S., Bajaj, V. (2019). Emotion classification using EEG signals based on tunable-Q wavelet transform. IET Science, Measurement & Technology, 13(3): 375-380. https://doi.org/10.1049/iet-smt.2018.5237
[20] Liu, J., Wu, G., Luo, Y., Qiu, S., Yang, S., Li, W., Bi, Y. (2020). EEG-based emotion classification using a deep neural network and sparse autoencoder. Frontiers in Systems Neuroscience, 14: 43. https://doi.org/10.3389/fnsys.2020.00043
[21] Zeng, H., Wu, Z., Zhang, J., Yang, C., Zhang, H., Dai, G., Kong, W. (2019). EEG emotion classification using an improved SincNet-based deep learning model. Brain sciences, 9(11): 26. https://doi.org/10.3390/brainsci9110326
[22] Bajaj, V., Taran, S., Sengur, A. (2018). Emotion classification using flexible analytic wavelet transform for electroencephalogram signals. Health Information Science and Systems, 6: 12. https://doi.org/10.1007/s13755-018-0048-y
[23] Kim, Y., Choi, A. (2020). EEG-based emotion classification using long short-term memory network with attention mechanism. Sensors, 20(23): 6727. https://doi.org/10.3390/s20236727
[24] Chakladar, D.D., Chakraborty, S. (2018). EEG based emotion classification using “correlation based subset selection”. Biologically inspired cognitive architectures, 24: 98-106. https://doi.org/10.1016/j.bica.2018.04.012
[25] Yin, Y., Zheng, X., Hu, B., Zhang, Y., Cui, X. (2021). EEG emotion recognition using fusion model of graph convolutional neural networks and LSTM. Applied Soft Computing, 100: 106954. https://doi.org/10.1016/j.asoc.2020.106954
[26] Subasi, A., Tuncer, T., Dogan, S., Tanko, D., Sakoglu, U. (2021). EEG-based emotion recognition using tunable Q wavelet transform and rotation forest ensemble classifier. Biomedical Signal Processing and Control, 68: 102648. https://doi.org/10.1016/j.bspc.2021.102648
[27] Salankar, N., Mishra, P., Garg, L. (2021). Emotion recognition from EEG signals using empirical mode decomposition and second-order difference plot. Biomedical Signal Processing and Control, 65: 102389. https://doi.org/10.1016/j.bspc.2020.102389
[28] Gao, Q., Yang, Y., Kang, Q., Tian, Z., Song, Y. (2022). EEG-based emotion recognition with feature fusion networks. International Journal of Machine Learning and Cybernetics, 13(2): 421-429. https://doi.org/10.1007/s13042-021-01414-5
[29] Sharma, R., Pachori, R.B., Sircar, P. (2020). Automated emotion recognition based on higher order statistics and deep learning algorithm. Biomedical Signal Processing and Control, 58: 101867. https://doi.org/10.1016/j.bspc.2020.102389
[30] Yang, H., Han, J., Min, K. (2019). A multi-column CNN model for emotion recognition from EEG signals. Sensors, 19(21): 4736. https://doi.org/10.3390/s19214736
[31] Mert, A., Akan, A. (2018). Emotion recognition from EEG signals by using multivariate empirical mode decomposition. Pattern Analysis and Applications, 21: 81-89. https://doi.org/10.1007/s10044-016-0567-6
[32] Song, T., Zheng, W., Song, P., Cui, Z. (2018). EEG emotion recognition using dynamical graph convolutional neural networks. IEEE Transactions on Affective Computing, 11(3): 532-541. https://doi.org/10.1109/TAFFC.2018.2817622
[33] Chen, T., Ju, S., Yuan, X., Elhoseny, M., Ren, F., Fan, M., Chen, Z. (2018). Emotion recognition using empirical mode decomposition and approximation entropy. Computers & Electrical Engineering, 72: 383-392. https://doi.org/10.1016/j.compeleceng.2018.09.022
[34] Chao, H., Dong, L., Liu, Y., Lu, B. (2019). Emotion recognition from multiband EEG signals using CapsNet. Sensors, 19(9): 2212. https://doi.org/10.3390/s19092212
[35] Zhang, X., Liu, J., Shen, J., Li, S., Hou, K., Hu, B., Zhang, T. (2020). Emotion recognition from multimodal physiological signals using a regularized deep fusion of kernel machine. IEEE transactions on cybernetics, 51(9): 4386-4399. https://doi.org/10.1109/TCYB.2020.2987575
[36] Pan, L., Yin, Z., She, S., Song, A. (2020). Emotional state recognition from peripheral physiological signals using fused nonlinear features and team-collaboration identification strategy. Entropy, 22(5): 511. https://doi.org/10.3390/e22050511
[37] Khateeb, M., Anwar, S.M., Alnowami, M. (2021). Multi-domain feature fusion for emotion classification using DEAP dataset. IEEE Access, 9: 12134-12142. https://doi.org/10.1109/ACCESS.2021.3051281
[38] Meng, E., Huang, S., Huang, Q., Fang, W., Wu, L., Wang, L. (2019). A robust method for non-stationary streamflow prediction based on improved EMD-SVM model. Journal of Hydrology, 568: 462-478. https://doi.org/10.1016/j.jhydrol.2018.11.015
[39] Zheng, J., Pan, H. (2020). Mean-optimized mode decomposition: An improved EMD approach for non-stationary signal processing. ISA Transactions, 106: 392-401. https://doi.org/10.1016/j.isatra.2020.06.011
[40] Kaur, C., Bisht, A., Singh, P., Joshi, G. (2021). EEG Signal denoising using hybrid approach of Variational Mode Decomposition and wavelets for depression. Biomedical Signal Processing and Control, 65: 102337. https://doi.org/10.1016/j.bspc.2020.102337
[41] Taran, S., Bajaj, V. (2018). Clustering Variational Mode Decomposition for identification of focal EEG signals. IEEE Sensors Letters, 2(4): 1-4. https://doi.org/10.1109/LSENS.2018.2872415
[42] Al-Salman, W., Li, Y., Wen, P. (2019). Detecting sleep spindles in EEGs using wavelet fourier analysis and statistical features. Biomedical Signal Processing and Control, 48: 80-92. https://doi.org/10.1016/j.bspc.2018.10.004
[43] Yu, Y., Si, X., Hu, C., Zhang, J. (2019). A review of recurrent neural networks: LSTM cells and network architectures. Neural Computation, 31(7): 1235-1270. https://doi.org/10.1162/neco_a_01199
[44] Dhiman, G., Garg, M., Nagar, A., Kumar, V., Dehghani, M. (2021). A novel algorithm for global optimization: rat swarm optimizer. Journal of Ambient Intelligence and Humanized Computing, 12: 8457-8482. https://doi.org/10.1007/s12652-020-02580-0