Samir Fenanir* | Fouzi Semchedine | Abderrahmane Baadache
OPEN ACCESS
The Internet of Things (IoT) is vulnerable to various attacks, due to the presence of tiny computing devices. To enhance the security of the IoT, this paper builds a lightweight intrusion detection system (IDS) based on two machine learning techniques, namely, feature selection and feature classification. The feature selection was realized by the filter-based method, thanks to its relatively low computing cost. The feature classification algorithm for our system was identified through comparison between logistic regression (LR), naive Bayes (NB), decision tree (DT), random forest (RF), k-nearest neighbor (KNN), support vector machine (SVM) and multilayer perceptron (MLP). Finally, the DT algorithm was selected for our system, owing to its outstanding performance on several datasets. The research results provide a guide on choosing the optimal feature selection method for machine learning.
Internet of Things (IoT), intrusion detection system (IDS), anomaly detection, feature selection
The Internet of Things (IoT) is an emerging paradigm in the world of computer networks that allows communication between all kinds of objects via the Internet. These objects can be RFID tags, sensors, actuators, mobile phones, etc.; which use a single addressing scheme to interact and cooperate to achieve a common goal [1]. The IoT allows combining all kinds of communications, all the time, for everyone, and on any object, forming the ubiquitous computing [2]. It will cover a wide range of applications and will touch almost all the areas we face on a daily life.
IoT devices are often deployed in a hostile and insecure environment, making them more vulnerable to different attacks [3]. Therefore, security solutions are essential to protect IoT devices from intruder attacks. An Intrusion Detection System (IDS) is a tool used to detect attacks against a system or a network by analyzing their activities and events [4]. It can act as a second line of defense which from intruders [5]. The main purpose of an IDS is to detect as many attacks as possible with an acceptable accuracy while minimizing energy consumption in resource constrained [6]. There are mainly two types of IDS, signature-based and anomaly-based IDS. A signature-based IDS also known as misuse-based IDS, detects intrusions by comparing new data with a knowledge base or signatures of known attacks. This approach detects the known attacks, but it often fails to detect unknown attacks. The anomaly-based IDS compares the activities considered normal against observed events to identify significant deviations.
Many researches have been recently performed in the areas of IoT and IDS to provide the best security mechanism. Sedjelmaci et al. [3] were interested to a light anomaly detection technique based on the concept of the game theory. The authors use the Nash equilibrium to predict the equilibrium state that allows the IDS agent to detect the signature of a new attack. Li et al. [7] proposed a new intrusion detection system based on the K-Nearest Neighbor (KNN) classification algorithm in a wireless sensor network. The system can detect a flood attack in the wireless sensor network. It also conducts experiments to study the effects of a flood attack. Thanigaivelan et al. [8] presented a distributed internal anomaly detection system for the Internet of Things. The main features of the system are monitoring, ranking, isolation and reporting. Nodes monitor and note their neighbors at one hop, and if a neighbor does not maintain the required rating, the neighboring node is classified as an anomaly. Shahid Raza [4] proposed a real-time intrusion detection system in the IoT called SVELTE. It is an IDS available in IoT that is implemented in Contiki OS. This approach only detects content spoofing attacks within the network, gulp and selective transfer attacks. Douglas et al. [9] presented an ultra-lightweight deep-packet anomaly detection approach that is possible to run on small IoT devices. The approach uses n-gram bit-patterns to model payloads and allows the n-gram size to vary by dimension.
Although all the above research claims that a detection system is implemented and that some attacks are successfully detected, it is necessary to make the detection system lightweight if we want to implement an efficient detection system in IoT environments.
The aim of our research is to build a lightweight IDS. For that purpose, two techniques of machine learning have been applied, feature selection and classification methods. Feature selection methods can be used to select relevant features that decrease computational and storage costs and even, improve the accuracy of detection. There are three main approaches for feature selection [10]: filter-based, wrapper-based and embedded-based approaches. In this paper, we used the filter method because it has low computational cost compared to wrapper and Embedded methods. In addition, in order to find the best classification model suitable for the IoT environment, several popular algorithms such as Decision Trees, k-Nearest Neighbor, Support Vector Machines, etc.; have been implemented using the Scikit-Learn tool.
This study concludes with a comparative analysis of feature selection methods and their effects on various classification algorithms using three different data sets, such as KDD99, NSL-KDD and UNSW-NB15 datasets.
The remainder of this paper is organized as follows: in Section 2, we briefly discuss the technologies involved in the IoT, while Section 3 details our proposed system. In Section 4 we describe a test of our system. And, we conclude this work in Section 5.
In this section, we review the technologies involved in the Intrusion Detection System to handle security issues in IoT environments.
2.1 IoT architecture
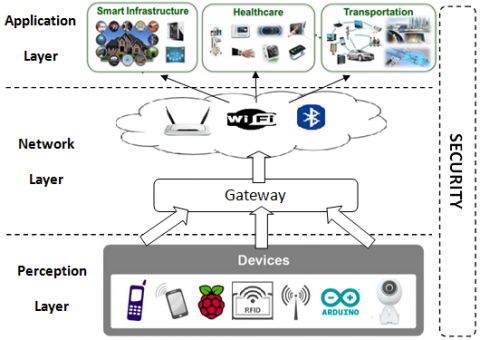
Internet of Things is a collection of many interconnected objects allowing people and objects to interact and create smart environments like transportation, agriculture, healthcare, energy, cities, etc. Figure 1 shows the IoT architectural model which is composed of 3 layers [1, 11]:
Figure 1. The IoT architectural model
The security policy must be fully integrated with the architecture to avoid hardware and software vulnerabilities at all the levels of the system.
2.2 Security in the Internet of Things
With the development of IoT applications, security remains the most important issue that cannot be ignored because of the connectivity and the sensitivity of the collected data. Also, the IoT has many restrictions and limitations in terms of components and devices such as limited processing capacity, memory, and power consumption, and even the heterogonous and the ubiquitous nature of IoT that introduce additional concerns [13]. The implementation of a security policy around these systems is therefore essential. In addition to the implementation of firewalls and increasingly secure authentication systems, it is necessary to complete such security policy by monitoring tools to audit the information system and to detect possible intrusions.
Intrusion means penetration of information systems and also attempts of local users to access higher privileges than those assigned. In this paper, we will see how to protect ourselves effectively against these intrusions. Therefore, it is important to understand the precise role of these intrusion detection systems.
2.3 Intrusion detection system
An Intrusion Detection System (IDS) is a mechanism that detects intrusions or attacks against a system or a network by analyzing the activity of the network and the system. Such intruders can be internal or external [14]: Internal intruders are users inside the network that attempt to raise their access privileges to misuse non-authorized privileges while external intruders are users outside the target network attempting to gain unauthorized access to the network [15]. The IDS monitors the operations of a host or a network, alerting the system administrator when it detects a security violation. There are mainly three components of the IDS [16]:
2.4 Types of IDS
IDSs can be classified as Network-based IDS (NIDS) and Host-based IDS (HIDS) [15]. Network-based IDS (NIDS) monitors the network traffic for malicious activities. Host-based IDS (HIDS) monitors malicious activities occurring within the host.
IDSs approaches may also be classified as signature-based, anomaly-based or specification based [14-15]:
Signature Based IDS: IDS has a database of signatures or patterns and each attack can be detected according to patterns or signatures. This technique is simple to use. However, it is very expensive; it needs more storage space when the number of attacks increases. On the other hand, the main disadvantage of this method is that only the attacks recognized by the signatures will be detected [17]. So, it needs a regularly up-gradation of the database with new signatures of attacks [18].
Anomaly Based IDS: This technique consists in detecting an intrusion according to the behavior of the system. It predefines the normal behavior of the system and observes changes in the normal behavior. If any activity differs from the normal behavior, it is marked as an intrusion [14, 19]. The main advantage of this technique is that it can be used to detect new attacks by signaling any deviation from the normal behavior. However, it often generates many false positives because a deviation from the normal behavior does not always correspond to an attack.
Specification Based IDS: This technique combines the two previous techniques, due to their complementary nature [19]. It takes advantage of the both technologies to detect new attacks on the one hand and to reduce false positives on the other hand. However, such mechanisms consume more energy and more resources [16].
One of our main goals is that the IDS should be lightweight and comply with the processing capabilities of the constrained nodes. Thus, according to [20], it is not possible to have an active intrusion detection agent in each node of an IoT due to the limited processing capacity and power consumption. Therefore, we have adopted a centralized IDS architecture to overhead the problem of limited capacity on the one hand and the peripheral heterogeneity issue on the other hand, where the IDS is implemented on the network layer of the IoT above the Gateway component.
Figure 2 shows the activity diagram of our Lightweight Intrusion Detection System (LIDS) that consists in detecting an intrusion by observing the current behavior and comparing it to the normal behavior. If there is a deviation between the two behaviors, an alarm will be triggered. It is composed of three phases:
Figure 2. LIDS architectural model
A- Events collection: In this phase, the component Events collector of LIDS collects and records all the events performed by the IoT devices in order to build the current behavior that will be represented as a feature vector as follows: Vi(t) = (c1, c2, …, c n).
B- Anomaly detection: The detection phase analyzes and detects intrusions. It is the main component of our LIDS, which will be detailed in the next section.
C- Alarm: After attack detection, the proposed system blocks the user and finishes his session, and then it sends an alert to the administrator to take the appropriate action.
Based on the proposed approach, the classification process of the system is showed in Figure 3.
Figure 3. Classification process in the IoT context
The first process is the dataset acquisition. In this process, the dataset is collected and splitted into training and testing datasets. After, the process of pre-processing allows to clean the data while the feature selection process allows to reduce the data dimension. In this work, we have employed different classifiers model like: Logistic Regression, Random forest, Decision Tree, SVM, etc. The training set is used to train the models. Then, these models are evaluated against the testing set using different evaluation metrics. Finally, these processes will be repeated for three datasets.
4.1 Dataset
In our experiments, we employed three datasets such as KDD Cup 99 [21], NSL-KDD dataset [22] and UNSW-NB15 dataset [23].
KDD Cup 1999: This dataset is developed by MIT Lincoln Labs and provides a standard dataset generated from simulations in military network environments and by encompassing various intrusions. The dataset includes three independent sets: “whole KDD”, “10 % KDD”, and “corrected KDD”. We used “10 % KDD” and the “corrected KDD” as training and testing dataset, respectively. A connection in the KDD Cup 99 dataset is a sequence of TCP packets which contains 42 features and they are labeled as either normal or an attack.
NSL-KDD: This dataset is collected by Canadian Institute for Cyber security for 9 weeks [6]. It is a new and a reduced version of KDD Cup 99 dataset. The data structure and the classification of attacks in the NSL-KDD dataset remain the same as KDD Cup 99, with eliminating duplicate records in the dataset. So, the classifiers will not be biased towards more frequent records. NSL-KDD data consists of training and testing data stored in 2 separate files, the “KDD Train+” dataset as the training set and “KDD Test+” datasets as the testing set.
The KDD Cup99 and NSL-KDD datasets include four categories of attack [24]. The Table 1 shows the number of rows for each category:
Table 1. Class distribution in KDD Cup 99 and NSL-KDD datasets
|
KDD Cup 99 |
||||||
|
|
Normal |
DoS |
Prob |
R2L |
U2R |
Total |
|
Train |
97,278 |
391,458 |
4,107 |
1,126 |
52 |
494,021 |
|
Test |
60,593 |
229,855 |
4,166 |
16,345 |
70 |
311,029 |
|
NSL-KDD |
||||||
|
|
Normal |
DoS |
Prob |
R2L |
U2R |
Total |
|
Train |
67,343 |
45,927 |
11,656 |
995 |
52 |
125,973 |
|
Test |
9,711 |
7,460 |
2,421 |
2,885 |
67 |
22,544 |
UNSW-NB15: The network packets of this dataset were collected by the IXIA Perfect Storm tool in the Cyber Range Lab of the Australian Centre for Cyber Security (ACCS) to generate a hybrid combination of real-life and contemporary synthetic attack behaviors. It has nine categories of attack in addition to one category representing the normal data. The number of records of each category is given in the Table 2. This dataset has 45 features including a class label. These features are mixed in nature: nominal, numeric and time-stamp.
Table 2. Class distribution in UNSW-NB15 dataset
|
Attack Category |
Training set |
Testing set |
|
Normal |
56,000 |
37,000 |
|
Analysis |
2,000 |
677 |
|
Backdoor |
1,746 |
583 |
|
DoS |
12,264 |
4,089 |
|
Exploits |
33,393 |
11,132 |
|
Fuzzers |
18,184 |
6,062 |
|
Generic |
40,000 |
18,871 |
|
Reconnaissance |
10,491 |
3,496 |
|
Shell Code |
1,133 |
378 |
|
Worms |
130 |
44 |
|
Total |
175,341 |
82,332 |
DoS (Denial of Service Attack): Is an attack that makes a service unavailable, to prevent legitimate users of that service.
U2R (Users to Root Attack): In this category, an attacker tries to get the access rights from a normal user account in order to obtain the root access to the system [25].
R2L (Remote to Local Attack): In this category, the attacker looks for vulnerabilities in a network's security, to gain access as a local user of that network.
Probe (Probing Attack): In this category, the attacker tries to collect information about the network in order to circumvent its security.
Analysis: Contains various attacks of port scanning, spam and penetration of HTML files.
Backdoors: The attacker bypasses the system security mechanism to access a system or its data.
Exploits: The attacker has previous knowledge of the system and leverages that knowledge by exploiting the vulnerability.
Fuzzers: It generates a huge amount of random data to crash the system.
Generic: It works against all block ciphers.
Reconnaissance: It gathers information about the system to supervise it.
Shellcode: A small piece of code used as the payload in the exploitation of software vulnerability.
Worms: Attacker replicates itself in order to spread to other computers.
4.2 Data preprocessing
Data preprocessing is a technique for transforming the original data to a data required by the machine learning method. It includes transformation, binarization, standardization and normalization. Firstly, the dataset is preprocessed to consider binary classification problem in which only two labels, i.e., attack and normal traffic are considered, and then we applied the data transformation and normalization technique on the dataset.
Data transformation: We use this technique to transform the categorical value of features into a numeric value. For example, the KDD-Cup99 has the feature "Service" that contains the values: Telnet, FTP, HTTP, etc. so, these values will be transformed into numeric values: 1, 2, 3, etc.
Data normalization: Consists in transforming features by scaling each one to a given range. A feature set X is scaled between its minimum and maximum values. The new feature value Z generally lies between [0, 1]. The transformation is given by:
$Z=\frac{\mathrm{X}-\min (\mathrm{X})}{\max (\mathrm{X})-\min (\mathrm{X})}$ (1)
Normalization makes training less sensitive at the functional scale and ensures that a convergence problem does not have a huge variance, which makes optimization possible. After the data preprocessing operations, we obtain a new structure of datasets that are shown in Table 3.
Table 3. Datasets structure after data preprocessing
|
KDD Cup 99 |
|||
|
Dataset |
Number of records |
Normal |
Attack |
|
Train |
494,021 |
97,278 |
396,743 |
|
Test |
311,029 |
250,436 |
60,593 |
|
NSL-KDD |
|||
|
Dataset |
Number of records |
Normal |
Attack |
|
Train |
125,973 |
67,343 |
58,630 |
|
Test |
22,544 |
9,711 |
12,833 |
|
UNSW-NB15 |
|||
|
Dataset |
Number of records |
Normal |
Attack |
|
Train |
175,341 |
56,000 |
119,341 |
|
Test |
82,332 |
37,000 |
45,332 |
Feature Selection is the process of selecting the most significant features from a given dataset. This allows increasing the efficiency of storage, reduces computing costs, and also improves the performance of an automatic learning model. There are several ways to select features that can be grouped into three categories:
Filter Methods that is selecting features using correlation matrix. Each feature is scored based on statistical calculations; then, we select only the attributes where the correlation is greater than a threshold.
Wrapper Methods that is looking for the most optimal combination of features by evaluating the model accuracy. This means, that we feed the features to the selected Machine Learning algorithm and based on the model performance we add or remove the features.
Embedded Methods combine the advantages of both previous methods by choosing the best features when building model. The most common types of this method are regularization methods.
For our experiments, we used the Filter Method because it is much faster compared to wrapper and Embedded methods. On the other hand, Wrapper and Embedded methods are computationally costly; hence, they are not suitable for the low-resource IoT devices.
To determine the relevance of features for our model, we have used three popular correlation analysis techniques i.e., Pearson’s correlation technique, Spearman’s correlation coefficient and the Kendall’s tau coefficient.
4.3.1 Pearson’s correlation coefficient (PCC)
That is a measure of dependence between two random variables X and Y. The Pearson correlation coefficient ρ is given by the equation:
$\rho=\frac{\operatorname{cov}(\mathrm{X}, \mathrm{Y})}{\sqrt{\sigma^{2}(\mathrm{X}) \sigma^{2}(\mathrm{Y})}}$ (2)
where, cov is the covariance and $\sigma$ is the variance. The value of $\rho$ lies between $-1$ and $1, \rho$ is close to the extreme values $-1$ and 1 if $X$ and $Y$ are strongly correlated, and $\rho=0$ if $X$ and $Y$ are totally uncorrelated. Thus, a feature which is strongly correlated to some other features is a redundant one.
4.3.2 Spearman’s correlation coefficient (SCC)
Spearman's rank correlation coefficient can be defined as a special case of Pearson $\rho$ applied to ranked variables. Rather than comparing means and variances, Spearman's coefficient looks at the relative order of values for each variable. This makes it appropriate to use with both continuous and discrete data. The formula for Spearman's coefficient looks very similar to that of Pearson, with the distinction of being computed on ranks instead of raw scores:
$\rho=\frac{\operatorname{cov}\left(\operatorname{rank}_{\mathrm{X}}, \operatorname{rank}_{\mathrm{Y}}\right)}{\sqrt{\sigma^{2}\left(\operatorname{rank}_{\mathrm{X}}\right) \sigma^{2}\left(\operatorname{rank}_{\mathrm{Y}}\right)}}$ (3)
4.3.3 Kendall's tau coefficient (KTC)
Unlike Spearman's coefficient, Kendall's $\tau$ does not take into account the difference between ranks, but only directional agreement. Therefore, this coefficient is more appropriate for discrete data.
Formally, Kendall's $\tau$ coefficient is defined as:
$\tau=\frac{(\text { concordant pairs })-(\text { discordant pairs })}{N(\mathrm{N}-1) / 2}$ (4)
where, n is the observation number of the variables $X$ and $Y$ The pairs of observations (xi, yi) and (xj, yj) are called concordant, if $x_{i}>x_{j}$ and $y_{i}>y_{j}$ or $x_{i}<x_{j}$ and $y_{i}<y_{j} .$ In the opposite case, they are called discordant.
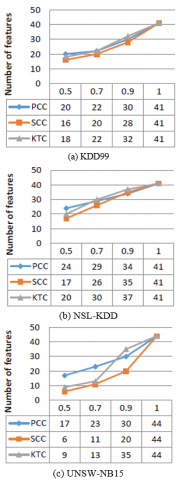
To compare the feature selection metric for intrusion detection on the three datasets mentioned above, we implemented three correlation methods: Pearson’s Correlation Coefficient (PCC), Spearman's Correlation Coefficient and Kendall's Tau Coefficient (KTC) using different threshold values. The goal is to find optimal feature subsets that will be used by the different classifiers with the aim of achieving the best classification results in the context of the Internet of Things. All the obtained results are shown in Figure 4.
Figure 4. Performance of feature selection algorithms
Figure 4 summarizes the number of features selected by each algorithm using three datasets KDD99, NSL-KDD and UNSW-NB15. Initially KDD99 dataset has 41 features without the target attribute. After applying the PCC method with three threshold values of 0.9, 0.7 and 0.5, the number of features is reduced to 30, 22 and 20 features, respectively. Using the SCC method, the number of features is reduced to 28, 20 and 16 features. While the number of features is reduced to 32, 22 and 18 features using the KTC method. On the NSL-KDD dataset, the number of features is reduced from 41 to 34, 29 and 24 after applying the PCC method. Using the SCC method, the number of features is reduced to 35, 26, 17 features. In the case of the KTC method, the features number is reduced to 37, 30 and 20 features. Finally, on the UNSW-NB15 dataset, the number of features is reduced from 44 to 30, 23 and 17 using the PCC method. Applying the SCC method, the number of features is reduced to 20, 11, 6 features. While the number of features is reduced to 35, 13 and 9 features using the KTC method.
4.4 Classification techniques
In the classification process of the proposed IDS given in Figure 3, the two main phases of the system include the training and the testing phase. In the training phase, a training dataset containing labeled samples is used to train the classifier. To evaluate the performance of the classifier, new samples from the test dataset are presented to the classifier. There are many types of classifiers available like Logistic Regression, Decision Tree, Support Vector Machine, etc. To find the best classifier model that suit to our problem, we evaluate seven most famous machine learning classifier models and try to optimize the parameters of each algorithm in order to obtain an efficient classifier model with high accuracy and precision, as well as low false negative and false positive. The tested classifier models are briefly described below.
Logistic Regression (LR): it is a predictive analysis algorithm based on the concept of probability. It uses the Sigmoid function to map predicted values to probabilities between 0 and 1. This function is defined as follows:
sigmoid$(x)=\frac{1}{1+e^{x}}$ (5)
Naive Bayes (NB): The Naive Bayesian classifier is based on Bayes theorem with the independence assumptions between predictors. Bayes theorem is defined as follows:
$P(X / C)=\frac{P(C / X) P(X)}{P(C)}$ (6)
where, P(X/C) is the posterior possibility of class (C) given predictor (X).
Decision Tree (DT): it is a decision support tool that uses a tree-like graph where each internal node denotes a test on an attribute, each branch represents the outcome of the test, and each leaf node represents a class label. The paths from root to leaf represent classification rules.
Random Forest (RF): It works exactly like the decision tree to build trees. The main difference between the two methods is that a decision tree is built using the whole dataset considering all features, whereas a random forest randomly selects observations and specific features to build multiple decision trees and then merges them together to obtain a higher accuracy and stability prediction.
K-Nearest Neighbor (KNN): The principle of this model is to classify a point according to its distance from the k nearest neighbor points. The decision is taken by the majority vote of its neighbors.
Support Vector Machine (SVM): The algorithm of the support vector machine aims to find a hyper plane to maximize the separation margin between two classes. The optimized hyper plane can be expressed mathematically by:
$w^{T} x+b=0$ (7)
where, w is the vector of weights, x is an input vector and b represents the bias.
Multi-Layer Perceptron (MLP): is the neural network algorithm. MLP includes a network of artificial neurons (nodes). Three types of nodes are connected to each other: input nodes, hidden nodes, and output nodes. The node to node connection is adjustable.
4.5 Performance evaluation
To evaluate the performance of the IDS, many evaluation metrics are calculated using the values in the confusion matrix. The description of these values is as follows:
True Positive (TP): the number of records correctly classified to the Normal class.
True Negative (TN): the number of records correctly classified to the Attack class.
False Positive (FP): the number of Normal records incorrectly classified to the Attack class.
False Negative (FN): the number of Attack records incorrectly classified to the Normal class.
Based on the above values, the most commonly used evaluation metrics are given by the following formulas:
$\boldsymbol{T} P$rate$=\frac{T P}{T P+F N}$ (8)
$\boldsymbol{T} \boldsymbol{N} \boldsymbol{r} \boldsymbol{a} \boldsymbol{t} \boldsymbol{e}=\frac{T N}{T N+F P}$ (9)
$\boldsymbol{F P} \boldsymbol{r} \boldsymbol{a t e}=\frac{F P}{F P+T N}$ (10)
$F N$rate$=\frac{F N}{F N+T P}$ (11)
Accuracy $=\frac{T P+T N}{T P+T N+F P+F N}$ (12)
Precision $=\frac{T P}{T P+F P}$ (13)
$\operatorname{Recall}=\frac{T P}{T P+F N}$ (14)
$F 1$ Score $=2 \cdot \frac{\text { Precision .Recall }}{\text { Precision + Recall }}$ (15)
4.6 Evaluations and results
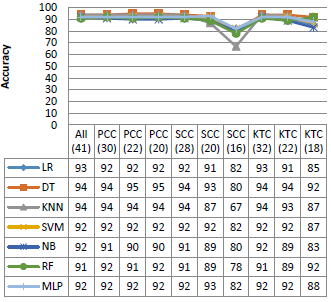
The results of our experiments are presented in this section. Firstly, we measure the classification evaluation metrics of the three datasets with full features. Then, we reduced datasets dimension using the three popular correlation methods cited above and we evaluate each algorithm based on the best hyperparameters. Figure 5, 6 and 7 show the results.
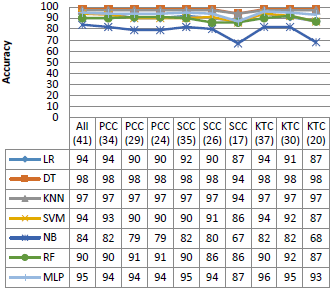
(a) Accuracy
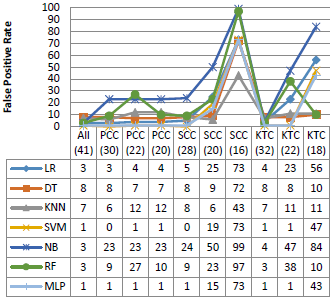
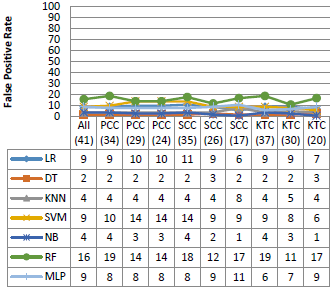
(b) False Positive rate
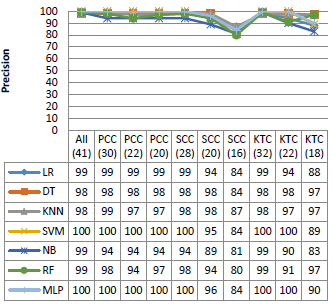
(c) Precision
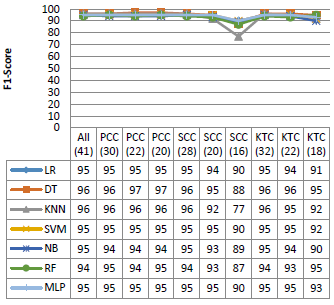
(d) F1-Score
Figure 5. Performance on the KDD99 dataset
Figure 5 shows the performance of the different classifiers with various dimension of the KDD99 dataset. As shown in the Figure, all the classifiers used in this experiment have similar performance in terms of accuracy, precision and F1 score, with rates that can reach 95 %, 100 % and 96 %, respectively. In addition, SVM and MLP give a good False Positive Rate against the other algorithms, except the SSC (20), SCC (16) and KTC (18). However, NB and RF give a very high false positive rate especially with the reduced dimensions.
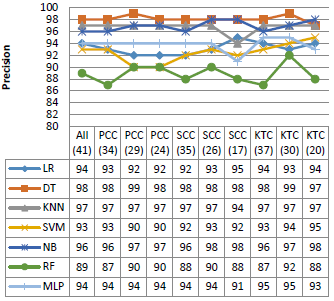
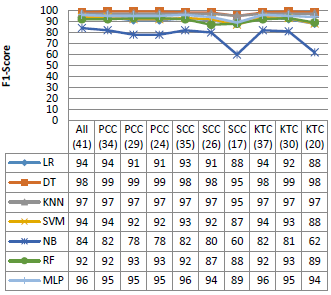
Figure 6 represents different evaluation metrics for the different techniques on the NSL-KDD dataset. From this figure, it can be seen that NB have less accuracy and F1-Score values than other classifiers, with an average rate of 80 %; it also provides a very high false positive rate, while the other classifiers give good results except the case of reduced dimensions. It is seen also that the DT classifier performs better than the others with the different metrics, where the accuracy reached a rate of 98 % with almost all dataset dimensions, and a false positive rate not exceeding 2 % except the SCC (26) and KTC (20).
(a) Accuracy
(b) False positive rate
(c) Precision
(d) F1-Score
Figure 6. Performance on the NSL-KDD dataset
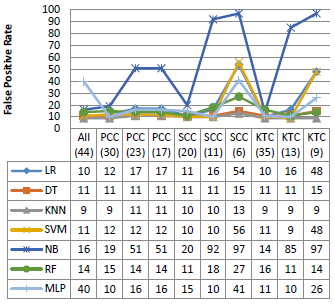
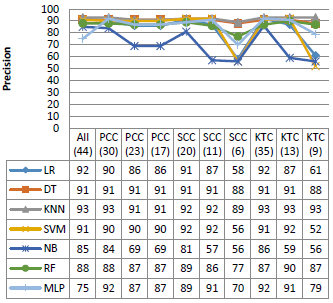
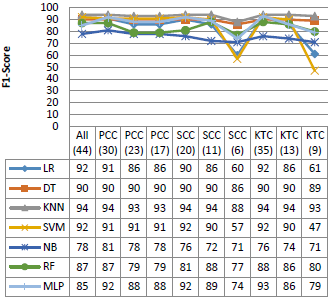
Figure 7 shows the results of the experiments on the UNSW-NB15 dataset. In this dataset, the best result is performed by the KKN and LR algorithms, while the worst result is obtained by the NB algorithm.
According to the above results, the best performances are given by the DT and KNN algorithm. Furthermore, feature selection techniques produce generally similar results to the original data, sometimes worse than the original features. There are only a few cases where these techniques provide good performances.
(a) Accuracy
(b) False Positive Rate
(c) Precision
(d) F1-Score
Figure 7. Performance on the UNSW-NB15 dataset
Internet of Things is increasingly used and many related applications appeared. However, the IoT is faced with a security problem that needs to be solved, while considering the constraints and challenges related to the IoT context.
In this paper, we have proposed a lightweight intrusion detection model based on machine learning techniques. This model can detect new attacks and provide double protection to the IoT nodes against internal and external attacks.
In order to find the best classifier model, we evaluated several machine learning classifier models using three lightweight feature selection algorithms and tried to optimize the parameters of each algorithm to get an efficient classifier model with high accuracy and precision, as well as low false negative. In the experiments, we used KDD99, NSL-KDD and UNSW-NB15 dataset to learn and evaluate our model.
According to the results of our study, it is observed that DT and KNN performed better than the other algorithms; however, the KNN takes much time to classify compared to the DT algorithm. Furthermore, with the three correlation methods used to reduce datasets dimension such as PCC, SCC and KTC, the classifiers produce good performance when the threshold of the correlation coefficient is greater than 0.9; below this threshold, performances are poor and sometimes unacceptable. In the case of the datasets that relate to the extent of our study area, it is found that the performance obtained on the NSL-KDD dataset is better compared to the KDD99 and UNSW-NB15 datasets.
In Future Work we will study other feature selection methods combined with more machine learning algorithms applied to real-time data from IoT devices.
[1] Atzori, L., Iera, A., Morabito, G. (2010). The Internet of Things: A survey. Computer Network, 54(15): 2787-2805. https://doi.org/10.1016/j.comnet.2010.05.010
[2] Weiser, M. (1991). The computer for the 21st century. Scientific American, 265(3): 94-105.
[3] Sedjelmaci, H., Senouci, S.M., Al-Bahri, M. (2016). Lightweight anomaly detection technique for low-resource IoT devices: A game-theoretic methodology. IEEE ICC - Mobile and Wireless Networking Symposium. https://doi.org/10.1109/ICC.2016.7510811
[4] Raza, S., Wallgren, L., Voigt, T. (2013). SVELTE: Real-time intrusion detection in the Internet of Things. Ad Hoc Networks, 11(8): 2661-2674. https://doi.org/10.1016/j.adhoc.2013.04.014
[5] Anand, A., Patel, B. (2012). An overview on intrusion detection system and types of attacks it can detect considering different protocols. International Journal of Advanced Research in Computer Science and Software Engineering, 2(8): 94-98.
[6] Rajasegarar, S., Leckie, C., Palaniswami M. (2008). Anomaly detection in wireless sensor networks. IEEE Wireless Communications, 15(4): 34-40. https://doi.org/10.1109/MWC.2008.4599219
[7] Li, W.C., Yi, P., Wu, Y., Pan, L., Li, J.H. (2014). A new intrusion detection system based on KNN classification algorithm in wireless sensor network. Journal of Electrical and Computer Engineering, 2014: 8 pages. http://dx.doi.org/10.1155/2014/240217
[8] Thanigaivelan, N.K., Nigussie, E., Kanth, R.K., Virtanen, S., Isoaho, J. (2016). Distributed internal anomaly detection system for Internet-of-Things. 13th IEEE Annual Consumer Communications & Networking Conference (CCNC). https://doi.org/10.1109/CCNC.2016.7444797
[9] Summerville, D.H., Zach, K.M., Chen, Y. (2015). Ultra-lightweight deep packet anomaly detection for Internet of Things devices. 2015 IEEE 34th International Performance Computing and Communications Conference (IPCCC). https://doi.org/10.1109/PCCC.2015.7410342
[10] Huang, S.H. (2003). Dimensionality reduction in automatic knowledge acquisition: A simple greedy search approach. IEEE Transactions on Knowledge and Data Engineering, 15(6): 1364-1373. https://doi.org/10.1109/TKDE.2003.1245278
[11] Zhao, K., Ge, L. (2013). A survey on the Internet of Things security. in Int'l Conf. on Computational Intelligence and Security (CIS), pp. 663-667. https://doi.org/10.1109/CIS.2013.145
[12] Leo, M., Battisti, F., Carli, M., Neri, A. (2014). A federated architecture approach for internet of things security. in Euro Med Telco Conference (EMTC), pp. 1-5. https://doi.org/10.1109/ EMTC. 2014. 6996632
[13] Oh, D., Kim, D., Ro, W.W. (2014). A malicious pattern detection engine for embedded security systems in the Internet of Things. Sensors, 14(12): 24188-24211. https://dx.doi.org/10.3390/s141224188
[14] Sherasiya, T., Upadhyay, H., Patel, H.B. (2016). A survey: Intrusion detection system for Internet of Things. International Journal of Computer Science and Engineering (IJCSE), 5(2): 91-98.
[15] Zarpelão, B.B., Miani, R.S., de Alvarenga, S.C. (2017). A survey of intrusion detection in Internet of Things. Journal of Network and Computer Applications, 84(C): 25-37. http://dx.doi.org/10.1016/j.jnca.2017.02.009
[16] Alrajeh, N.A., Khan, S., Shams, B. (2013). Intrusion detection systems in wireless sensor networks: A review. International Journal of Distributed Sensor Networks, 2013: 7 pages. https://doi.org/10.1155/2013/167575
[17] Liao, H.J., Richard Lin, C.H., Lin, Y.C., Tung, K.Y. (2013). Review intrusion detection system: A comprehensive review. Journal of Network and Computer Applications, 36(1): 16-24. https://doi.org/10.1016/j.jnca.2012.09.004
[18] Maharaj, N., Khanna, P. (2014). A comparative analysis of different classification techniques for intrusion detection system. International Journal of Computer Applications, 95(17): 22-26. http://dx.doi.org/10.5120/16687-6806
[19] Hodo, E., Bellekens, X., Hamilton, A., Dubouilh, P.L., Iorkyase, E., Tachtatzis, C., Atkinson, P. (2016). Threat analysis of IoT networks using artificial neural network intrusion detection system. 2016 International Symposium on Networks, Computers and Communications (ISNCC). https://doi.org/10.1109/ISNCC.2016.7746067
[20] Roman, R., Zhou, J.Y., Lopez, J. (2006). Applying intrusion detection systems to wireless sensor networks. In IEEE Consumer Communications & Networking Conference (CCNC 2006), pp. 640-644. https://doi.org/10.1109/CCNC.2006.1593102
[21] KDD cup 99 Intrusion detection dataset. http://kdd.ics.uci.edu/databases /kddcup99/ kddcup.data_10_percent.gz, accessed on March 1, 2019.
[22] NSL-KDDDataset, https://www.unb.ca/cic/datasets/nsl.html, accessed on March 1, 2019.
[23] Nour, M., Slay, J. (2015). UNSW-NB15: A comprehensive data set for network intrusion detection systems (UNSW-NB15 network data set). Military Communications and Information Systems Conference (MilCIS). https://doi.org/10.1109/MilCIS.2015.7348942
[24] Hasan, M.A.M., Nasser, M., Ahmad, S., Molla, K.I. (2016). Feature selection for intrusion detection using random forest. Journal of Information Security, 7(3): 129-140. https://doi.org/10.4236/jis.2016.73009
[25] Paliwal, S., Gupta, R. (2012). Denial of-service, probing & remote to user (R2L) attack detection using genetic algorithm. International Journal of Computer Applications, 60(19): 57-62. https://doi.org/10.5120/9813-4306