Mariam Thabet Dhyool* | Zoalfokkar Kareem Alobad | Ali Salah Hassan
© 2026 The authors. This article is published by IIETA and is licensed under the CC BY 4.0 license (http://creativecommons.org/licenses/by/4.0/).
OPEN ACCESS
Epoxy coatings for outdoor electronics often suffer from brittleness and limited UV durability. In this study, epoxy was toughened with a polyether polyol modifier (TBCP polyol) and optically tuned using ZnO or MgO nanoparticles. The matrix was optimized at 6 wt.% TBCP and reinforced with 0.5–3 wt.% oxide via mechanical stirring and ultrasonication, then cured with isophorone diamine to obtain uniform films. UV–Vis analysis of the instrument-exported tables (20 nm sampling) confirmed a clear, loading-dependent improvement at 540 nm. Compared with neat epoxy, reflectance increased by 13.5% for 3 wt.% ZnO and 19.4% for 3 wt.% MgO. Absorbance decreased by 39.8% and 59.5%, respectively. In parallel, transmittance increased by 90.7% (ZnO) and 162.6% (MgO), and the derived optical conductivity decreased by 17.8% and 45.3%, indicating an oxide-dependent redistribution of the visible-range optical response. Charpy impact testing verified that TBCP enhances toughness, with further gains upon oxide addition, without evidence of incomplete curing. Field-emission scanning electron microscopy (FESEM) observations reveal filler-dependent dispersion and microstructural features that rationalize the optical trends. Differential scanning calorimetry (DSC) shows only a slight reduction in Tg after TBCP incorporation without evidence of incomplete cure. Across the optical metrics at 540 nm, MgO provides the largest improvement, highlighting composition-dependent tunability.
epoxy, ZnO, reflectance, absorbance, transmittance, optical conductivity, impact strength
Epoxy resins are frequently utilized in electronics, automotive, and aerospace applications as structural materials, coatings, and adhesives due to their strong adhesion, high stiffness, and, where required, optical clarity. These advantages originate from a highly crosslinked network; however, the same network restricts chain mobility and typically results in low fracture toughness and limited impact resistance compared with many engineering polymers [1]. To mitigate brittleness, epoxy systems are often toughened by introducing a secondary phase (e.g., reactive rubbers or block copolymers), which increases energy dissipation during crack initiation and propagation [2, 3].
Beyond mechanical performance, advanced coatings increasingly require optical functionality (e.g., UV shielding and high reflectance). Incorporating inorganic nanoparticles into epoxy matrices is an effective route to tailor optical properties by creating refractive-index contrast and wavelength-scale scattering centers while maintaining a continuous polymer phase [4, 5]. Prior studies show that metal-oxide fillers can reduce transmittance and enhance UV attenuation in epoxy-based films, depending on filler chemistry, particle dispersion, and loading [6, 7]. Here, an epoxy matrix is toughened with a polyether polyol (TBCP polyol) and reinforced with ZnO or MgO nanoparticles. The composition–property relationships are assessed by correlating optical response (reflectance, absorbance, transmittance, and optical conductivity) with impact performance to identify a composition window suitable for multifunctional nanocoatings.
Most epoxy/metal-oxide studies target a single function (e.g., UV attenuation with ZnO or thermal/chemical robustness with MgO). In contrast, conventional epoxy toughening strategies primarily improve fracture resistance without explicitly engineering photonic response. Accordingly, a key frontier challenge is the deliberate co-design of polymer morphology and nanoparticle dispersion to achieve synergistic multifunctionality within a single coating platform. This study, therefore, examines the coupled roles of a phase-separating TBCP toughener and metal-oxide nanoparticles in co-engineering optical reflectivity and mechanical durability. The working premise is that TBCP promotes crack deflection and energy dissipation, while the nanoparticles modulate photon management through refractive-index contrast and scattering, enabling composition-controlled multifunctionality.
The content of the polyether polyol toughener (TBCP polyol) was varied up to 9 wt.% to capture the transition from brittle fracture in neat epoxy to toughened, phase-separated morphologies, while avoiding excessive plasticization and processing instability. Nanoparticle loadings (0.5–3 wt.%) were selected to probe the onset and saturation of scattering-driven reflectance enhancement, while limiting viscosity increase and agglomeration that can compromise mechanical performance and optical uniformity. Overall, this design space tests a hypothesis-driven trade-off between (i) morphology-controlled toughening and (ii) filler-controlled photonic and thermal transport pathways.
2.1 Materials and equipment
Sikadur-52 (Sika, Turkey) is a two-component epoxy adhesive based on bisphenol F–epichlorohydrin resin and an isophorone diamine hardener. It is used for crack filling and injection in wood, masonry, and concrete using gravity feed or pressure injection because of its low viscosity and high bond strength [8]. In this study, a polyether polyol toughener (TBCP polyol) was used to modify the epoxy matrix to improve toughness and impact resistance. Guided by prior reports linking block-copolymer content to epoxy morphology and mechanical performance, a TBCP-based polyether polyol formulation was selected for the present work. The toughener has a relative density of 1.018 g/mL at 25 ℃ [9]. Zinc oxide nanoparticles (ZnO NPs) were selected as a representative metal-oxide filler owing to their thermal and chemical stability and reported interfacial effects in polymer matrices. In this work, dispersion was achieved using the adopted mixing/sonication protocol to increase the effective interfacial area and enable stress transfer through the filler–matrix interface. In addition, the refractive-index contrast between the epoxy matrix and the nanoparticles promotes scattering that increases diffuse reflectance, improving the optical response of polymer-based coatings [10, 11]. Magnesium oxide nanoparticles (MgO NPs) were selected as a representative metal-oxide filler because of their high thermal stability and chemical robustness, which are relevant to coating applications. Owing to their nanoscale dimensions (< 100 nm) and high specific surface area, MgO NPs provide a large filler–matrix interfacial area that influences dispersion, interfacial interactions, and optical scattering behavior in nanocomposites. Bulk MgO has a stable crystal structure, a density of ~3.58 g/cm³, and a high melting point (~2852 ℃), supporting its use as a thermally stable additive in coatings and related applications [12, 13].
2.2 Sample preparation
2.2.1 Preparation of neat epoxy
The preparation of neat epoxy (EP) is summarized in Table 1. The epoxy resin and hardener were mixed at a 2:1 ratio for 10 min at 650 rpm using a mechanical stirrer to obtain a homogeneous blend. The mixture was then vacuum-degassed at room temperature for 15–20 min to remove entrapped air, poured into silicone molds, and cured at room temperature for 7 days. The cured specimens were used for subsequent testing (Figure 1).
Table 1. Composition of the toughening agent, epoxy blends, and nanoparticles developed in this investigation
|
Sample No. |
Matrix Polymer Blends |
Toughening Agent |
Filler Content (wt.%) |
Sample Composition |
|
1 |
Unmodified epoxy (neat epoxy) |
No toughening agent |
No reinforcement |
EP |
|
2 |
Modified epoxy |
Toughening agent |
- |
1% TBCP/EP |
|
3 |
- |
- |
- |
3% TBCP/EP |
|
4 |
- |
- |
- |
6% TBCP/EP |
|
5 |
- |
- |
- |
9% TBCP/EP |
|
6 |
Modified epoxy (Nanocomposite) |
6% (TBCP) |
0.5% MgO |
0.5% MgO/6% TBCP/EP |
|
7 |
- |
- |
1% MgO |
1% MgO/6% TBCP/EP |
|
8 |
- |
- |
1.5% MgO |
1.5% MgO/6% TBCP/EP |
|
9 |
|
- |
2% MgO |
2% MgO/6% TBCP/EP |
|
10 |
|
- |
3% MgO |
3% MgO/6% TBCP/EP |
|
11 |
Modified epoxy (Nanocomposite) |
6% (TBCP) |
0.5% ZnO |
0.5% ZnO/6% TBCP/EP |
|
12 |
- |
- |
1% ZnO |
1% ZnO/6% TBCP/EP |
|
13 |
- |
- |
1.5% ZnO |
1.5% ZnO/6% TBCP/EP |
|
14 |
- |
- |
2% ZnO |
2% ZnO/6% TBCP/EP |
|
15 |
- |
- |
3% ZnO |
3% ZnO/6% TBCP/EP |

Figure 1. Preparation steps of neat epoxy (EP)
2.2.2 Preparation of blends
To prepare TBCP-modified epoxy blends, TBCP was incorporated into the epoxy resin at 1, 3, 6, and 9 wt.% and mixed by mechanical stirring at 650 rpm for 30 min to obtain a homogeneous dispersion. The hardener was then added at a resin-to-hardener weight ratio of 2:1, followed by additional stirring at 650 rpm for 10 min. The mixture was vacuum-degassed at room temperature for 15–20 min to remove entrapped air, poured onto glass slides for optical measurements, and cast into silicone molds for impact testing. All specimens were cured at ambient temperature for 7 days. The preparation procedure is schematically illustrated in Figure 2. Based on the Charpy impact results obtained in this study, the 6 wt.% TBCP formulation was selected as the matrix for subsequent nanoparticle-filled nanocomposites.

Figure 2. Schematic procedure for preparing TBCP-modified epoxy blends (TBCP/EP)
2.2.3 Preparation of nanocomposites
ZnO- and MgO-nanoparticle-filled epoxy nanocomposites were prepared using the 6 wt.% TBCP-modified epoxy matrix. The nanoparticles were first dispersed in ethanol using a magnetic stirrer for 5 min. The 6 wt.% TBCP/epoxy resin was then added to the nanoparticle suspension and sonicated for 45 min. Ethanol was removed by heating the mixture on a magnetic stirrer at 70 ℃ for > 1 h until the mass stabilized, confirming solvent evaporation. The mixture was then cooled to room temperature, after which the hardener was added and mixed for 10 min. The formulation was vacuum-degassed to remove entrapped air and then cast onto glass slides and into silicone molds to obtain specimens for optical and mechanical testing. The overall preparation route is schematically shown in Figure 3.

Figure 3. Schematic flowchart of the NP/TBCP/EP nanocomposite coating preparation
3.1 Fourier transform infrared spectroscopy
Functional groups in the epoxy matrix and epoxy/nanoparticle (NP) nanocomposites were characterized by Fourier transform infrared (FTIR) spectroscopy using a Shimadzu IR Affinity-1 spectrometer (Japan). The spectra were analyzed in accordance with ASTM E1252 [14] to identify characteristic bands of the matrix and to compare band positions and intensities between neat epoxy and NP-filled formulations.
3.2 Field-emission scanning electron microscopy
Fractographic analysis was performed on impact-fractured specimens using a field-emission scanning electron microscopy (FESEM; FEI Inspect F50, FEI, The Netherlands). The fracture surfaces were examined to document features associated with crack initiation and propagation within the fractured region.
4.1 Differential scanning calorimetry
Differential scanning calorimetry (DSC) was performed using a Shimadzu FC-60A instrument (Japan) in accordance with ASTM D3418-03 [15] to determine the glass transition temperature (Tg) of the samples. Specimens (8–10 mg ± 0.5 mg) were sealed in aluminum pans and heated from 25 to 300 ℃ at a rate of 10 ℃/min. Measurements were conducted in the laboratory of the Department of Polymer Engineering and Petrochemical Industries.
5.1 Impact test
Impact strength was measured using a Charpy pendulum impact tester (WP 400, Hamburg, Germany) in accordance with ISO 179 [16]. Rectangular unnotched specimens were supported horizontally on two anvils, and the pendulum was released to strike the specimen and induce fracture. The absorbed impact energy was recorded by the instrument, and the unnotched impact strength ($\mathrm{cU}^{\mathrm{a}}$) was calculated from the absorbed energy using Eq. (1). The specimen dimensions used for the impact test are shown in Figure 4 [16].
$c U^a=\left(W_s /(b h)\right) \times 10^3$ (1)
where, $\mathrm{cU}^{\mathrm{a}}$ is the Charpy impact strength (kJ/m²), h is thickness (mm), b is width (mm), and Wₛ is the absorbed energy at break (J).

Figure 4. Dimensions of the Charpy impact specimen used in this study
6.1 UV-Visible spectroscopy
Spectrophotometric analysis is widely used to examine the optical behavior of materials, including nanostructured systems, through their interaction with light over defined wavelength ranges [17]. UV–Vis spectroscopy quantifies optical absorption associated with electronic transitions by transmitting light through a sample and recording the corresponding attenuation in intensity. These transitions occur primarily within the ultraviolet and visible regions, where the absorbed photon energy promotes electrons to higher energy states [18, 19]. The UV–Vis instrument used in this work is shown in Figure 5. UV–Vis spectra (absorbance, transmittance, and reflectance) were recorded using a double-beam spectrophotometer (Shimadzu UV-1800A, Japan) at room temperature over the 200–1100 nm wavelength range. Coatings were cast on glass slides (75 × 25 mm) with an average thickness of 225 µm (0.225 mm). A consistent baseline and identical instrumental settings were applied to all samples to enable direct comparison among compositions. All quantitative optical values reported in the Results and Discussion section were obtained from the instrument-exported UV–Vis tables under identical acquisition settings. Because the spectra were sampled at fixed 20-nm intervals, 540 nm was selected as the visible reference wavelength for cross-composition comparison because it was directly measured in all datasets. For each formulation, reflectance, absorbance, and transmittance at 540 nm were extracted from the corresponding tables, and the derived optical parameters were calculated using the equations provided in Section 6. The raw and processed data used to generate the optical results in Section 7.3 are provided in the Data Availability section. Reflectance spectra were recorded under normal incidence. Fresnel relations were used as a first-order descriptor for qualitative interpretation of interfacial reflection. The absorption coefficient (α) was calculated from the measured absorbance as follows:
$\alpha=2.303 \mathrm{~A} / \mathrm{t}$ (2)
where, A is the absorbance and t is the film thickness. As a fundamental optical parameter, α depends strongly on photon energy and the optical band gap Eg, and it increases sharply when the photon energy approaches or exceeds Eg due to allowed electronic transitions.

Figure 5. Double-beam UV–Vis spectrophotometer used for optical measurements (Shimadzu UV-1800A, Japan)
6.2 Absorbance (A)
Absorbance (A) is a spectrophotometric quantity that relates the incident light intensity (I₀) to the transmitted intensity (I). It is used to quantify optical attenuation and, for solution measurements, to determine concentration via the Beer–Lambert relation. In this study, absorbance was evaluated using Eqs. (3) and (4) [20].
$A=\log _{10}(1 / T)$ (3)
$\mathrm{A}=\log _{10}\left(\mathrm{I}_0 / \mathrm{I}\right)$ (4)
where,
6.3 Transmittance (T)
Transmittance (T) is defined as the ratio of the transmitted intensity through the film (IT) to the incident intensity (I0). Accordingly, T was calculated using Eq. (5) [21].
$\mathrm{T}=\mathrm{I}_{\mathrm{T}} / \mathrm{I}_0$ (5)
where,
6.4 Reflectance (R)
Reflectance (R) is defined as the fraction of incident radiant power reflected from a surface. For an interface between an incident medium of refractive index n₁ (≈1 for air) and a non‑absorbing medium of refractive index n₂, the normal‑incidence reflectance can be approximated by the Fresnel relation in Eq. (6) [22].
$R=\left(\frac{n_1-n_2}{n_1+n_2}\right)^2$ (6)
In this study, Eq. (6) is used as a first‑order descriptor under the assumption of normal incidence; the measured spectra additionally include contributions from surface roughness and nanoparticle‑induced scattering.
where,
6.5 Optical conductivity (σop)
Optical conductivity (σop) describes the response of charge carriers to an oscillating electromagnetic field and is often used to interpret photon‑induced electronic processes in polymers and nanocomposites, and was calculated using Eq. (7) [23, 24].
$\sigma_{o p}=(\alpha n c) /(4 \pi)$ (7)
where, σop is the optical conductivity, c is the speed of light, α is the absorption coefficient, and n is the refractive index.
7.1 Fourier transform infrared spectroscopy results
FTIR analysis was used here to (i) verify the preservation of the cured epoxy chemical structure after TBCP and nanoparticle incorporation and (ii) identify the dominant intermolecular interactions governing compatibility in the blends and nanocomposites [25-28].
Table 2, together with Figure 6, provides the characteristic FTIR bands of EP and their assignments. Because the spectra are plotted as percent transmittance (%T) versus wavenumber, the downward features (drops in %T) represent absorption bands (i.e., increased absorption lowers the transmitted intensity), whereas upward segments (increases in %T) correspond to spectral intervals with comparatively lower absorption between neighboring bands. Accordingly, the absorption-band profile in Figure 6 reflects alternating regions of relatively weak and strong absorption.
Table 2. Fourier transform infrared (FTIR) spectroscopy wavenumber assignments for neat epoxy (EP)
|
Wavenumber, cm-1 |
Assignments |
|
3433.29 |
O-H stretching |
|
2870–2924 |
C-H aliphatic |
|
1612 |
C=C aromatic |
|
1465.9 |
C-H bending |
|
1095-1249 |
C-O-C |
|
772 |
CH₂ rocking vibration |

Figure 6. Fourier transform infrared (FTIR) spectrum of neat epoxy (EP)
The EP spectrum exhibits a broad O–H stretching envelope centered at 3433.29 cm⁻¹ (Table 2), visible as a pronounced drop in %T and assigned to hydroxyl groups formed during epoxy–amine curing. Additional drops in the 2870–2924 cm⁻¹ region correspond to aliphatic C–H stretching vibrations. The aromatic contribution is indicated by the band at 1612 cm⁻¹ (aromatic C=C stretching) followed by the 1465.9 cm⁻¹ band (C–H bending), both appearing as clear transmittance minima. In the fingerprint region, the interval 1095–1249 cm⁻¹ shows multiple drops associated with C–O–C stretching vibrations of the epoxy/ether linkages, followed by partial recovery (rise) between adjacent absorptions. Finally, the band at 772 cm⁻¹ (CH₂ rocking) appears as another characteristic decrease in %T. Overall, Figure 6 and Table 2 confirm the expected cured epoxy structure and provide the baseline reference against which the modified systems (Figures 7 and 8) are interpreted.

Figure 7. Fourier transform infrared (FTIR) spectrum of the TBCP/EP blend
Figure 7 compares neat EP (baseline/reference) with the TBCP-containing formulations (e.g., 1 wt.% and 6 wt.% TBCP/EP). Across the full wavenumber range, the principal band positions remain consistent with EP, and no additional absorption bands indicative of new covalent-bond formation are observed upon TBCP incorporation. This indicates that the modification proceeds predominantly via physical interactions rather than chemical restructuring of the epoxy network [25, 26].
The most diagnostic difference between EP and the TBCP/EP spectra occurs in the hydroxyl region near ~3433 cm⁻¹. Relative to neat EP, the TBCP-containing curves show a modified O–H envelope (typically manifested in %T representation as a broader and/or deeper transmittance minimum distributed over a wider wavenumber interval). This behavior is consistent with a broader distribution of hydrogen-bonded hydroxyl environments created by –OH···O– interactions between epoxy hydroxyl groups and ether oxygen atoms within the polyether (PEO/PPO) segments of TBCP [27]. In contrast, the preservation of the fingerprint features—particularly the C–O–C stretching region (1095–1249 cm⁻¹)—indicates that the epoxy backbone remains intact and that the spectral changes mainly originate from altered intermolecular interactions and microenvironmental effects, not from new chemical functionalities. Collectively, the EP-to-TBCP/EP spectral comparisons in Figure 7 support hydrogen-bond-assisted compatibility, consistent with the formation of a transparent/compatible blend matrix [28].


Figure 8. FTIR spectra of (a) ZnO/6 wt.% TBCP/EP and (b) MgO/6 wt.% TBCP/EP nanocomposites at 0.5 and 3 wt.% nanoparticle loadings
Figures 8(a) and (b) extend the comparison to oxide-filled systems (ZnO/6 wt.% TBCP/EP and MgO/6 wt.% TBCP/EP) relative to neat EP and the EP/6%TBCP reference. In both series, the spectra retain the same epoxy/TBCP characteristic bands, again supporting the absence of new covalent-bond formation and indicating that the nanoparticles primarily influence interfacial interactions and local bonding environments.
In the fingerprint region highlighted in Figure 8, the labeled absorptions at 1512.19 cm⁻¹ and 1456.90 cm⁻¹ remain associated with aromatic/C–H deformation contributions of the cured epoxy network, while the bands at 1249.87 cm⁻¹, 1180.44 cm⁻¹, and 1095.57 cm⁻¹ are consistent with ether-related vibrations (C–O–C stretching) within the epoxy/polyether-containing matrix. The persistence of these positions across EP, EP/6%TBCP, and the nanoparticle-filled formulations indicates that the polymer backbone chemistry is preserved. However, the relative depth/broadness of the corresponding %T minima can change with nanoparticle incorporation, reflecting modifications in dipole–dipole coupling and hydrogen-bonding strength near the oxide–polymer interface (i.e., interfacial polarization and constrained chain environments) rather than formation of new functional groups.
At lower wavenumbers, the labeled features at 794.67 cm⁻¹ and 694.37 cm⁻¹ remain within the epoxy fingerprint range (out-of-plane and ring-related/CH₂ rocking–type contributions depending on the cured network environment), while the band at 462.92 cm⁻¹ lies in the region commonly associated with metal–oxygen lattice vibrations. The appearance and/or strengthening of the ~462.92 cm⁻¹ feature in the oxide-filled systems is therefore consistent with the presence of the oxide phase and its contribution to the composite infrared response, supporting successful nanoparticle incorporation and an interfacial interaction mechanism rather than chemical grafting. Importantly, the comparative trend across the series in Figure 8—EP → EP/6%TBCP → EP/6%TBCP/oxide (0.5–3 wt.%)—shows that the primary spectral differences remain concentrated in the hydroxyl and ether-rich fingerprint regions, which aligns with the expected interfacial hydrogen-bonding/polar interactions in epoxy–polyether–oxide systems and is consistent with the observed compatible/transparent matrix behavior.
7.2 Field-emission scanning electron microscopy results
Figures 9 and 10 present FESEM micrographs of EP, TBCP/EP, and the corresponding nanoparticle-filled nanocomposites. The fracture surfaces of TBCP/EP blends at representative TBCP contents (1 and 6 wt.%), and nanocomposites at representative nanoparticle loadings (0.5 and 3 wt.%) are shown.


Figure 9. Field-emission scanning electron microscopy (FESEM) micrographs of (a) neat epoxy (EP), (b) 1 wt.% TBCP/EP, and (c) 6 wt.% TBCP/EP, showing the evolution of the phase-separated morphology with increasing TBCP content


Figure 10. Field-emission scanning electron microscopy (FESEM) micrographs of 6 wt.% TBCP/EP nanocomposite coatings (a) ZnO-filled (0.5 wt.%), (b) ZnO-filled (3 wt.%), (c) MgO-filled (0.5 wt.%), (d) MgO-filled (3 wt.%), showing the effect of nanoparticle loading on dispersion-related features and fracture-surface topography
At 1 wt.% TBCP, small dark spherical domains are observed and are relatively uniformly distributed within the epoxy matrix (Figures 9(b) and (c)). Increasing the TBCP content to 6 wt.% yields larger and more clearly defined domains, with an increased areal fraction. The dark regions are assigned to the dispersed TBCP-rich phase, and the observed increase in domain size and fraction reflects the morphology evolution with toughener content [29].
The fracture-surface morphology indicates crack-path tortuosity, crack pinning, and localized plastic deformation, which are consistent with the impact behavior. The presence of discrete soft domains and associated interfacial regions is consistent with toughening mechanisms reported for phase-separated epoxy systems, including increased crack-path tortuosity, crack pinning, and localized plastic deformation. In addition, the observed heterogeneities introduce internal refractive-index contrast, which is considered alongside the optical results.
For the nanocomposites, the micrographs show filler-related features within the TBCP/EP matrix. Discrete nanoparticle-rich regions are interpreted as scattering sites relevant to the measured transmittance/reflectance trends, whereas larger clusters are treated as microstructural non-uniformities. The combined observations support treating TBCP-induced morphology and nanoparticle dispersion as coupled structural variables governing fracture-surface features and optical response.
Figures 10(a)-(d) show FESEM micrographs of the 6 wt.% TBCP/EP nanocomposites containing 0.5 and 3 wt.% ZnO or MgO. Compared with the unfilled blend, the nanoparticle-filled coatings exhibit a rougher and more irregular fracture surface, consistent with increased microstructural heterogeneity and the presence of particle–matrix interfaces. At 0.5 wt.% loading, the micrographs show a more uniform distribution of nanoparticle-related features within the matrix. At 3 wt.% loading, nanoparticle-rich regions with larger feature sizes are observed, indicating localized clustering and reduced dispersion uniformity. These features are discussed as potential preferential sites for damage initiation under impact loading. The observed trends are consistent with prior reports on oxide-filled epoxy systems [30].
Figure 10 shows concentration-dependent dispersion states for both ZnO and MgO within the TBCP-modified epoxy. At 0.5 wt.% ZnO, the fracture morphology indicates a more uniform distribution of nanoparticle-related features with limited agglomeration. At 3 wt.% ZnO, larger ZnO-rich regions and discernible aggregates are observed, reflecting increased microstructural heterogeneity. These aggregates are treated as local stress concentrators in the discussion of the impact results, whereas the more uniform microstructure at 0.5 wt.% is discussed in terms of more distributed filler–matrix interfacial regions.
The dispersion state is also discussed alongside the optical measurements. A more homogeneous nanoparticle distribution is aligned with a distributed scattering regime across the coating, while aggregation is aligned with stronger localized scattering and increased back-scattering, which corresponds to higher measured reflectance and reduced photon penetration depth within the coating. These microstructural observations are presented as consistent with the impact and reflectance trends reported in the subsequent sections.
7.3 Results of the optical test
For consistent curve-to-curve comparison, optical metrics were evaluated at 540 nm, which is explicitly sampled in the exported spectra (20 nm step). Trends are interpreted from the relative rise/drop of each formulation versus neat EP and across nanoparticle loadings.
7.3.1 Reflectance (R)
Figure 11 compares the reflectance response of the 6 wt.% TBCP/EP coatings containing ZnO and MgO. In both series, the reflectance curves rise with increasing oxide loading, which indicates enhanced back-scattering and optical return caused by the higher density of oxide–polymer interfaces and the resulting refractive-index contrast. At 540 nm, neat EP exhibits a diffuse reflectance of 69.85%. In Figure 11(a), the ZnO series shows a clear, monotonic rise from the EP baseline to 71.96% (0.5 wt.% ZnO), 73.43% (1 wt.% ZnO), and 74.79% (1.5 wt.% ZnO), followed by a stronger increase to 78.49% (2 wt.% ZnO) and 79.27% (3 wt.% ZnO) [31, 32].


In Figure 11(b), the MgO-filled series shows a stronger loading-dependent increase in reflectance at the selected visible reference wavelength (540 nm). At 540 nm, neat EP exhibits a reflectance of 69.85%, whereas the MgO-containing coatings increase to 76.67% (0.5 wt.% MgO), 79.08% (1 wt.% MgO), 80.48% (1.5 wt.% MgO), 81.61% (2 wt.% MgO), and 83.41% (3 wt.% MgO). At matched loadings, MgO consistently yields higher reflectance than ZnO, confirming a larger visible-range reflectance enhancement under identical acquisition conditions and supporting the conclusion that MgO provides the greater improvement in diffuse back-scattering within the 6 wt.% TBCP/EP matrix.
7.3.2 Absorbance (A)
Figure 12 presents the absorbance response for (a) ZnO-filled and (b) MgO-filled coatings. At 540 nm, neat EP shows A₅₄₀ = 2.8170. In Figure 12(a), absorbance decreases systematically with ZnO loading, dropping from the EP baseline to A₅₄₀ = 2.5770 at 0.5 wt.% ZnO, 2.4070 at 1 wt.% ZnO, and 2.2470 at 1.5 wt.% ZnO, then falling more strongly to 1.7950 at 2 wt.% ZnO and 1.6960 at 3 wt.% ZnO. This progressive downward shift is beneficial at the selected visible reference wavelength because it indicates a reduction in the measured absorbance component relative to EP, consistent with improved visible-range optical behavior at 540 nm.


Figure 12. UV–Vis absorbance spectra of epoxy coatings containing 6 wt.% TBCP with different nanoparticle loadings (0.5–3 wt.%) (a) ZnO and (b) MgO, recorded over 200–1100 nm at room temperature
In Figure 12(b), the MgO series shows a larger absorbance reduction at 540 nm than the ZnO series at comparable loadings. Starting from EP (A₅₄₀ = 2.8170), the absorbance decreases to 2.0200 at 0.5 wt.% MgO, 1.7200 at 1 wt.% MgO, 1.5400 at 1.5 wt.% MgO, 1.3900 at 2 wt.% MgO, and 1.1400 at 3 wt.% MgO. Therefore, both oxides yield a favorable reduction in A₅₄₀ relative to EP, while MgO provides the more pronounced improvement at every corresponding loading, reinforcing the oxide-dependent magnitude of the optical modification [33].
7.3.3 Transmittance (T)
Figure 13 shows the transmittance response for ZnO-filled and MgO-filled coatings. At 540 nm, neat EP exhibits T₅₄₀ = 0.197583. In Figure 13(a), transmittance increases consistently with ZnO loading, rising above the EP baseline to T₅₄₀ = 0.226856 at 0.5 wt.% ZnO, 0.250179 at 1 wt.% ZnO, and 0.274315 at 1.5 wt.% ZnO, then increasing more strongly to 0.355836 at 2 wt.% ZnO and 0.376704 at 3 wt.% ZnO. This monotonic curve rise represents a positive enhancement in transmitted intensity at the visible reference wavelength compared with EP, confirming a loading-dependent improvement in transmission performance at 540 nm for the ZnO-filled formulations [34].


Figure 13. UV–Vis transmittance spectra of epoxy coatings containing 6 wt.% TBCP with different nanoparticle loadings (0.5–3 wt.%) (a) ZnO and (b) MgO, recorded over 200–1100 nm at room temperature
In Figure 13(b), MgO produces a larger transmittance increase than ZnO at matched loadings. Relative to EP (T₅₄₀ = 0.197583), transmittance rises to 0.312608 at 0.5 wt.% MgO, 0.371535 at 1 wt.% MgO, 0.412098 at 1.5 wt.% MgO, 0.449262 at 2 wt.% MgO, and reaches 0.518800 at 3 wt.% MgO. The consistently higher T₅₄₀ values for MgO represent an additional improvement over ZnO at the same loading levels, indicating that MgO more strongly enhances transmitted intensity at 540 nm within the same 6 wt.% TBCP/EP matrix [34].
7.3.4 Optical conductivity (σop)
Figures 14(a) and (b) show the wavelength dependence of the optical conductivity (σop) for the ZnO/6 wt.% TBCP/EP and MgO/6 wt.% TBCP/EP coatings. In this work, σop is derived from the absorption coefficient (α) (Eq. (2)) using Eq. (7); therefore, changes in σop directly track the extracted α obtained from the UV–Vis measurements, and the nanoparticle-filled systems are expected to exhibit lower σop when α decreases across the measured range.
At the visible reference wavelength of 540 nm, neat epoxy exhibits σop, 540 = 2.47 × 10¹² S.m-1. In Figure 14(a) (ZnO series), σop shows a small initial rise at low loading, increasing to 2.50 × 10¹² at 0.5 wt.% ZnO and then slightly decreasing to 2.48 × 10¹² at 1 wt.% ZnO, before dropping below the EP baseline at higher loadings to 2.43 × 10¹² at 1.5 wt.% ZnO, and decreasing more sharply to 2.13 × 10¹² at 2 wt.% ZnO and 2.03 × 10¹² at 3 wt.% ZnO. This indicates that the ZnO-filled coatings transition from a near-baseline (or marginally higher) σop at low loading to a clearly reduced σop at ≥1.5 wt.% ZnO, consistent with the interpretation that σop decreases when the extracted α decreases due to reduced photon penetration and scattering-assisted attenuation within the coating.


Figure 14. Optical conductivity (σop) as a function of wavelength for epoxy coatings containing 6 wt.% TBCP with different nanoparticle loadings (0.5–3 wt.%) (a) ZnO and (b) MgO, calculated from the UV–Vis spectra using Eq. (7) over 200–1100 nm at room temperature
In Figure 14(b) (MgO series), the reduction in σop at 540 nm is more systematic and markedly stronger relative to EP. Starting from 2.47 × 10¹² for EP, σop decreases to 2.31 × 10¹² at 0.5 wt.% MgO, then drops further to 2.06 × 10¹² at 1 wt.% MgO and 1.86 × 10¹² at 1.5 wt.% MgO, reaching 1.68 × 10¹² at 2 wt.% MgO and 1.35 × 10¹² at 3 wt.% MgO. Compared with the EP baseline, these values confirm a clear loading-dependent decrease in σop, which is a favorable shift within the framework used in this study because σop is calculated from α; thus, lower σop reflects the reduced absorption contribution used in the σop calculation as photon penetration becomes increasingly limited by the nanoparticle-induced scattering/reflectance balance.
Accordingly, the σop trends are interpreted primarily in terms of the measured reflectance/back-scattering and scattering-assisted attenuation that limit photon penetration into the coating, thereby reducing the absorption contribution used in the σop calculation. The wide band gaps of ZnO and MgO (typically ~3.3 eV for ZnO and ~7.8 eV for MgO) are also noted as consistent with weak intrinsic absorption in the visible range and stronger absorption features occurring predominantly in the UV region [35, 36].
Overall, at 540 nm, both oxide systems deliver σop values at or below the EP baseline at sufficiently high loadings, with MgO providing the larger and more monotonic reduction. When considered alongside the concurrently increased reflectance (Figure 11) and modified attenuation balance discussed for absorbance/transmittance (Figures 12 and 13), the σop trends in Figure 14 support the same microstructure–optics narrative: nanoparticle incorporation intensifies scattering/back-reflection, reduces effective photon penetration, and thereby lowers the derived σop through its dependence on α.
7.4 Mechanical tests
7.4.1 Impact test
Figure 15 shows the effect of incorporating TBCP into the epoxy matrix on impact strength. The impact strength increases as the TBCP content increases from 1 to 6 wt.% and then decreases at 9 wt.%, while remaining higher than that of neat epoxy [37]. This response is discussed in relation to the formation of a dispersed soft phase in phase-separated epoxy systems, which is reported to promote energy dissipation during fracture through mechanisms such as crack-path deflection and localized plastic deformation at intermediate toughener contents. At higher toughener loading, the reduced impact strength is discussed in terms of increased matrix plasticization and changes in phase morphology (e.g., larger soft domains), which reduce the effectiveness of load transfer and toughening efficiency.

Figure 15. The influence of TBCP concentrations (1, 3, 6, and 9 wt.%) on epoxy matrix impact strength
Collectively, the impact data identify 6 wt.% TBCP as the composition that provides the maximum impact strength within the investigated range. This improvement is considered together with the DSC results, which show a decrease in Tg after TBCP incorporation. Accordingly, 6 wt.% TBCP was selected as the matrix composition for subsequent nanocomposites to maximize impact performance while maintaining the measured Tg within the required range.
Figure 16 shows the effect of ZnO and MgO nanoparticle loading (0.5–3 wt.%) on the impact strength of the 6 wt.% TBCP/EP matrix. For both fillers, the impact response generally varies with nanoparticle loading, with values remaining higher than those of neat EP and the unfilled 6 wt.% TBCP/EP blend. This response is discussed in relation to nanoparticle-toughened epoxy systems reported in the literature, where rigid particles and particle–matrix interfaces are associated with fracture-surface features attributed to crack-path deflection, crack pinning, and localized plastic deformation, which increase the absorbed impact energy [38]. In addition, increasing nanoparticle loading increases the particle–matrix interfacial area, and the impact response is considered alongside the dispersion-related microstructural observations, because interfacial area and dispersion uniformity affect load transfer and crack development during impact loading [38].

Figure 16. Effect of nanoparticle loading (0.5–3 wt.% of ZnO or MgO) on the impact strength of the 6 wt.% TBCP/EP matrix
7.5 Thermal results (Differential scanning calorimetry)
To provide a transparent interpretation, the DSC results are discussed below on a figure-by-figure basis (Figures 17-22), with explicit reference to the transition temperatures annotated on each thermogram. This organization enables direct comparison among formulations and avoids consolidating multiple figures into a single paragraph. In addition to the Tg-related baseline shift, the thermograms show a higher-temperature exothermic response, which is assigned to residual epoxy–amine reaction/post-curing during the DSC scan [39].
For consistency, the glass Tg is discussed using the transition temperature identified from each thermogram (typically within ~45–85 ℃) and cross-checked against the Tg values summarized in Table 3. Any minor numerical differences between the annotated values in the figures and those listed in Table 3 are attributed to rounding and to the Tg reporting convention used during DSC analysis.
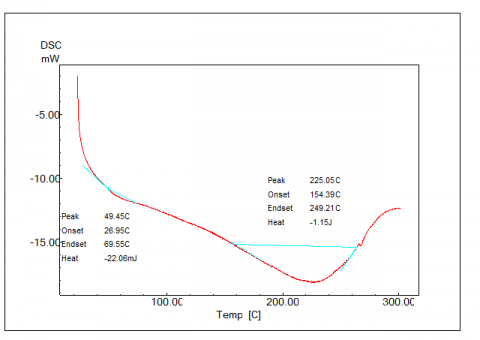
As shown in Figure 17, neat EP exhibits a glass-transition-related thermal transition with a peak at 49.45 ℃ (Table 3 reports Tg = 49.5 ℃), which is taken as the reference thermal transition of the cured epoxy network. A higher-temperature exothermic event is also annotated in Figure 17 (Peak = 225.05 ℃; Onset = 154.39℃; Endset = 249.21 ℃). This event is assigned to residual epoxy–amine reaction/post-curing during the DSC scan, consistent with the interpretation adopted for the subsequent thermograms. The neat-EP thermogram provides the baseline for comparing the effects of TBCP and oxide nanoparticles on Tg and the higher-temperature exothermic response in Figures 18-22.
Figure 17. Differential scanning calorimetry (DSC) thermogram of neat epoxy (EP)
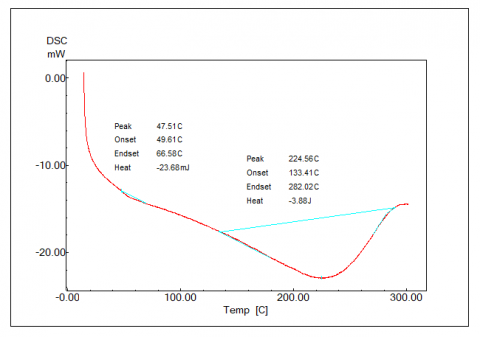
Figure 18. Differential scanning calorimetry (DSC) thermogram of the 6 wt.% TBCP/EP blend
Figure 18 shows that incorporating 6 wt.% TBCP into epoxy shifts the glass-transition-related response to a lower temperature (Peak = 47.51 ℃; Table 3: Tg = 47.5 ℃) compared with neat EP (Figure 17). This shift is attributed to the introduction of flexible polyether segments and associated free-volume contributions, which increase segmental mobility and reduce the apparent network constraint. The higher-temperature exothermic event remains evident in Figure 18 (Peak = 224.56 ℃; Onset = 133.41 ℃; Endset = 282.02 ℃). This feature is assigned to residual epoxy–amine reaction/post-curing under the DSC scan, indicating that the high-temperature cure-related response is retained after TBCP incorporation. Differences in the onset/endset range and the shape of the exothermic feature relative to neat epoxy are discussed as changes in the post-curing response of the formulation after adding the polyether component, consistent with prior reports on polyether-modified epoxy systems [29].
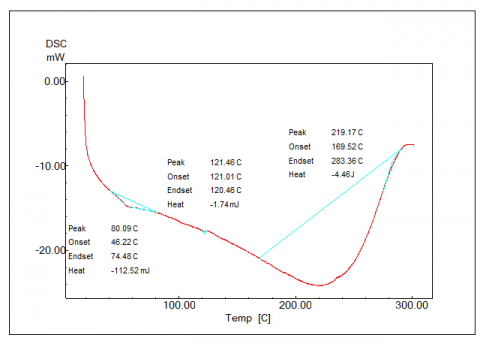
In Figure 19 (0.5 wt.% ZnO/6 wt.% TBCP/EP), the Tg-related transition occurs at a higher temperature, with Peak = 80.09 ℃ (Table 3: Tg = 80.59 ℃). This Tg increase is discussed as a nanoparticle-associated restriction of segmental mobility within the nanocomposite, consistent with interfacial constraint effects reported for oxide-filled epoxy systems. Figure 19 also shows a subtle additional thermal feature at Peak = 121.48 ℃; this feature is reported descriptively as annotated on the thermogram and is discussed as a secondary relaxation/transition arising from structural heterogeneity in the modified network. The higher-temperature exothermic event remains present in Figure 19 (Peak = 219.17 ℃; Onset = 169.52 ℃; Endset = 283.38 ℃), indicating that the high-temperature cure/post-curing response under the DSC scan is retained. The observed Tg elevation aligns with prior reports attributing Tg increases in polymer nanocomposites to interfacial regions that constrain chain motion near nanoparticle surfaces [40, 41].
Figure 19. Differential scanning calorimetry (DSC) thermogram of ZnO/6 wt.% TBCP/EP nanocomposite containing 0.5 wt.% ZnO
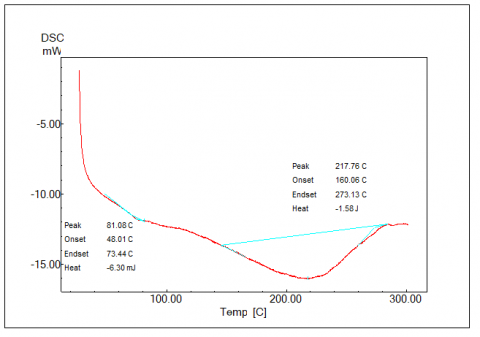
Figure 20. Differential scanning calorimetry (DSC) thermogram of ZnO/6 wt.% TBCP/EP nanocomposite containing 3 wt.% ZnO
As the ZnO loading increases to 3 wt.% (Figure 20), the Tg-related transition remains high, with Peak = 81.08 ℃, which is comparable to the 0.5 wt.% ZnO formulation (Figure 19). The difference in Tg between 0.5 and 3 wt.% ZnO is reported as modest within the tested range and is discussed as a reduced incremental change in Tg at higher filler contents. This behavior is considered alongside the microstructural observations because the dispersion state and the extent of nanoparticle-rich regions influence the fraction of polymer subjected to interfacial constraint.
The higher-temperature exothermic event in Figure 20 (Peak = 224.31 ℃; Onset = 187.26 ℃; Endset = 272.87 ℃) remains present and falls within the range observed for the other formulations, indicating that the high-temperature cure/post-curing response under the DSC scan is retained. Accordingly, the primary thermal difference among the ZnO-containing formulations is discussed in terms of the Tg-related transition rather than loss of the high-temperature response.
Figure 21. Differential scanning calorimetry (DSC) thermogram of MgO/6 wt.% TBCP/EP nanocomposite containing 0.5 wt.% MgO
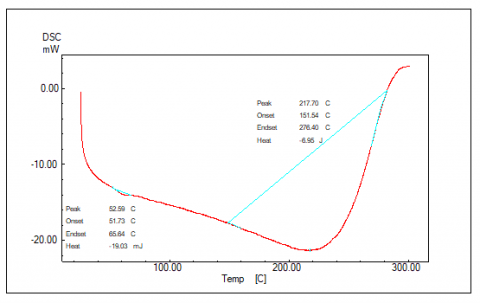
For the MgO-filled nanocomposites, Figure 21 (0.5 wt.% MgO/6 wt.% TBCP/EP) shows a Tg-related transition with Peak = 52.59 ℃ (Table 3: Tg = 52.59 ℃), which is higher than the unfilled 6 wt.% TBCP/EP blend (Figure 18). This Tg shift is discussed as a nanoparticle-associated restriction of segmental mobility within the MgO-containing formulation. Under the present compositions and processing conditions, the Tg increase for MgO at 0.5 wt.% is smaller than that measured for ZnO at the same loading. The higher-temperature exothermic event in Figure 21 (Peak = 217.70 ℃; Onset = 151.54 ℃; Endset = 276.40 ℃) remains present, indicating retention of the high-temperature cure/post-curing response under the DSC scan.
Figure 22. Differential scanning calorimetry (DSC) thermogram of MgO/6 wt.% TBCP/EP nanocomposite containing 3 wt.% MgO
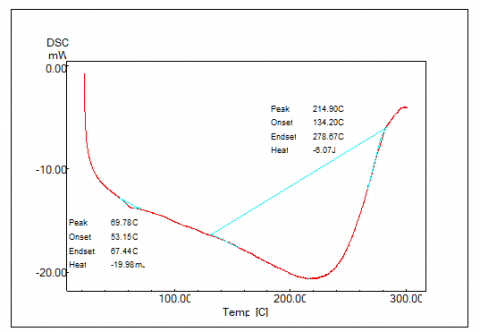
At 3 wt.% MgO (Figure 22), the Tg-related transition shifts to a higher temperature, with Peak = 69.78 ℃ (Table 3: Tg = 69.78 ℃), compared with the unfilled 6 wt.% TBCP/EP blend (Figure 18). This Tg shift is discussed as an increased fraction of polymer experiencing nanoparticle-associated mobility restriction as MgO content increases. The measured Tg for the 3 wt.% MgO formulation remains lower than the Tg values measured for the ZnO-filled counterparts (Figures 19 and 20) under the same matrix and processing conditions, and this difference is discussed in relation to filler-specific interfacial effects and dispersion-related microstructural features observed in the corresponding FESEM analysis.
The higher-temperature exothermic event in Figure 22 (Peak = 214.90 ℃; Onset = 134.20 ℃; Endset = 278.67 ℃) remains present and within the same overall range as the other formulations, indicating that the high-temperature cure/post-curing response under the DSC scan is retained across all nanocomposites.
Table 3. Glass transition temperature (Tg) of pure epoxy, 6% TBCP/EP, and ZnO/6%TBCP/EP and MgO/6%TBCP/EP nanocomposites (0.5 and 3 wt.%)
|
Sample |
Tg (°C) |
|
EP |
49.5 |
|
6% TBCP/EP |
47.5 |
|
0.5% ZnO/6% TBCP/EP |
80.59 |
|
3% ZnO/6% TBCP/EP |
81.08 |
|
0.5% MgO/6% TBCP/EP |
52.59 |
|
3% MgO/6% TBCP/EP |
69.78 |
Overall, the Tg values derived from Table 3 and the thermogram annotations show that the ZnO-filled formulations exhibited the highest Tg values, with comparable values for 3 wt.% ZnO/6 wt.% TBCP/EP (81.08 ℃) and 0.5 wt.% ZnO/6 wt.% TBCP/EP (80.59 ℃). The MgO-filled formulations showed intermediate Tg values, with 69.78 ℃ for 3 wt.% MgO/6 wt.% TBCP/EP and 52.59 ℃ for 0.5 wt.% MgO/6 wt.% TBCP/EP. Both oxide-filled systems remained above neat EP (49.5 ℃) and the unfilled 6 wt.% TBCP/EP blend (47.5 ℃). This comparison shows that oxide nanoparticle incorporation offsets the Tg decrease observed after adding TBCP, and that the ZnO-filled formulations exhibit the highest Tg values within the investigated set.
Accordingly, based on the measured Tg values and the figure-by-figure thermogram annotations (Figures 19 and 20), the ZnO-filled formulations provide the highest Tg values among the tested compositions, with comparable Tg values at 0.5 and 3 wt.% ZnO. This thermal ranking is considered together with the optical and impact results when selecting the most suitable formulation for the target coating application.
This study establishes an epoxy nanocoating platform in which optical and mechanical functions are tuned using a two-component modifier system. The first component is a phase-separating polyether polyol (TBCP polyol), which controls fracture-surface morphology. The second component is metal-oxide nanoparticles (ZnO or MgO), which modify light interaction through refractive-index contrast and scattering. Within the explored composition window, the coatings show increased visible-range reflectance (a clear visible-range reflectance increase, with the highest value obtained for 3 wt.% MgO, as obtained from the measured reflectance spectra) together with improved impact strength relative to neat epoxy. The results support a design approach in which multifunctional performance is governed by coupled variables (toughener-induced morphology and nanoparticle dispersion) rather than nanoparticle loading alone. The reduced incremental reflectance gain at higher loadings is discussed as a saturation-type response linked to multiple scattering and dispersion-related microstructural features, while impact performance and processability depend on viscosity increases and nanoparticle-rich regions that act as local heterogeneities. Accordingly, composition selection is based on balancing reflectance improvement with mechanical durability and thermal requirements for the intended application.
The co-modification strategy can be extended by incorporating functional fillers (e.g., thermochromic, electrically conductive, or phase-change particles) to provide additional optical/thermal functionality. Future work will quantify structure–property linkages using domain-size statistics and dispersion metrics, combined with simplified scattering/transport descriptions. Geometry-controlled optical measurements (e.g., variable-angle reflectance and integrating-sphere measurements to separate specular and diffuse components), ellipsometry-based extraction of wavelength-dependent optical constants (n, k), and tighter thickness control will enable quantitative fitting using scattering and radiative-transfer frameworks and will allow assessment of thin-film interference effects. In parallel, microstructure statistics (domain-size distributions and nanoparticle dispersion metrics) will be correlated with optical response and durability to establish a predictive structure–property framework for formulation optimization.
Raw and processed datasets supporting Figures 11-16 are publicly available at Zenodo (https://doi.org/10.5281/zenodo.18516529). These include (i) UV–Vis reflectance/absorbance/transmittance tables and the derived optical parameters used to generate Figures 11-14, together with the associated processing sheets, and (ii) the complete numerical tables for the impact strength results shown in Figures 15 and 16.
|
A |
Absorbance |
|
b |
Specimen width, mm |
|
c |
Speed of light, m.s-1 |
|
h |
Specimen thickness, mm |
|
I |
Intensity of transmitted light |
|
I0 |
Intensity of incident (received) light |
|
IT |
Intensity of transmitted light |
|
n |
Refractive index |
|
n1 |
Refractive index of incident medium |
|
n2 |
Refractive index of coating/substrate |
|
R |
Reflectance |
|
T |
Transmittance |
|
Tg |
Glass transition temperature, ℃ |
|
Ws |
Energy at break, J |
|
Greek symbols |
|
|
α |
Absorption coefficient, m-1 |
|
σop |
Optical conductivity, S.m-1 |
[1] Dong, M., Zhang, H., Tzounis, L., Santagiuliana, G., Bilotti, E., Papageorgiou, D.G. (2021). Multifunctional epoxy nanocomposites reinforced by two-dimensional materials: A review. Carbon, 185: 57-81. https://doi.org/10.1016/j.carbon.2021.09.009
[2] Abdulghani, S.O., Salih, S.I., Mohammed, A.S. (2024). Toughening of epoxy systems by adding three toughness modifiers as quaternary blends of polymeric materials. Revue des Composites et des Materiaux Avances, 34(5): 621. https://doi.org/10.18280/rcma.340510
[3] Wei, H.Z., Wang, D.Y., Xing, W.F. (2023). Strengthening and toughening technology of epoxy resin. Journal of Physics: Conference Series, 2468(1): 012066. https://doi.org/10.1088/1742-6596/2468/1/012066
[4] Jaafar, C.A., Zainol, I., Ishak, N.S., Ilyas, R.A., Sapuan, S.M. (2021). Effects of the liquid natural rubber (LNR) on mechanical properties and microstructure of epoxy/silica/kenaf hybrid composite for potential automotive applications. Journal of Materials Research and Technology, 12: 1026-1038. https://doi.org/10.1016/j.jmrt.2021.03.020
[5] Yao, D.D., Li, Y.C., Zhang, H.M., Xin, Y.Y., Fan, W.D., Zheng, Y.P. (2024). Preparation and mechanical properties of epoxy resin filled with shaped hybrid nanobrushes. Reactive and Functional Polymers, 195: 105814. https://doi.org/10.1016/j.reactfunctpolym.2023.105814
[6] Shakir, W.A., Abdullah, S.H., Mustafa, F.I., Ateia, K.K., Ibraheem, A.M. (2018). Optical properties of ZnTiO3/epoxy nanocomposites thin films. International Journal of Scientific Research and Management, 6(10): 100-106. https://doi.org/10.18535/ijsrm/v6i10.ec01
[7] Moussa, S., Namouchi, F., Guermazi, H. (2015). Elaboration, structural and optical investigations of ZnO/epoxy nanocomposites. The European Physical Journal Plus, 130(7): 152. https://doi.org/10.1140/epjp/i2015-15152-y
[8] Chen, L. (2019). U.S. Patent No. 10,280,345. Washington, DC: U.S. Patent and Trademark Office. https://patents.google.com/patent/US10280345B2/en.
[9] Li, G., Wu, W.J., Yu, X.C., Zhang, R.Y., Sun, R., Cao, L.Q., Zhu, P.L. (2023). Effects of block copolymer terminal groups on toughening epoxy-based composites: Microstructures and toughening mechanisms. Micromachines, 14(11): 2112. https://doi.org/10.3390/mi14112112
[10] Brangule, A. (2023). Nano ZnO: Structure, synthesis routes, and properties. Materials Research Foundations, 146: 1-34. https://doi.org/10.21741/9781644902394-1
[11] Arora, A.K., Devi, S., Jaswal, V.S., Singh, J., Kinger, M., Gupta, V.D. (2014). Synthesis and characterization of ZnO nanoparticles. Oriental Journal of Chemistry, 30(4): 1671-1679. https://doi.org/10.13005/OJC/300427
[12] Khairallah, F., Glisenti, A. (2008). Nanoscale magnesium oxide. In Materials Syntheses: A Practical Guide, pp. 111-115. https://doi.org/10.1007/978-3-211-75125-1_15
[13] Kivaisi, R.T. (1982). Optical properties of obliquely evaporated aluminium films. Thin Solid Films, 97(2): 153-163. https://doi.org/10.1016/0040-6090(82)90224-3
[14] ASTM E1252-98. (2021). Standard practice for general techniques for obtaining infrared spectra for qualitative analysis. ASTM International, USA.
[15] Musteață, A.E., Pirvu, C., Deleanu, L., Georgescu, C. (2019). Simulation of Charpy test for different impact velocities. IOP Conference Series: Materials Science and Engineering, 514(1): 012011. https://doi.org/10.1088/1757-899X/514/1/012011
[16] Fan, X.J., Qu, R.T., Zhang, Z.F. (2022). Remarkably high fracture toughness of HfNbTaTiZr refractory high-entropy alloy. Journal of Materials Science & Technology, 123: 70-77. https://doi.org/10.1016/j.jmst.2022.01.017
[17] Johnson, B.I., Avval, T.G., Turley, R.S., Linford, M.R., Allred, D.D. (2021). Oxidation of aluminum thin films protected by ultrathin MgF2 layers measured using spectroscopic ellipsometry and X-ray photoelectron spectroscopy. OSA Continuum, 4(3): 879-895. https://doi.org/10.1364/OSAC.417302
[18] Grand, J., Auguié, B., Le Ru, E.C. (2019). Combined extinction and absorption UV–visible spectroscopy as a method for revealing shape imperfections of metallic nanoparticles. Analytical Chemistry, 91(22): 14639-14648. https://doi.org/10.1021/acs.analchem.9b03798
[19] Rocha, F.S., Gomes, A.J., Lunardi, C.N., Kaliaguine, S., Patience, G.S. (2018). Experimental methods in chemical engineering: Ultraviolet visible spectroscopy—UV-Vis. The Canadian Journal of Chemical Engineering, 96(12): 2512-2517. https://doi.org/10.1002/cjce.23344
[20] Skoog, D.A., Holler, F.J., Crouch, S.R. (1998). Principles of Instrumental Analysis (Vol. 849). Philadelphia: Saunders College Publishing.
[21] Atkins, P.W., De Paula, J., Keeler, J. (2023). Atkins' Physical Chemistry. Oxford University Press.
[22] Macleod, H.A., Macleod, H.A. (2010). Thin-Film Optical Filters. CRC Press.
[23] Fox, M. (2010). Optical Properties of Solids (Vol. 3). Oxford University Press.
[24] Al-Sharabi, A., Sada’a, K.S., Al-Osta, A., Abd-Shukor, R. (2022). Structure, optical properties and antimicrobial activities of MgO–Bi2− x Cr x O3 nanocomposites prepared via solvent-deficient method. Scientific Reports, 12(1): 10647. https://doi.org/10.1038/s41598-022-14811-9
[25] Chieng, B.W., Ibrahim, N.A., Wan Yunus, W.M.Z., Hussein, M.Z. (2013). Poly (lactic acid)/poly (ethylene glycol) polymer nanocomposites: Effects of graphene nanoplatelets. Polymers, 6(1): 93-104. https://doi.org/10.3390/polym6010093
[26] Pulikkalparambil, H., Varghese, S.A., Siengchin, S., Parameswaranpillai, J. (2019). Thermally mendable and improved hydrophilic bioepoxy/PEG-PPG-PEG blends for coating application. Materials Research Express, 6(2): 025307. https://doi.org/10.1088/2053-1591/aaeccf
[27] Parameswaranpillai, J., Sidhardhan, S.K., Harikrishnan, P., Pionteck, J., et al. (2017). Morphology, thermo-mechanical properties and surface hydrophobicity of nanostructured epoxy thermosets modified with PEO-PPO-PEO triblock copolymer. Polymer Testing, 59: 168-176. https://doi.org/10.1016/j.polymertesting.2017.01.029
[28] Chu, W.C., Lin, W.S., Kuo, S.W. (2016). Flexible epoxy resin formed upon blending with a triblock copolymer through reaction-induced microphase separation. Materials, 9(6): 449. https://doi.org/10.3390/ma9060449
[29] Cano, L., Builes, D.H., Tercjak, A. (2014). Morphological and mechanical study of nanostructured epoxy systems modified with amphiphilic poly (ethylene oxide-b-propylene oxide-b-ethylene oxide) triblock copolymer. Polymer, 55(3): 738-745. https://doi.org/10.1016/j.polymer.2014.01.005
[30] Peponi, L., Puglia, D., Torre, L., Valentini, L., Kenny, J.M. (2014). Processing of nanostructured polymers and advanced polymeric based nanocomposites. Materials Science and Engineering: R: Reports, 85: 1-46. https://doi.org/10.1016/j.mser.2014.08.002
[31] Polyanskiy, M.N. (2024). Refractiveindex.info database of optical constants. Scientific Data, 11(1): 94. https://doi.org/10.1038/s41597-023-02898-2
[32] Schifferle, L., Speziale, S., Lobanov, S.S. (2022). High-pressure evolution of the refractive index of MgO up to 140 GPa. Journal of Applied Physics, 132(12): 125903. https://doi.org/10.1063/5.0106626
[33] Chavali, M.S., Nikolova, M.P. (2019). Metal oxide nanoparticles and their applications in nanotechnology. SN Applied Sciences, 1(6): 607. https://doi.org/10.1007/s42452-019-0592-3
[34] Dai, K., Cao, S., Yuan, J., Wang, Z., et al. (2025). Recent advances of sustainable UV shielding materials: Mechanisms and applications. ACS Applied Materials & Interfaces, 17(21): 30402-30422. https://doi.org/10.1021/acsami.5c04539
[35] Jabbar, G.A.H.A., Saeed, A.A., AL-Kadhemy, M.F.H. (2022). Impact of ZnO nanoparticle on the structural and optical properties of Poly (vinyl alcohol) Film. Al-Mustansiriyah Journal of Science, 33(4): 153-161. https://doi.org/10.23851/mjs.v33i4.1194
[36] Sim, H.T., Gençaslan, M., Merdan, M. (2024). Synthesis of MgO nanoparticles via the sol-gel method for antibacterial applications, investigation of optical properties and comparison with commercial MgO. Discover Applied Sciences, 6(11): 577. https://doi.org/10.1007/s42452-024-06299-x
[37] Demleitner, M., Schönl, F., Angermann, J., Fässler, P., et al. (2022). Influence of block copolymer concentration and resin crosslink density on the properties of UV-curable methacrylate resin systems. Macromolecular Materials and Engineering, 307(10): 2200320. https://doi.org/10.1002/mame.202200320
[38] Schuster, M.B., Abreu, I.K.D., Becker, D., Coelho, L.A. (2021). Effects of adding different concentrations of block copolymers in epoxy matrix nanocomposites with carbon allotropic nanoparticles. Polymer Composites, 42(2): 995-1007. https://doi.org/10.1002/pc.25881
[39] George, S.M., Puglia, D., Kenny, J.M., Jyotishkumar, P., Thomas, S. (2012). Cure kinetics and thermal stability of micro and nanostructured thermosetting blends of epoxy resin and epoxidized styrene-block-butadiene-block-styrene triblock copolymer systems. Polymer Engineering & Science, 52(11): 2336-2347. https://doi.org/10.1002/pen.23183
[40] Schuster, M.B., Opelt, C.V., Becker, D., Coelho, L.A. (2018). Role and sinergy of block copolymer and carbon nanoparticles on toughness in epoxy matrix. Polymer Composites, 39(S4): E2262-E2273. https://doi.org/10.1002/pc.24599
[41] Yang, Z., McElrath, K., Bahr, J., D’Souza, N.A. (2012). Effect of matrix glass transition on reinforcement efficiency of epoxy-matrix composites with single walled carbon nanotubes, multi-walled carbon nanotubes, carbon nanofibers and graphite. Composites Part B: Engineering, 43(4): 2079-2086. https://doi.org/10.1016/j.compositesb.2012.01.049