Hajar Jeniah*![]() | Mohammed Ammari
| Mohammed Ammari![]() | Laïla Ben Allal
| Laïla Ben Allal![]()
© 2025 The authors. This article is published by IIETA and is licensed under the CC BY 4.0 license (http://creativecommons.org/licenses/by/4.0/).
OPEN ACCESS
The purpose of this research study is to produce a geopolymer mortar with a lower environmental impact, to recycle polyethylene terephthalate (PET) plastic waste, and study the possibility of using PET particles as a substitute for sand by replacing and using calcined industrial sludge as a precursor in mortar production. A study of the geopolymer mortars revealed a chemical and mineralogical composition and mechanically compatible with that of a control geopolymer mortar, defined as a mortar with no plastic added to the geopolymer paste. The industrial sludge precursors revealed the presence of (Quartz and Muscovite) two crystalline phases. The FTIR spectra of the geopolymer slurries showed the presence of Si-O-T, with this absorption band shifting to lower frequencies when PET particles were added to the slurry. We also analyzed SEM images of some samples. The compressive strength and flexural strength of the mortar showed a decrease with an increase in PET particles as an alternative to sand. Geopolymer mortars formulated with recycled plastic as a sand alternative displayed mechanical performance approaching that of sand-based mortars. These findings collectively suggest the viability of utilizing plastic waste as a raw material for geopolymer mortar production.
calcined industrial sludge, geopolymer mortars, particles PET, compressive strength, flexural strength, thermal conductivity
The production of plastic has experienced remarkable growth, surpassing that of nearly any other material in recent years. Due to its advantageous properties, plastic has seen a significant surge in its applications, encompassing industrial uses medical delivery systems, packaging, and the construction industry [1].
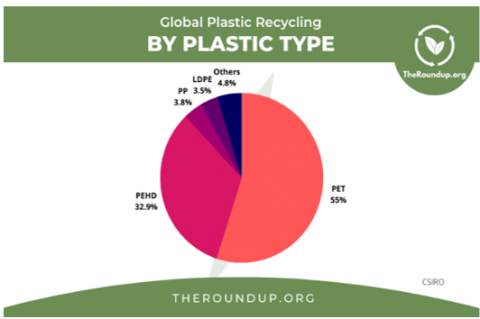
As packaging accounts for nearly 40% of the total weight of plastic waste generated globally, reducing and recycling plastic packaging emerges as a priority in the fight against plastic pollution. While some progress has been recently observed in this direction, there is still a long way to go to stem the flow of these polluting materials into the environment. The primary application of recycled plastics is in packaging, with approximately 41% utilized in non-food packaging and an additional 28% in food contact packaging. The construction and automotive sectors constitute the majority of the remaining usage. PET (Polyethylene Terephthalate) stands out as the most frequently recycled plastic type, representing 55% of global plastic recycling.
The adverse effects of plastic on the environment are widely acknowledged, and its utilization in construction has become a subject of heightened scrutiny. While plastic presents significant environmental challenges, such as pollution and long degradation periods, researchers are exploring innovative ways to incorporate plastic materials into construction practices with reduced environmental impact [2]. Therefore, new solutions have been developed to reduce plastic waste, several studies are exploring the use of plastic waste in construction [3-6] considering factors such as structural integrity, durability, and overall sustainability. By examining the intricate relationship between plastic and construction processes, the research endeavors to provide insights into developing more eco-friendly and resilient building practices [7].
The construction industry and research are undergoing a true technological renewal. A new binder, known as geopolymers [8], with low environmental impact and lower energy costs, has been proposed to partially or fully replace conventional Portland cements.
Geopolymers emerge as a promising alternative to traditional cementitious materials. Coined as geopolymers by Davidovits, they are "gels" of amorphous aluminosilicates, highly dense structures obtained by attacking a mineral containing alumina and possibly silica (such as metakaolin and/or slag) with an alkaline solution of silicate, here are some ways in which plastics can be used in geopolymers. These materials possess high mechanical strength, excellent durability, and lower CO₂ emissions, making them promising substitutes for ordinary Portland cement in sustainable construction. Furthermore, several special advantages are reported in the application of industrial sludge into geopolymer mortars as a building material. First of all, it offers valorization of waste generated by industry and reduces landfill waste disposal along with promoting the circular economy principle. Besides, the geopolymers produced from industrial sludge presented superior mechanical properties: high compressive strength and durability for structural uses. In these mortars, there is a chance of immobilizing the heavy metals, which inhibits the release of hazardous components into the environment. Thus, these geopolymer mortars based on industrial sludge represent a good option compared to cementitious materials, with very high environmental advantages while guaranteeing excellent performance for the material.
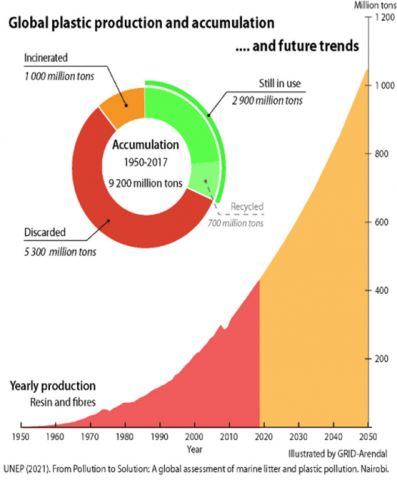
The use of plastic in geopolymer formulations represents an innovative approach in the field of construction materials. Plastics can be incorporated into geopolymers in various ways to enhance certain properties or reduce their environmental impact [9]. Figure 1 shows worldwide plastic production, accumulation, and future trends. Figure 2 shows worldwide plastic recycling by plastic type.
Geopolymer concrete shows significant potential in reducing carbon emissions and energy consumption, making it an attractive option for environmentally sustainable construction practices. The incorporation of recycled plastic into geopolymer concrete offers a dual advantages. Firstly, it presents a practical solution for managing plastic waste by repurposing such materials in a productive manner [10, 11]. Secondly, it creates an opportunity to enhance the qualities and functionality of geopolymer concrete. Further research is necessary to fully explore the capabilities of geopolymer concrete when combined with recycled plastic.
One viable strategy for minimizing environmental impact while maximizing technical and economic benefits lies in incorporating plastic waste as an aggregate in the production of construction materials. This approach stands out among various methods of reuse and recycling [3].
Figure 1. Worldwide plastic production, accumulation, and future trends [12]
Figure 2. Worldwide plastic recycling by plastic type [13]
2.1 Materials
2.1.1 Raw materials
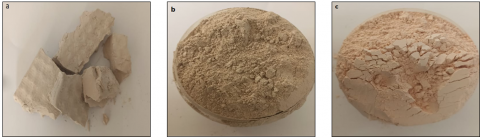
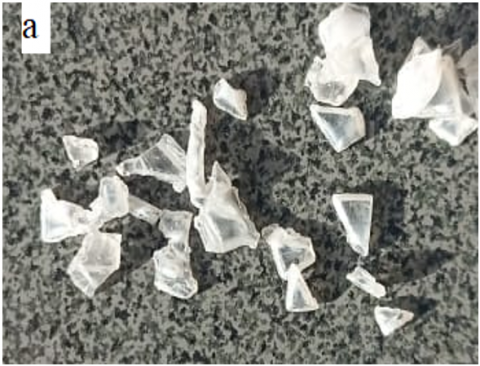
The industrial sludge used in this research originates from the physicochemical treatment process of wastewater produced by a ceramic sanitaryware manufacturing facility shown in Figure 3(a). The manufacturing process results in the generation of substantial amounts of suspended minerals in wastewater.
After decantation, the clarified water is released into the municipal sewage system, whereas the sedimented sludge is transformed into sludge cake using a filter press and is presently discarded in a landfill. Effective industrial wastewater management now requires not only minimizing environmental impact but also exploring ways to reuse the valuable components it contains.
This research therefore provides a promising solution to the challenges associated with waste disposal while creating a new source of raw materials used in the construction industry.
The industrial sludge powder illustrated in Figure 3(a) is produced through the grinding of sludge cakes, as depicted in Figure 3(b). Table 1 shows the chemical composition of the ceramic industrial sludge determined by X-ray fluorescence.
Industrial sludge is processed in several stages before being incorporated into the formulation of geopolymer mortars:
Grinding: The sludge in cake form is mechanically ground to obtain a fine powder show in Figure 3(b). Grinding is carried out for 10 minutes using a ball mill, until a homogeneous particle size is obtained.
Drying: The powder obtained, which has been dried for 24 hours at 40℃ in a ventilated oven, will permit the elimination of residual moisture.
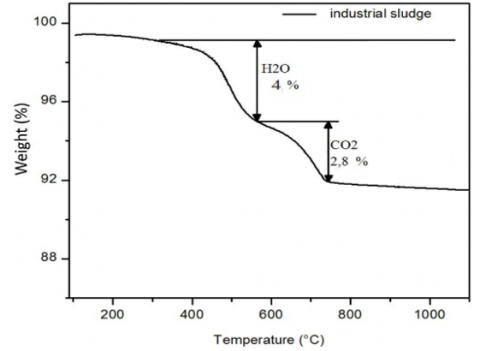
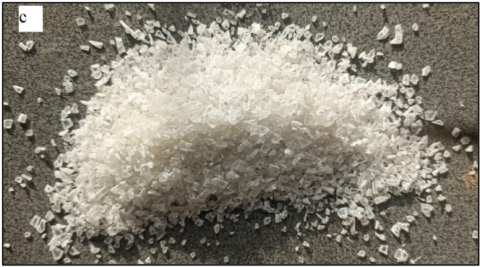
Calcination: After drying, the sludge is heated in a tube furnace in open mode with a ramp of 5℃/min, until a temperature of 800℃ is reached in Figure 3(c). This temperature is maintained for 2 hours, promoting thermal activation and decarbonation of the mineral components present. Figure 4 shows the thermogravimetric analysis (TGA) curves for ceramic industrial sludge, highlighting the different stages of mass loss as a function of temperature, in particular the elimination of residual moisture, the decomposition of organic matter and the decarbonation of mineral phases.
BET specific surface area: using nitrogen adsorption analysis on an ASAP2010 analyser, it was possible to determine a specific surface area for the calcined sludge of 2.37m²/g.
Figure 3. (a) Cake sludge; (b) Grinded cake sludge; (c) Grinded and calcined cake sludge
Table 1. Investigation of the chemical constituents in ceramic waste sludge via X-ray fluorescence
|
Chemical Compound |
SiO2 |
Al2O3 |
CaO |
Na2O |
K2O |
ZrO2 |
MgO |
Fe2O3 |
ZnO |
TiO2 |
MgO |
|
Weight Percent (wt %) |
57.4 |
26.3 |
2.42 |
1.68 |
1.29 |
0.82 |
0.46 |
0.45 |
0.35 |
0.3 |
0.3 |
Figure 4. TGA curves of ceramic industrial
Granulometry: by laser diffraction, the d50 analysis showed a median granulometry of 7.12µm [14, 15].
2.1.2 Sodium silicate solutions
Sodium silicate is prepared by adding sodium hydroxide solution (a solution formed by dissolving NaOH particles (purity 97%) in distilled water) to water glass (62.9% water glass, 26.5% silicon dioxide SiO2, 10.6% sodium oxide Na2O) solution. The resulting sodium silicate solution was stored for 24 hours before use [14, 15].
2.1.3 Sand
The sand used is standardized sand according to the norm CEN EN 196-1.
2.1.4 PET granulates
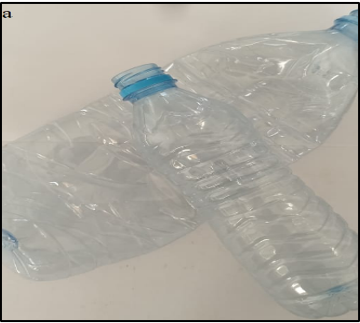
Particles of waste PET battles refer to small fragments or pieces of plastic made from Polyethylene Terephthalate (PET). PET is a commonly used polymer in the production of plastic bottles, containers, and packaging materials. The term "particles" or "granulates" implies that the PET plastic has been broken down into smaller units, which can vary in size depending on the specific context or process involved.
The PET particles used in this study come from mineral water bottles shown in Figure 5(a). After sorting, washing, chopping, and shredding in Figure 5(b), they were reduced to a size between 0.5mm and 1.25mm, as shown in Figure 5(c). The particles are classified by passing them through sieves of specific sizes. The mass retained on each sieve is measured to determine the particle size distribution.
The sand used in this study has a particle size of between 0.08mm and 2.00mm, which corresponds to the standard particle size of sand for construction applications. In comparison, PET particles, with sizes between 0.5mm and 1.25mm, are in a similar range, although their apparent density (0.82-0.87g/cm³) is much lower than that of natural sand (2.6g/cm³). This difference in density affects the workability, porosity and mechanical properties of geopolymer mortar.
Figure 5. (a) The bottles waste; (b) The shredded bottles; (c) Particles PET ground to 1, 25mm
2.2 Mixture
The mortars are prepared in the following stages using a controlab mixer. Firstly, the calcined industrial sludge is deposited in a five-liter tank complying with the specifications of standard NF EN 196-1, then the sodium silicate solution is added by mixing the two components. Sand and PET particles are then added. With varying proportions in Table 2. In the present research work, the alkaline activator was kept in the same proportion for all mixtures, according to the results obtained in our previous study. Optimised dosages of alkaline activators, established by Belmokhtar et al. [16] yielded the best mechanical performance in geopolymer formulations. To ensure that the results were consistent and reproducible, it was necessary to prepare a reference geopolymer mortar (MP0) that used 100% sand as fine aggregate. This mixture served as the control group benchmark against modified mortars that contained PET particles which replaced sand at 5%, 7%, 10%, 12%, and 15% volumetric ratios. The replacement volume was adjusted in increments to evaluate the PET particle incorporation level on the mortar’s physico-mechanical properties.
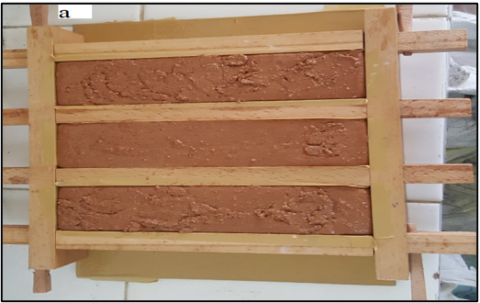
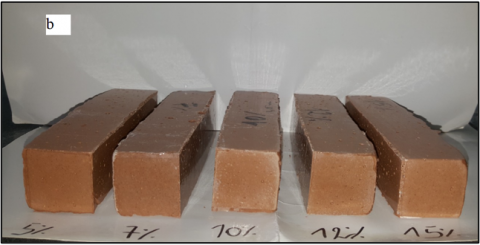
All the blends were prepared in triplicates and accuracy and precision in the results of each blend were maintained through proper mixing using the baking method. Fresh mortar was poured into prismatic molds of 40×40×160mm accommodating two layers as shown in Figure 6(a). Each layer was compacted using 60 blows to reduce the amount of trapped air. After the blocks were kept in the mold for 24 hours, they were taken out and kept in a laboratory at 25±2 degrees centigrade temperature and 50±5% RH until they were tested. To assess the effect of PET on the mixture, the alkali activator concentration. The curing conditions were further set to remove variance resulting from temperature and humidity changes. The mortars obtained after curing are shown in Figure 6(b).
The ratio Na2O(t)/Al2O3 represents the molar ratio of total Na2O to Al2O3 in the raw material powder. Si/Al indicates the molar ratio of silicon (Si) to aluminum (Al) in the same powder. The ratio H2O(t)/ Na2O(t) reflects the molar ratio of total water (H2O) to total Na2O. Lastly, SiO2/ Na2O represents the molar ratio of SiO2 to Na2O in the water glass.
Table 2. The mixed proportions of mortars
|
Proportions |
MP0 |
MP5 |
MP7 |
MP10 |
MP12 |
MP15 |
|
Na2O(t)/Al2O3 |
1 |
1 |
1 |
1 |
1 |
1 |
|
Si/Al |
2.51 |
2.51 |
2.51 |
2.51 |
2.51 |
2.51 |
|
H2O(t)/ Na2O(t) |
14 |
14 |
14 |
14 |
14 |
14 |
|
SiO2/ Na2O |
2.58 |
2.58 |
2.58 |
2.58 |
2.58 |
2.58 |
|
Sand (%) |
100 |
95 |
93 |
90 |
88 |
85 |
|
PET particles (%) |
0 |
5 |
7 |
10 |
12 |
15 |
Figure 6. (a) Molding of the geopolymer mixture; (b) Mortars MP5, MP7, MP10, MP12, MP15
3.1 XRD analysis
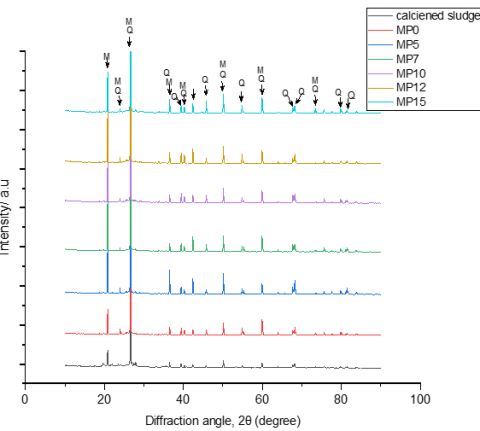
X-ray diffraction analysis was employed to monitor the curing progression of various mortars and to further investigate the impact of introducing PET on the mineralogical structure of the cured pastes. The analyses were conducted on powder samples sieved to 80μm at the 180-day mark. The recognition of the mineralogical phases in the calciened sludge and the geopolymer mortars (MP0, MP5, MP7, MP10, MP12, MP15) Reflection operations were performed using a Bruker D8 Advance diffractometer and a Debye-Scherrer system, equipped with an INEL CPS 120 (curved position sensitive detector). The 40kV, 30mA device is equipped with an X-ray source using copper Kα radiation. The diffraction patterns for the calcined sludge and the MP0, MP5, MP7, MP10, MP12, and MP15 mortars are presented in Figure 7.
We still found the same crystalline phases in all XRD patterns of geopolymer samples, as shown in Figure 7 Crystalline phases are identified as quartz SiO2 (Jcpds:01-078-1252), Muscovite KAl2(Si3Al)O10(OH)2 (Jcpds: 01-074-0345). A semi-quantitative analysis revealed that the Silicon Oxid with a relative intensity of about 84% of the total peaks observed, and Potassium Aluminum Silicate Hydrate contributing approximately 9% to the total peak intensity, which aligns with values reported in the literature [16]. The lack of other diffraction peaks in the geopolymer mortars indicates that quartz and muscovite do not participate in the geopolymerization reaction [17, 18]. This is due to their stable crystalline nature, which will not be affected by the presence of sodium silicate [14, 19].
Moreover, the absence of zeolitic frameworks proves that the geopolymerization reaction took place without the presence of secondary crystalline phases. The mechanical properties of the mortars are due to the formation of amorphous networks, whereas crystalline phases provide additional rigidity to the matrix [20].
The amorphous matrix contributes to the cohesion of the material and its mechanical strength, while the crystalline phases such as quartz and muscovite provide additional rigidity. This calcined clay contains inert phases such as quartz and muscovite.
This also explains why the mechanical properties of geopolymers, such as compressive and tensile strength, depend crucially on the quantity and distribution of the amorphous phase. In addition, the stable crystalline phases of PET, as previously established, indicate that the mineralogical structure of the material will not change; however, what could alter its microstructure would be the variation in porosity or the role it plays as reinforcement.
Figure 7. Overlay of XRD spectra for the calciened sludge and the control mortar MP0, and the other mortars MP5, MP7, MP10, MP12, and MP15. (Q=quartz, M=muscovite)
X-ray diffraction (XRD) revealed that the composition of the geopolymerique materials is qualitatively identical, and no chemical interaction between the mineral species and the PET has led to the formation of new compounds.
3.2 FTIR analysis
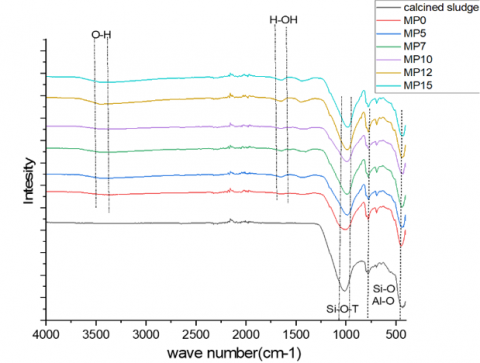
For attributing the bands depicted on the geopolymer spectra, we relied on FTIR studies conducted on metakaolin-based geopolymers [21, 22] present in the calcined industrial sludge [17]. After the alkaline activation of the calciened sludge and adding sand, and plastiques particles, new vibration bands appeared in the FTIR spectra of the geopolymer binders in Figure 8. The broad absorption band between 3300-3600cm-1 and the band between at 1660-1650cm-1 observed in the geopolymer mortars spectra are attributed to the vibration of water (H2O) either absorbed on the surface or trapped within the newly formed material voids/cavities. Regarding Chub-uppakarn et al. [23], H-O-H bonds and -O-H bonds are observed in almost all natural hydrated silicates or hydroxyl groups, representing hydration of geopolymers.
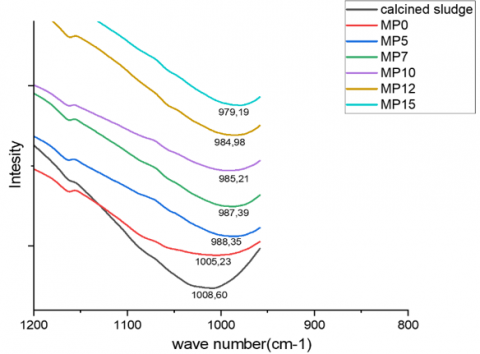
The main band of a geopolymer is identified as Si-O-T (T = Al or Si) at approximately 1000 cm⁻¹ [24–26]. The absorption band at approximately 1008.6 cm⁻¹ (symmetric vibration of Si–O) observed in the FTIR spectrum of calcined sludge and at 1007.73 cm⁻¹ in MP0, as shown in Figure 9, has shifted to lower wavenumbers: around 988.35 cm⁻¹ in MP5, 987.39 cm⁻¹ in MP7, 985.21 cm⁻¹ in MP10, 984.98 cm⁻¹ in MP12, and 979.19 cm⁻¹ in MP15. The total peak shift, Δν, from MP0 to MP15 is 28.54cm⁻¹, which reflects a gradual decrease in the Si-O-T vibration frequency with the increase in PET content. The average shift per replacement level is about 4.76cm⁻¹ per 5% substitution of PET, indicating the systematic alteration of the geopolymeric n network structure.
Figure 8. FTIR spectra of calcined sludge and geopolymer mortars
Figure 9. The deconvolution spectra of Si-O-T vibration bond of calcined sludge and geopolymer mortars
This phenomenon can be explained by the addition of PET plastic particles by substituting sand decreases the quartz content in the geopolymeric mortar composition, leading to an increase in the inorganic, non-mineral material PET. PET does not react with the sodium silicate solution, resulting in a reduction of the Si-O-T band vibration as quartz diminishes. This shift agrees with [27], similar shifts in Si-O-T linkages (~25–30cm⁻¹) were observed in geopolymers with non-reactive fillers such as polymeric waste. However, in the present study, a slightly higher shift was noted for comparable PET additions, in contrast to study [28], which reported a shift of only 20 cm⁻¹. This difference may be attributed to variations in PET particle size, distribution, or interaction with the geopolymeric matrix.
Analogous inorganic hybrid materials were described in researches [17, 27], where the introduction of polymeric fractions caused a decrease in the energy of Si-O-T vibrations and partial destruction of the aluminosilicate framework.
The obtained product can be classified as a primary hybrid material (material with weak phase binding) based on the nature of the interaction between the organic components (such as industrial sludge and sand) and the inorganic components contained in the PET particles. Inorganic hybrid materials proposed by Mir et al. [29].
3.3 Microstructure analysis
The morphology of the geopolymer mortars was observed using scanning electron microscopy (SEM: QUATTRO S-FEG-Thermofisher scientific) with an acceleration voltage of 20kV.
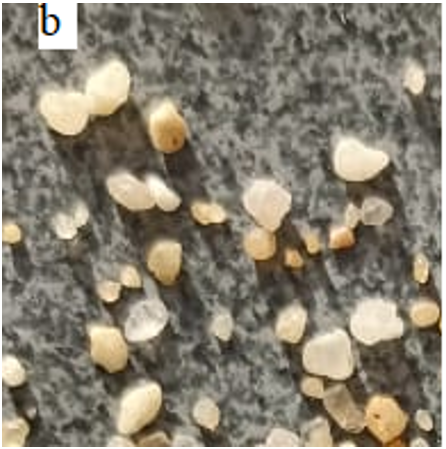
The plastic granulates have irregular shapes and angular ends in Figure 10(a), the rather rounded shape of the sand grains shown in Figure 10(b).
Morphological analyses were conducted using SEM to observe the microstructure of the geopolymer mortars, for employing elemental composition analysis EDS was used. As shown in Figures 11-13 SEM images were taken to analyze the microstructural changes in geopolymer mortars of MP0, MP5, and MP15.
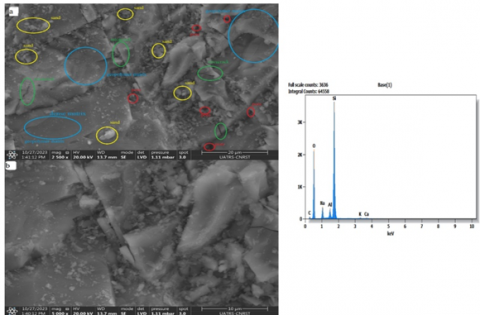
The SEM micrographs of the geopolymer mortar presented in Figure 11 defined by the control, geopolymer mortar without sand substitution, demonstrate good cohesion between sand grains and geopolymer cement, as confirmed by the absence of cracks along the aggregate/geopolymer cement interface, except for micro-cracks. It creates a dense geopolymer matrix.
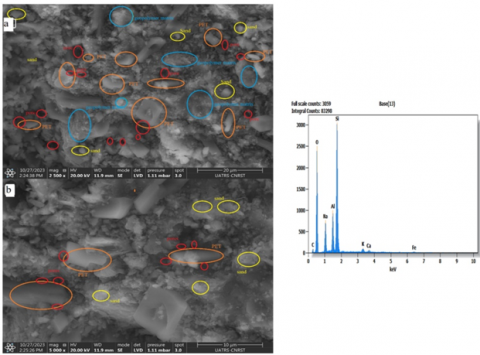
A microstructural study using SEM was executed to analyze the properties of the interface between plastic and mortar. Figure 12 depicts the interface between plastic waste and geopolymer cement in a specimen containing 5% plastic waste (PET) substituted for sand after 28 days of dehydration. In Figure 11, it can be noted that the zone displays a decreased density due to the presence of micro-cracks and a relatively weak bond between the particles of plastic waste and cement geopolymeric [30].
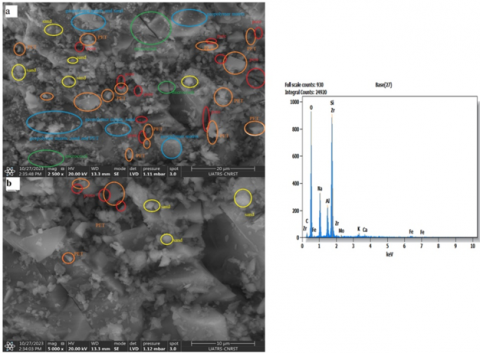
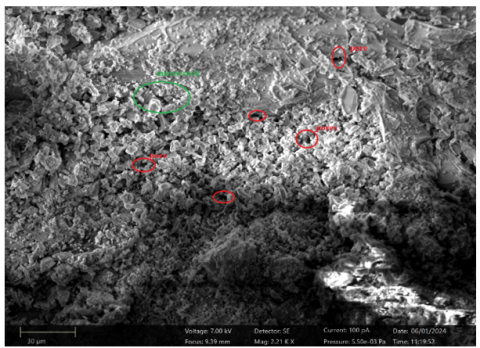
Figure 13 depicts the microscopy of MP 15, clearly illustrating the increase in many small pores around PET particles. This is attributed to the mortar containing 15% PET waste and 85% sand.
The pores in all mortars can be explained by Firstly, Some have larger capillary pores due to the bubbles remaining in the paste during the dissolution and polycondensation reactions [17, 31].
Secondly, plastic particles, with their angular ends and irregular shapes, play an important role in their interaction with geopolymer cement. In contrast, sand grains, which have a more rounded shape, reduce the likelihood of particle incorporation into the mix. The irregularity of the plastic particles promotes better integration, unlike the smoother shape of sand grains.
As particles from one mortar are gradually incorporated into another, pores increase over time. This consequently reveals the loss of adhesion between PET aggregates and the paste, which diminishes the surface area of the geopolymer matrix and results in a denser matrix (Figure 12 and Figure 13). By adding the hydrophobic nature, this limit water movement, thereby inhibiting hydration.
The results obtained demonstrate that the geopolimerization band Si-O-T has shifted to a lower wavelength, this shift is attributed to the reduction in the geopolymer matrix resulting from the addition of plastic waste. The EDX analysis in all SEM mortars indicates the presence of various elements. The presence of aluminum (Al), silicon (Si), and oxygen (O) is associated with the composition of the raw material and the geopolymer phase.
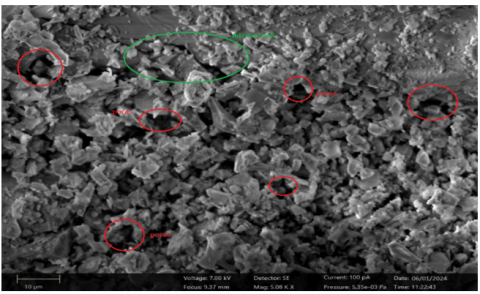
SEM micrographs at 180 days show further microstructural evolution in the geopolymer mortars. The MP0 sample still retains its compact and dense matrix with less micro-cracking and satisfactory bonding between the sand grains and geopolymer cement, as shown in Figure 14. This indicates a well-developed geopolymer structure with better long-term stability. Figure 15 shows that the MP5 mortar exhibits moderate porosity and micro-cracking. In contrast, Figure 16 reveals a significant increase in both porosity and micro-cracking in the MP15 mortar, which more severely impacts its mechanical performance. Increased PET content causes further weakening of interfacial bonding between PET particles and geopolymer paste, with greater pore connectivity and declining compressive strength over time.
Prolonged contact with environmental conditions and internal drying processes are the cause of the increased porosity in PET-containing mortars, which enhances the debonding of PET particles from the geopolymer binder. This degradation of the interfacial bond over time agrees with the observed decrease of compressive strength, particularly in MP15, where the greatest increase in porosity was observed.
Figure 10. (a) Irregular shapes of pet particles; (b) Rounded shapes of the sand grains
Figure 11. SEM micrograph and EDX of geopolymer mortar MP0 after 28 days of curing (a) X2500 and (b) X5000
Figure 12. SEM micrograph and EDX of geopolymer mortar MP5 after 28 days of curing (a) X2500 and (b) X5000
Figure 13. SEM micrograph and EDX of geopolymer mortar MP15 after 28 days of curing (a) X2500 and (b) X5000
Figure 14. SEM micrograph of geopolymer mortar MP0 after 180 days of curing
Figure 15. SEM micrograph of geopolymer mortar MP5 after 180 days of curing
Figure 16. SEM micrograph of geopolymer mortar MP15 after 180 days of curing
3.4 Compressive Strength testing, porosity accessible to water, bulk density
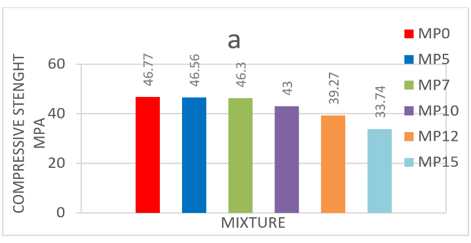
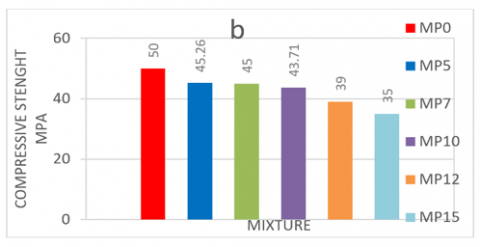
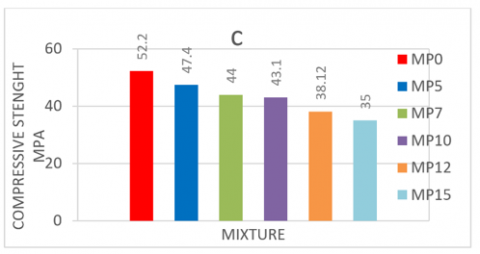
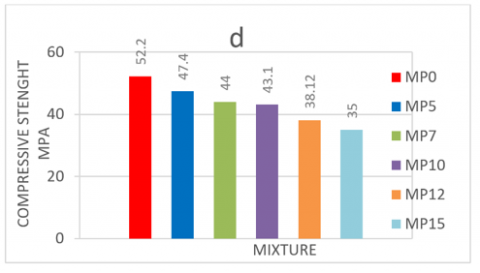
Mechanical strength refers to the mortar's capacity to resist failure when subjected to compressive or flexural tensile stresses. Each reported value for compressive or tensile strength represents the mean result obtained from three individual specimens, compressive and flexural strengths are measured according to the NF EN 196-1 standard. Figure 17 displays the variation in compressive strength relative to the MP0, MP5, MP7, MP10, MP15 content at 7, 28, 90, and 180 days.
Figure 17. Evolution of the compressive strength of the geopolymer mortars: (a) After 7 days of curing; (b) After 28 days of curing; (c) After 90 days of curing; (d) After 180 days of curing
The results displayed in Figure 17 show that the superior compressive strength is that of the control mortar obtained without the substitution of sand by plastic particles after 180 days (53.86MPa). The maximum reduction in compressive strength(~34) was noticed for MP15 composites containing 15% plastic particles.
In addition, it is observed that compressive strength continues to decrease with the increasing substitution of sand by plastic waste. Demonstrating the Impact of the addition of particles on the mechanical properties of the mortars.
Compressive strength decreased with the increase in PET waste content, likely due to the weak bond between the PET aggregate and the geopolymeric matrix, as previously explained in the section on (Microstructure analysis).
The smooth surface texture of the plastic is also associated with its hydrophobic character, as indicated by the FTIR analysis. Additionally, geopolymer mortars without PET (0% substitution) demonstrate superior mechanical strength. This enhancement is primarily linked to the high concentration of alkaline activators and a corresponding increase in the Si/Al ratio.
Porosity accessible to water, is a key parameter in the assessment and prediction of durability. It serves as an indicator of material quality. This parameter is strongly correlated with average compressive strength.
The associated test protocol (NF P 18-459).
Imbibition of the test specimen:
Place the test specimen mortar cube geopolymer (50x50x50mm) in a sealed container, create a vacuum until a constant pressure of 25 mbars is reached. Maintain the vacuum for 4 hours ±15 minutes. Introduce immersion water (cover the test specimen with 20mm of water)
Maintain reduced pressure for 44±1 hours at 20±2℃ Vacuum pump. Determination of the masses of mortars immersed in water, in air, and dried; suspend the mortar from the suspension system of the balance.
Weigh the test specimen fully immersed in water →Mwater.
Weigh the test specimen in air (after carefully wiping it without removing water from the pores) →Mair.
Dry the test specimen at 105℃ until constant mass is achieved. (The test specimen is placed in a desiccator until it reaches room temperature) →Mdry.
Water accessible porosit $=\frac{\text { Mair-Mdry }}{\text { Mair-Mwater }} * 100$ (1)
Bulk density $=\frac{\text { Mdry }}{\text { Mair-Mwater }}$ (2)
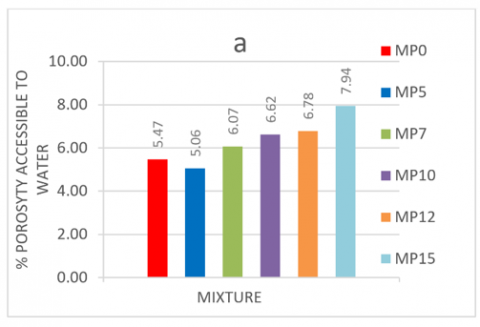
Figure 18(a) shows the test results of porosity accessible to water of geopolymer mortars. The geopolymer-based mortar without PET particles exhibits a water porosity of 5.47%. This value closely resembles those documented in various studies investigating the porosity of standardized mortars [32, 33].
Since porosity is a key parameter that directly affects the physical, chemical and mechanical properties of concrete and mortar, and thus their durability, the differences in compressive strength of these six mortars were studied. For this purpose, water accessible porosity tests were performed after a 28-day curing period. Figure 18(a) shows the results of water accessible porosity tests performed on geopolymer mortars.
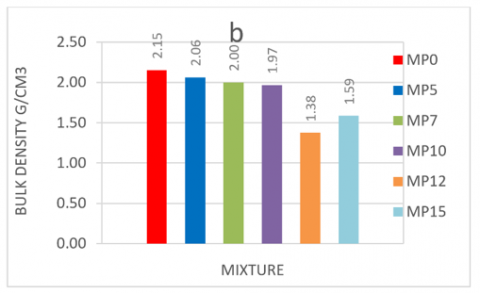
In contrast, the decrease in mechanical properties is generally attributed to an increase in porosity, and, moreover, an increase in PET particle content resulted in a decrease in apparent density and an increase in porosity for all studied mortar samples show in Figure 18(b). The decrease in bulk density can be attributed to the density difference between sand (2.6g/cm3) and PET (0.82-0.87g/cm3). Furthermore, the increase in porosity may be due to the PET aggregate not filling the voids in the geopolymer matrix since its agglomeration surface is larger than that of sand.
Figure 18. (a) Water accessible porosity of geopolymer mortars after 28 days of curing; (b) Bulk density of geopolymer mortars after 28 of curing
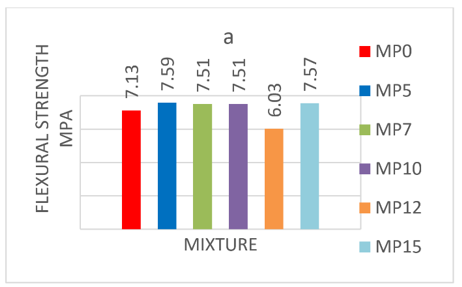
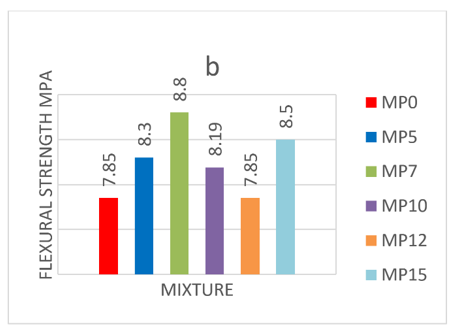
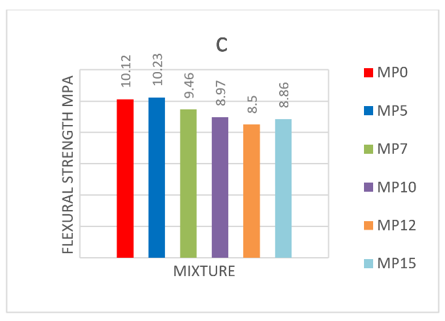
3.5 Flexuare stenght
The flexural strength of the mortars was evaluated through the three-point bending test, using specimens measuring 4×4×16cm. Each reported value represents the average of three measurements taken from three separate samples. The flexural strength results of PET mortars at 7 and 28, 90 and 180 days are depicted in Figure 19.
The results presented in Figure 19 show that the supreme flexural strength is that of the mortar obtained without substitution of sand by plastic particles after 180 days (12.33MPa). The maximum reduction in flexural strength after 180 day of curing (~17, 84) was notated for MP10 composites containing 10% of plastic particles (10.13MPa).
Geopolymer mortars incorporating PET particles exhibit reduced flexural strength compared to those without PET addition. However, when compared to the control mixes, mortars containing finely ground PET particles show similar levels of flexural strength.
Figure 19. Evolution of the flexural strength of geopolymer mortars: (a) After 7 days of curing; (b) After 28 days of curing; (c) After 90 days of curing; (d) After 180 days of curing
This behavior may be attributed to the shape of the particles, which are evenly dispersed within the geopolymer matrix and contribute to the initial phase of failure, facilitates the particles to retain the applied stress before detaching from the matrix through bridging effects [16]. The flexural strength also decreases due to the interpretations provided of the decreasing compressive strength when adding plastic particles to the geopolymeric matrix. The continuous reaction mechanism of calcinate sludge and water glass, along with the reorganization of the geopolymeric gel, is responsible for this behavior, resulting in the gradual increase in flexural even after extended periods of time, such as 180 days [34].
3.6 Thermal properties
One of the primary objectives of this study is to assess the thermal properties of the geopolymer mortar to ascertain its thermal performance for us in a real-construction application. For measuring a material's thermal properties, there are two techniques: the steady-state and the non-steady-state (transient) methods [35]. Transitional measures receive significant attention due to their speed and precision. In this study we use (THB) The transient hot bridge method, an advanced version of the Hot Wire and Hot Strip methods (DIN EN 933-14, DIN EN 993-15), using The Quasi-Steady-State (QSS) method to measure the thermal transport properties of materials.
The fresh pastes obtained in Part 2.2 were cast into prismatic molds (82×42×4mm) all mixtures were cured at room temperature through the thermal conductivity measure in Figure 20. Measurements are taken three times for each sample.
Figure 20. (a) Molding of the geopolymeric mixture for thermal conductivity test (b) Mortars MP0, MP5, MP7, MP10, MP12, and MP15
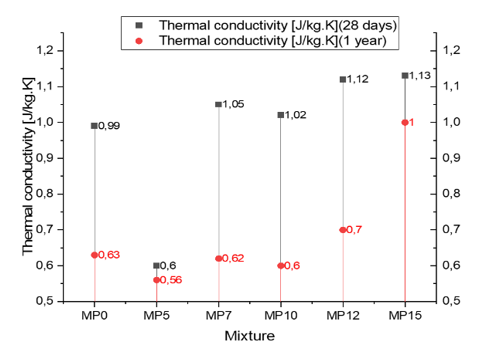
Figure 21. Thermal conductivity of mortars as a function of incorporation PET particles
Figure 21 shows the variation in thermal conductivity of mortars performed after a 28-day and 1 year curing period. These measurements were carried out in the ambient temperature range 20-25℃, The thermal conductivity of the PET particles used is around 0.15 to 0.24W/m. K and for the sand it is between 0.25 and 0.35W/m.K.
As shown in Figure 21, the value of the MP0 control mortar was 0.99W W/m. K after 28 days of drying. This value decreased to 0.63W/m.K after 1 year of drying. The thermal conductivity of the MP5 mortar is lower than that of the control mortar (0.6W/m.K). After 28 days we found a decrease of around 39.4% in thermal conductivity and 0.56W/m.K, after 1 year of drying can be explained by the reduction of voids in the matrix due to the creation of the dense geopolymer matrix. Other studies have explored the thermal characteristics of geopolymer materials with polymeric additives as well. Studies [36, 37] show that the geopolymers’ thermal conductivity is affected by the material’s porosity, as well as, the filler materials’ location and their quantity. The results gave those studies support since including PET particles was shown to increase porosity and lower thermal conductivity. Nevertheless, our research suggest extending that knowledge by including information on the long term thermal performance of PET-modified geopolymers. This focus on PET modified geopolymers is not well covered in the existing literature.
As shown in Figure 21, the thermal conductivity of MP7 MP10 MP12 and MP15 mortars increases in proportion to the progressive incorporation of PET particles into the geopolymer matrix. Ibrahim et al. have indicated that the high concentration of silicon (Si) leads to a filling of the pores in the analyzed matrix [38].
The increase in total porosity in Figure 18 and the coarseness of the pores after the addition of PET particles and its poor cohesion with the geopolymer paste seen in SEM Figure 13, which may explain the deterioration in the thermal conductivity of the total matrix after the addition of PET. The maximum increase in thermal conductivity (~14%) was noticed for MP15 composites containing 15% of plastic particles. This increase is applicable to construction in real-life situations.
In this research, the novel use of polyethylene terephthalate (PET) plastic waste as a sand replacement in industrial sludge-based geopolymer mortars is explored, suggesting an environmentally friendly solution for plastic waste recycling and construction material. The incorporation of PET particles into geopolymer mortars represents a new option for plastic waste recycling with the conservation of natural sand, a non-renewable resource. Additionally, the utilization of calcined industrial sludge as a precursor not only valorizes industrial waste but also helps achieve the circular economy by avoiding landfill disposal. The main findings encompass the stability of crystalline phases (quartz and muscovite) in the geopolymer matrix, as evidenced from XRD analysis, with no formation of new crystalline phases, suggesting negligible chemical interaction between PET and the geopolymer binder. FTIR spectra showed the shift of the Si-O-T vibration band to lower frequencies with PET content, indicating the systematic change in the geopolymer network structure caused by the non-reactive nature of PET. SEM micrographs showed that higher PET content led to higher porosity and lower interfacial bonding between PET particles and the geopolymer matrix, which affected mechanical performance directly. Mechanical performance exhibited progressive reduction in flexural and compressive strength with increased PET substitution, but the control mortar (0% PET) had the greatest strength (53.86 MPa at 180 days). Nonetheless, the mortars with PET substitution up to 10% were adequate for structural purposes. Thermal conductivity reduced with progressive PET content, and hence PET-based geopolymer mortars are applicable to thermally insulating conditions. These results show that PET-based geopolymer mortars are suitable for non-load-bearing applications, for instance, thermal insulation panels or lightweight construction materials, where lower mechanical strength can be tolerated. The research illustrates the feasibility of using industrial sludge and PET waste in sustainable construction, in line with worldwide attempts to minimize plastic pollution and achieve resource efficiency. Additional research is needed on the optimization of PET substitution ratio and investigating surface treatments to achieve maximum interfacial adhesion between PET particles and geopolymer matrix to attain improved mechanical properties for wider applications.
[1] Singh, N., Hui, D., Singh, R., Ahuja, I.P.S., Feo, L., Fraternali, F. (2017). Recycling of plastic solid waste: A state of art review and future applications. Composites Part B: Engineering, 115: 409-422. https://doi.org/10.1016/j.compositesb.2016.09.013
[2] Zadjelovic, V., Wright, R.J., Walker, T.R., Avalos, V., Marín, P.E., Christie-Oleza, J.A., Riquelme, C. (2023). Assessing the impact of chronic and acute plastic pollution from construction activities and other anthropogenic sources: A case study from the coast of Antofagasta, Chile. Marine Pollution Bulletin, 195: 115510. https://doi.org/10.1016/j.marpolbul.2023.115510
[3] Zulkernain, N.H., Gani, P., Chuan, N.C., Uvarajan, T. (2021). Utilisation of plastic waste as aggregate in construction materials: A review. Construction and Building Materials, 296: 123669. https://doi.org/10.1016/j.conbuildmat.2021.123669
[4] Halim, N.F.A., Taib, N., Aziz, Z.A. (2020). The performance of thermal property in concrete containing waste pet (polyethylene terephthalate) as an alternative sustainable building material. IOP Conference Series: Earth and Environmental Science, 452(1): 012108. https://doi.org/10.1088/1755-1315/452/1/012108
[5] Badache, A., Benosman, A.S., Senhadji, Y., Mouli, M. (2018). Thermo-physical and mechanical characteristics of sand-based lightweight composite mortars with recycled high-density polyethylene (HDPE). Construction and Building Materials, 163: 40-52. https://doi.org/10.1016/j.conbuildmat.2017.12.069
[6] Kumar, R. (2021). Tertiary and quaternary recycling of thermoplastics by additive manufacturing approach for thermal sustainability. Materials Today: Proceedings, 37: 2382-2386. https://doi.org/10.1016/j.matpr.2020.08.183
[7] Ahmed, N. (2023). Utilizing plastic waste in the building and construction industry: A pathway towards the circular economy. Construction and Building Materials, 383: 131311. https://doi.org/10.1016/j.conbuildmat.2023.131311
[8] Pouhet, R. (2015). Formulation and durability of metakaolin-Based geopolymers. (Doctoral dissertation, Université Paul Sabatier-Toulouse III).
[9] Wang, Y., Wang, Y., Zhang, M. (2021). Effect of sand content on engineering properties of fly ash-Slag based strain hardening geopolymer composites. Journal of Building Engineering, 34: 101951. https://doi.org/10.1016/j.jobe.2020.101951
[10] Ziada, M., Erdem, S., González-Lezcano, R.A., Tammam, Y., Unkar, I. (2023). Influence of various fibers on the physico-Mechanical properties of a sustainable geopolymer mortar-based on metakaolin and slag. Engineering Science and Technology, An International Journal, 46: 101501. https://doi.org/10.1016/j.jestch.2023.101501
[11] Sood, H., Kumar, R., Jena, P.C., Joshi, S.K. (2023). Eco-friendly approach to construction: Incorporating waste plastic in geopolymer concrete. Materials Today: Proceedings. https://doi.org/10.1016/j.matpr.2023.09.037
[12] GRID-Arendal. (2021). Global plastic production, accumulation and future trends. https://www.grida.no/resources/15041.
[13] Ruiz, A. (2024). 25 plastic waste statistics that will shock you. https://theroundup.org/plastic-waste-statistics/.
[14] Belmokhtar, N., Ammari, M., Brigui, J. (2017). Comparison of the microstructure and the compressive strength of two geopolymers derived from Metakaolin and an industrial sludge. Construction and Building Materials, 146: 621-629. https://doi.org/10.1016/j.conbuildmat.2017.04.127
[15] Kacprzyk, J., Balas, V.E., Ezziyyani, M. (2022). Advanced Intelligent Systems for Sustainable Development (AI2SD’2020) : Volume 1. Springer International Publishing. https://doi.org/10.1007/978-3-030-90633-7
[16] Belmokhtar, N., El Ayadi, H., Ammari, M., Allal, L.B. (2018). Effect of structural and textural properties of a ceramic industrial sludge and kaolin on the hardened geopolymer properties. Applied Clay Science, 162: 1-9. https://doi.org/10.1016/j.clay.2018.05.029
[17] Bergamonti, L., Taurino, R., Cattani, L., Ferretti, D., Bondioli, F. (2018). Lightweight hybrid organic-Inorganic geopolymers obtained using polyurethane waste. Construction and Building Materials, 185: 285-292. https://doi.org/10.1016/j.conbuildmat.2018.07.006
[18] Chen, L., Wang, Z., Wang, Y., Feng, J. (2016). Preparation and properties of alkali activated metakaolin-Based geopolymer. Materials, 9(9): 767. https://doi.org/10.3390/ma9090767
[19] Wang, H., Li, H., Yan, F. (2005). Synthesis and mechanical properties of metakaolinite-Based geopolymer. Colloids and Surfaces A: Physicochemical and Engineering Aspects, 268(1-3): 1-6. https://doi.org/10.1016/j.colsurfa.2005.01.016
[20] Caballero, L.R., Paiva, M.D.D.M., Fairbairn, E.D.M.R., Toledo Filho, R.D. (2019). Thermal, mechanical and microstructural analysis of metakaolin based geopolymers. Materials Research, 22(2): e20180716. https://doi.org/10.1590/1980-5373-MR-2018-0716
[21] Autef, A., Joussein, E., Gasgnier, G., Pronier, S., Sobrados, I., Sanz, J., Rossignol, S. (2013). Role of metakaolin dehydroxylation in geopolymer synthesis. Powder Technology, 250: 33-39. https://doi.org/10.1016/j.powtec.2013.09.022
[22] Kara, I., Tunc, D., Sayin, F., Akar, S.T. (2018). Study on the performance of metakaolin based geopolymer for Mn (II) and Co (II) removal. Applied Clay Science, 161: 184-193. https://doi.org/10.1016/j.clay.2018.04.027
[23] Chub-Uppakarn, T., Chompoorat, T., Thepumong, T., Sae-Long, W., Khamplod, A., Chaiprapat, S. (2023). Influence of partial substitution of metakaolin by palm oil fuel ash and alumina waste ash on compressive strength and microstructure in metakaolin-Based geopolymer mortar. Case Studies in Construction Materials, 19: e02519. https://doi.org/10.1016/j.cscm.2023.e02519
[24] Yunsheng, Z., Wei, S., Zongjin, L. (2010). Composition design and microstructural characterization of calcined kaolin-Based geopolymer cement. Applied Clay Science, 47(3-4): 271-275. https://doi.org/10.1016/j.clay.2009.11.002
[25] Bohra, V.K.J., Nerella, R., Madduru, S.R.C., Rohith, P. (2020). Microstructural characterization of fly ash based geopolymer. Materials Today: Proceedings, 27: 1625-1629. https://doi.org/10.1016/j.matpr.2020.03.338
[26] Salih, M.A., Ali, A.A.A., Farzadnia, N. (2014). Characterization of mechanical and microstructural properties of palm oil fuel ash geopolymer cement paste. Construction and Building Materials, 65: 592-603. https://doi.org/10.1016/j.conbuildmat.2014.05.031
[27] Dal Poggetto, G., D’Angelo, A., Blanco, I., Piccolella, S., Leonelli, C., Catauro, M. (2021). FT-IR study, thermal analysis, and evaluation of the antibacterial activity of a MK-Geopolymer mortar using glass waste as fine aggregate. Polymers, 13(17): 2970. https://doi.org/10.3390/polym13172970
[28] Yusuf, M.O. (2023). Bond characterization in cementitious material binders using Fourier-transform infrared spectroscopy. Applied Sciences, 13(5): 3353. https://doi.org/10.3390/app13053353
[29] Mir, S.H., Nagahara, L.A., Thundat, T., Mokarian-Tabari, P., Furukawa, H., Khosla, A. (2018). Organic-Inorganic hybrid functional materials: An integrated platform for applied technologies. Journal of The Electrochemical Society, 165(8): B3137-B3156. https://doi.org/10.1149/2.0191808jes
[30] Safi, B., Saidi, M., Aboutaleb, D., Maallem, M. (2013). The use of plastic waste as fine aggregate in the self-compacting mortars: Effect on physical and mechanical properties. Construction and Building Materials, 43: 436-442. https://doi.org/10.1016/j.conbuildmat.2013.02.049
[31] Kamseu, E., Nait-Ali, B., Bignozzi, M.C., Leonelli, C., Rossignol, S., Smith, D.S. (2012). Bulk composition and microstructure dependence of effective thermal conductivity of porous inorganic polymer cements. Journal of The European Ceramic Society, 32(8): 1593-1603. https://doi.org/10.1016/j.jeurceramsoc.2011.12.030
[32] El Moustapha, B., Bonnet, S., Khelidj, A., Leklou, N., Froelich, D., Babah, I.A., Charbuillet, C., Khalifa, A. (2022). Compensation of the negative effects of micro-encapsulated phase change materials by incorporating metakaolin in geopolymers based on blast furnace slag. Construction and Building Materials, 314: 125556. https://doi.org/10.1016/j.conbuildmat.2021.125556
[33] Hasnaoui, A., Ghorbel, E., Wardeh, G. (2019). Optimization approach of granulated blast furnace slag and metakaolin based geopolymer mortars. Construction and Building Materials, 198: 10-26. https://doi.org/10.1016/j.conbuildmat.2018.11.251
[34] Mobili, A., Belli, A., Giosuè, C., Telesca, A., Marroccoli, M., Tittarelli, F. (2017). Calcium sulfoaluminate, geopolymeric, and cementitious mortars for structural applications. Environments, 4(3): 64. https://doi.org/10.3390/environments4030064
[35] He, Y. (2005). Rapid thermal conductivity measurement with a hot disk sensor: Part 1. Theoretical Considerations. Thermochimica Acta, 436(1-2): 122-129. https://doi.org/10.1016/j.tca.2005.06.026
[36] Kamath, M., Prashant, S., Kumar, M. (2021). Micro-characterisation of alkali activated paste with fly ash-GGBS-metakaolin binder system with ambient setting characteristics. Construction and Building Materials, 277: 122323. https://doi.org/10.1016/j.conbuildmat.2021.122323
[37] Huseien, G.F., Mirza, J., Ismail, M., Ghoshal, S.K., Ariffin, M.A.M. (2018). Effect of metakaolin replaced granulated blast furnace slag on fresh and early strength properties of geopolymer mortar. Ain Shams Engineering Journal, 9(4): 1557-1566. https://doi.org/10.1016/j.asej.2016.11.011
[38] Ibrahim, M., Johari, M.A.M., Maslehuddin, M., Rahman, M.K. (2018). Influence of nano-SiO2 on the strength and microstructure of natural pozzolan based alkali activated concrete. Construction and Building Materials, 173: 573-585. https://doi.org/10.1016/j.conbuildmat.2018.04.051