Ahlem Sdiri![]() * | Nabil Meddeb
* | Nabil Meddeb![]() | Elhem Ghorbel
| Elhem Ghorbel![]() | Atef Daoud
| Atef Daoud![]()
© 2024 The authors. This article is published by IIETA and is licensed under the CC BY 4.0 license (http://creativecommons.org/licenses/by/4.0/).
OPEN ACCESS
The glass fiber reinforced polymers (GFRP) bars are considered as an alternative to steel reinforcement in certain structures cases due to their non corrosive aspect. Perhaps, they exist with different surface treatment helically wrapped (GFRP-HW) and sand coated (GFRP-S). Thus, each rebar type is performed by a particular bond behavior with the concrete and it affects the concrete crack formations. In the first part of this paper, an experimental and analytical study of the bond behaviour between the (GFRP), rebars and concrete were carried-out. Pull out test tests have been applied on concrete cylindrical slabs in order to identify experimentally the bond behaviour between the self-compacting concrete and GFRP. Various parameters were taken in account in this experimental study: the rebar diameters, the concrete age, and the rebar roughness. Based on the experimental results, the failure mode of the bond specimens, the variation of the bond load, and the bond-slip variation are analyzed. Two failure modes of the GFRP rebars were experimentally identified: the pull-out failure mode and the splitting one. According to the experimental data, it was proven that the GFRP-S rebars and the steel ones exhibit a more bond performant than that of the GFRP-HW rebars. In the second part, an analytical identification of the BPE and the CMR models was established. Subsequently, a tension tie model was extended analytically in order to predict the crack patterns of concrete elements reinforced with the GFRP rebars and steel rebars. The expressions of the cracking parameters issued from the tension tie model have been developed. It can be deduced that the GFRP-HW and GFRP-S reinforced concrete element exhibits a longitudinal strain less than that of the steel reinforcement case. Hence, the GFRP reinforced element undergoes cracks that are characterized by more important width measurements than those of the cracks deduced from the case of the reinforced steel element. Finally, the stress-strain analytical diagram of a GFRP tension member has been plotted and compared to the steel tension element.
concrete, bond, GFRP, crack pattern
Various types of structures, such as bridge decks, pavements, water treatment facilities, seawalls, and maritime structures, are constantly exposed to harsh environmental conditions. One of the major challenges faced by these structures is the corrosion of the steel reinforcement rebars. It is widely recognized that concrete cracking is the primary cause of steel corrosion [1, 2]. As a result, this issue leads to a decrease in concrete strength and the deterioration of the bond between the steel rebar and the concrete [3-7]. Consequently, the service life of these structures is at risk. In order to mitigate the impact of these problems on concrete structures, a new generation of reinforcement bars, known as (FRP) rebar (Fiber Reinforced Polymer), has been utilized in recent decades.
The (FRP) rebar, which serves as an alternative to traditional steel reinforcement, has gained recognition. Among the various types of composite rebars available, the most popular ones are composed of glass (GFRP-HW) (GFRP-S), basalt (BFRP), carbon (CFRP), and aramid (AFRP). GFRP rebars are particularly known for their lightweight nature and resistance to corrosion when compared to steel rebars [8, 9]. Furthermore, it is proven numerically according to Sdiri et al. [8] that the GFRP-HW rebars postpones the early age concrete transversal cracks appearances. Additionally, (FRP) materials are renowned for their ability to withstand chemical exposure. Specifically, (GFRP-HW) and (BFRP) rebars exhibit excellent resistance in both alkaline and saline environments [9, 10]. However, it is essential to thoroughly examine various aspects of this reinforcement technology, particularly the bond behavior within the concrete. (GFRP-HW) and (GFRP-S) rebars possess distinct bonding characteristics compared to steel rebars due to differences in their manufacturing processes [10]. Furthermore, unlike steel rebars, GFRP-HW and GFRP-S rebars are transversally isotropic.
In fact, relying on the pull out or the hinged beam tests, various experimental studies proved that the bond law between (GFRP-HW) and (GFRP-S) rebar and concrete depends on the concrete’s compressive strength, rebar’s diameter, its stiffness and the embedded length used in the experiments [11-21]. According to these studies, it was proven that the rebar with a higher diameter has a lower bond strength. Yan et al. [22] established a comparison between various national and international design codes which deal with the bond laws between (FRP) and concrete. They concluded that the embedded length parameter of the rebar is only considered in the ACI440 [23]. Perhaps, more (GFRP-HW) and (GFRP-S) rebar’s details are taken into account for the Japanese and Canadian codes, such as the rebar surface profile and the type of fiber used in its composite. Furthermore, according to the different experimental studies, the GFRP bond behavior on the concrete depends on temperature [15, 21, 24-26]. It was observed from these experiments that the interface between the GFRP reinforcement and the concrete is largely affected by the temperature increase up to 80℃. Devaraj et al. [27] developed an experimental comparison between the (GFRP-S) concrete bond behaviour and its similar of the GFRP-HW concrete. It was proven that all the GFPR-HW rebars exhibited to a pull out failure mode and this fact was due to a low cover thickness. For the GFRP-S rebars, it was proven that the pattern of the bond behaviour was consistent in the case study of GFRP-S rebars sand-coated GFRP bars where a splitting failure was observed. Doostmohamadi et al. [28] proven experimentally that the stress distribution on the bond behaviour between the GFRP-S rebar and the concrete could be performed by the increase of the number of the end anchors. Several analytical studies were proposed in the literature in order to describe the bond law between FRP rebar and concrete. In his study, Cosenza [11] summarized the different existing analytical models which deal with relation of bond strength-slip laws for the FRP rebars. Among these models, we can cite the Malvar, BPE and CMR models [29]. Sooriyaarachchi et al. [30] elaborated an experimental study that deals with the tension stiffening behavior of the GFRP reinforced concrete elements. The strain patterns occurring between cracks were measured. The authors found that the tension stiffening increases with the increase of the reinforcement ratio and the concrete strength. Besides, Hasan et al. [31] studied experimentally the flexural behavior of reinforced concrete GFRP bars and steel ones. Then, the authors developed an analytical study That leads to predict the concrete crack patterns. It was proven that the GFRP-concrete Bond behavior parameters affect the mechanical characterization of the composite members. This research work proved that GFRP reinforced concrete elements present lower serviceability performance due to their lower modulus of elasticity of FRP bars compared to the steel ones.
Furthermore, an analytical investigations of concrete beams reinforced with GFRP-S and GFRP-HW bars under static loads were developed by Sarhan and Al-Zwainy [32] This analytical work proves that the GFRP concrete bonding and the crack formation depend mainly on the concrete compressive strength and scale of the studied beam. Most of the above-mentioned studies dealt with the effect of the composite rebar’s roughness, (GFRP-HW or GFRP-S) experimentally. However, only few analytical studies focused on the development of analytical models that deal with the cracks pattern in a concrete element reinforced with GFRP-S and GFRP-HW rebars. Furthermore Ver De Veen [33] and Farra [34] elaborated an analytical mode that leads to predict the cracks widths, the transfer length and the concrete stress after the crack formations in a steel reinforced concrete element. It depends mainly on the bond law behaviour between the steel and the concrete.
Subsequently, based on the literature review, it has been clearly seen that the previous studies have mainly focused on experimental and analytical studies of the GFRP-HW, GFRP-S and steel concrete bonding behaviour. Perhaps, just few research works dealt with the development of analytical models that predict the concrete cracks pattern by studying the impact of the GFRP rebar lateral surface: if it is GFRP-HW or GFRP-S.
The remaining of this paper is organized as follows: Section 2 described firstly an experimental study of pull-out tests applied on the GFRP rebars (sand coated and helical wrap GFRP using various diameter for the three types (8mm ,14mm and 16mm)). These experiments were achieved referring to the ACI440 code [23]. Various factors were taken into account such as the concrete’s age (7 days and 28 days), the rebar diameter, its roughness and its embedded length. In addition, the parameters relative to the BPE model and the CMR one were identified from the experimental results of the bond-slip curves. The third section of this article dealt with the study of a tension tie model for a steel reinforced concrete element. This model was then extended in order to simulate analytically the tension tie model reinforced with GFRP rebars. The transfer length for the three reinforcement cases was determined and an analytical comparison between the GFRP rebars and the steel ones was achieved. Furthermore, an analytical model for the GFRP was developed and validated according to the experimental results of Sooriyaarachchi et al. [30]. Section four was devoted to the conclusions drawn from the study.
This paper is a substantial step to cover these challenges by developing an experimental and analytical analysis that deal with the characterization of the cracks formed at a GFRP reinforced concrete elements. Firstly, this paper proposes an experimental study to estimate the bond and crack characterizations of a GFRP-S and (GFRP-HW) reinforced concrete. Secondly, the analytical models established by Ver De Veen [33] and Farra [34] for the steel case study will be applied on a GFRP-HW and GFRP-S reinforced concrete elements. Subsequently, a comparison between the results issued from the two types of reinforcement models could be deduced.
2.1 Materials
2.1.1 Concrete
The concrete tested in all the experiments is self-compacting (SCC) with a strength class of C35/45. The concrete mix characteristics are detailed in Table 1.
The experimental tests to determine the concrete compressive strength at the age of 7 days and 28 days were performed according to the NF EN 12390-3 [35] (standard). The tested specimens are cylindrical in shape and have 11cm×22cm as dimensions. The experimental results are detailed in Table 2, where fckis the characteristic concrete compressive strength, fct is the concrete tensile strength, and Ec is the concrete elastic modulus (Table 3).
Table 1. Mix proportion of the concrete
|
|
Ciment |
Filler |
Water |
Sand 0/4 |
Gravel |
Superplasticizer |
|
Density (kg\m3) |
3140 |
2700 |
1000 |
2570 |
2710 |
1070 |
Table 2. Experimental values of the SCC compressive and tensile strengths s at 7 and 28 days
|
Concrete Age (Days) |
7 Days |
28 Days |
||||||
|
Concrete Specimen |
1 |
2 |
3 |
1 |
2 |
3 |
||
|
fcm (MPa) |
37.1 |
35.12 |
35.16 |
48.71 |
51.3 |
50.1 |
||
|
Mean value |
35.79 |
Mean value |
50.04 |
|||||
|
Standard deviation |
1,13 |
Standard deviation |
1.3 |
|||||
|
fck (MPa) |
3.09 |
3.32 |
3.2 |
3.75 |
4.25 |
5.09 |
||
|
Mean value |
3.2 |
Mean value |
4.36 |
|||||
|
Standard deviation |
0.11 |
Standard deviation |
0.68 |
|||||
Table 3. Experimental value of the SCC elastic modulus at 28 days
|
Concrete Specimen Reference |
1 |
2 |
3 |
|
Ec (GPa) |
33.75 |
34.52 |
34.22 |
|
Mean value |
34.16 |
||
|
Standard deviation |
0.39 |
||
2.1.2 The GFRP rebars
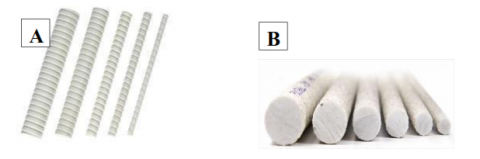
Two types of the GFRP rebars, Figure 1, were used in the experiments: (GFRP-HW) obtained from Schok Combar (A) [36] (Φ=8mm and Φ=16mm) and sand coated (GFRP-S) obtained from VROD (B) [37] (Φ=14mm).
Table 4 illustrates the longitudinal mechanical proprieties of the GFRP rebars. Ft is the GFRP maximum tensile strength and E is the GFRP elastic modulus.
Figure 1. A: GFRP-HW [36], B: GFRP-S [37]
Table 4. GFRP rebars mechanical proprieties
|
|
fy (MPa) |
Ere (GPa) |
|
V-ROD [30] |
>1000 |
60 |
|
COMBAR [31] |
1100 |
60 |
2.2 Parameters
Four parameters were taken into account in the pull out tests experiments (Table 5). These parameters are detailed as follows: the age of the concrete, the rebar’s diameter, the embedded length and the GFRP rebar type. The choice of the embedded length is referred according to the ACI-440 [23].
Table 5. Pull-out experiments parameters
|
Age (days) |
Diameter Φ(mm) |
Embedded Length L (mm) |
Rebar Type |
|
7 days and 28 days |
8, 14 and 16 |
5Φ and 10Φ |
GFRP(HW) and GFRP (S) |
2.3 Test set-up, load procedure and measurement
2.3.1 Moulds preparation
The pull-out test is an experimental process which leads to identify the bond behavior in the interface between a rebar and concrete. Using specific materials, this experimental method allows the application of an ultimate load that allows the extraction of the embedded bar from the concrete. These experiments were performed with respect to the constructions cited in the ACI-440 [23], and CSA S806 [38].
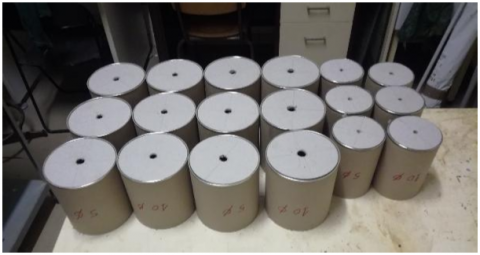
In order to perform the pull-out tests, two cylindrical moulds characterized as follows (Figure 2).:
With: Φc is the diameter of the concrete cylindrical specimen and H is the heigh of the concrete cylindrical specimen.
The minimum required cover thickness for the rebars was chosen as equal to 5 of the rebar diameters according to the CSA S806 [38].
2.3.2 Pouring concrete and slab preparation
The pull-out tests were applied on (GFRP-HW) and (GFRP-S) reinforcement embedded in the concrete cylindrical slabs. A specific framework was used in the way to fix the rebar co-axiality in the concrete (Figure 3).
Figure 2. Cylindrical moulds used in the pull-out experimental tests
Figure 3. Pouring of the concrete slabs
Figure 4. Anchor heads of the GFRP rebars
The embedded rebar was clamped in the top to apply a tension load (F). The rebar reinforcement was subject to a shear and traction force. According to the ACI a metallic the anchorage system was used in this experimental program (Figure 4). Eponal resine was used to fill the gab existing between the GFRP bar and the anchor system.
2.3.3 Pull out test procedure
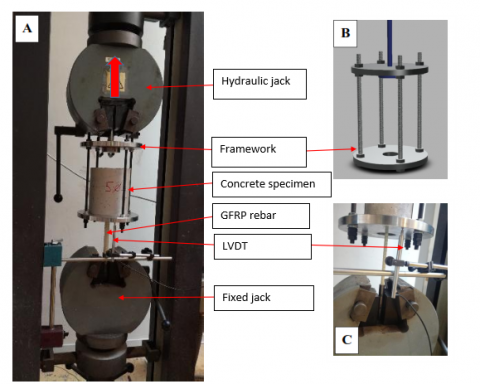
Figure 5. Pull out test set up
During the procedure, the concrete specimen was placed at a metal framework and the load applied on the top of the rebar was ensured by a mobile hydraulic jack performed with a vitess of 1,2mm/min (Figure 5 above). Hence, the slip values between the rebar and the concrete were measured using LVDT captures. These data were saved on the related acquisition chain. The measurements were stopped when the rebar extraction from the concrete was achieved.
The bond strength (τ) was deduced by applying the following formula (Eq. (1)):
τ=FπΦL (1)
where, Φ is the rebar diameter, L is the rebar embedded length.
2.4 Test results and analysis
2.4.1 Pull-out load slip curves
Figure 6 illustrates the load-slip variation for 1Φ16 GFRP and 1Φ14 GFRP-S rebar from a 7 day-day old concrete. The curve is subdivided into two parts detailed as follows:
Figure 6. Experimental Load slip variation for 1Φ16 GFRP-HW and 1Φ14 GFRP-S L=5Φ from a 7-day concrete
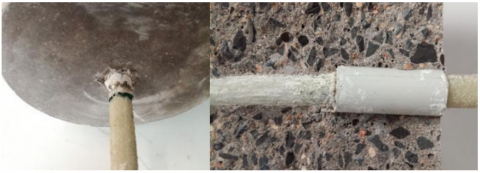
2.4.2 Failure mode
Two different failure modes between the rebar and the concrete were noticed during the pull-out tests process:
Figure 7. Pull out failure for GFRP rebar 14 ΦS
Figure 8. Example of the splitting failure mode
Table 6. Pull-out tests experimental results
|
Φ (mm) |
L (mm) |
TEST Name |
Concrete’s Age (days) |
Mean Fmax (k N) |
Mean of \tau_{\max} (MPa) |
Standard Deviation |
Failure Mode |
|
8 HW |
10 Φ |
EXP1 |
7 |
21.8 |
10.85 |
2.3 |
Pull-out |
|
EXP-2 |
28 |
29.1 |
14.37 |
2.17 |
Pull-out |
||
|
16 HW |
5 Φ |
EXP -3 |
7 |
51.8 |
12.88 |
2.3 |
pull-out |
|
EXP-4 |
28 |
60.5 |
15.05 |
2.17 |
pull-out |
||
|
16 HW |
10 Φ |
EXP -5 |
7 |
84.9 |
10.55 |
2.3 |
splitting |
|
EXP-6 |
28 |
110.65 |
13.76 |
2.17 |
splitting |
||
|
14 S |
5 Φ |
EXP-7 |
7 |
51 |
16.56 |
2.3 |
pull-out |
|
EXP-8 |
28 |
60.42 |
19.63 |
2.17 |
pull-out |
||
|
14 S |
10 Φ |
EXP-9 |
7 |
65 |
10.57 |
2.3 |
splitting |
|
EXP-10 |
28 |
86.6 |
14.07 |
2.17 |
splitting |
The second failure mode is described as a splitting failure mode, it is a break-up of the concrete specimen and the appearance of longitudinal macro cracks (Figure 8). Such failures are mainly due to the significant embedded length of the reinforcement. The results clearly show that the failure mode strongly depends on the GRP reinforcement type (HW or S). In fact, for GRP-HW reinforcement, it can be observed that the concrete is on the outer surface of the reinforcement frame. Therefore, the failure mode in this case is similar to that of steel. For (GFRP-S) rebar, the outer sand surface of the rebar may fall off completely. In addition, damage occurs not only in the concrete, but also on the surface of the reinforcement. Perhaps, the debonding was clearly manifested at the rebar external surface not with the rebar. Subsequently, it can be affirmed that the sand coated characteristics of the GFRP-S present an important factor in the mechanical behavior of the GFRP-concrete bonding. This result is similar to the experimental observation elaborated by Devaraj et al. [27]: The (GFRP-S) bars exhibits splitting failure by the deboning of the external surface of the rebar [27].
Table 6 summarizes the experimental results of the pull-out tests for each rebar type. The maximum bond strength depends on the concrete age. In fact, this strength increases with the increase of the concrete compressive strength (concrete age). Furthermore, it increases with the increase of the embedded length for the case study of GFRP(HW).
2.4.3 Experimental results of maximum bond strength
In this section, the effect of the age of the concrete, the rebar type and the embedded length were investigated. Following the fib model code [39], the maximum bond strength is expressed according to Eq. (2). For the steel case study, δ=2,5 [39].
\tau_{\max }=\delta \sqrt{f_{c k}} [33] (2)
And:
\tau_{\max}=\frac{\mathrm{F}_{\max }}{\pi \Phi L} (3)
Table 7. Pull-out tests experimental results for a 7-day and 28-day old concrete
|
Φ (mm) |
L (mm) |
\tau_{\max} (MPa) (7 Days) |
δ (7 Days) |
\tau_{\max} (MPa) (28 Days) |
δ (28 Days) |
|
8HW |
10Φ |
10.85±2.3 |
1.81 |
14.37±2.17 |
2.03 |
|
14S |
5Φ |
16.56±2.3 |
2.77 |
19.63±2.17 |
2.78 |
|
10Φ |
10.57±2.3 |
1.77 |
14.07±2.17 |
1.99 |
|
|
16HW |
5Φ |
12.88±2.3 |
2.15 |
15.05±2.17 |
2.13 |
|
10Φ |
10.55±2.3 |
1.76 |
13.76±2.17 |
1.95 |
Table 7, summarizes the calculated coefficient \boldsymbol{\delta} deduced from the experimental results of the maximum bond strength and the compressive strength values for a 7-day and 28-day concrete. According to the experimental results, \delta depends on the rebar interface.
The mean values (\boldsymbol{\delta}_{\mathbf{H W}} and \boldsymbol{\delta}_{\mathbf{S}}) of the coefficient \delta are calculated for the two rebar types, GFRP-HW and GFRP-S and were found to be \boldsymbol{\delta}_{\mathbf{H W}}=1.97, \boldsymbol{\delta}_{\mathbf{S}}=2.38 respectively. It might be deduced that this value is independent of the concrete age for any rebar type.
3.1 Parameters identification
3.1.1 Maximum bond strength
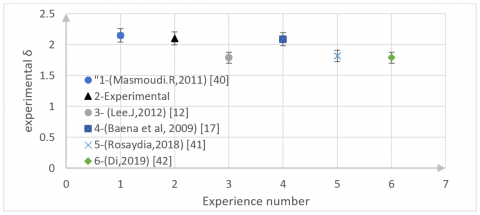
Figure 9 displays a comparison between the experimental results of the coefficient δ and other values from the literature [12, 17, 40-42]. These experimental values issued from the pull-out tests were applied to the GFRP-HW. It can be noted that these experimental values are quite similar to the analytical one (δ=2).
Figure 9. Comparison between our δ experimental values and other values from the literature for GFRP-HW
Figure 10. Comparison between our δ experimental values and the experimental results from the literature for GFRP-S
Table 8. Analytical expressions of the maximum bond strength as function of compressive strength of the concrete for GFRP-HW/GFRP-S and steel
|
GFRP-HW |
GFRP-S |
Steel |
|
\tau_{\max }=2 \sqrt{f_{c m}} |
\tau_{\max }=2.4 \sqrt{f_{c m}} |
\tau_{\max }=2.5 \sqrt{f_{c m}} |
Figure 10 shows the comparison established between our experimental result and other results from the literature obtained from the pull out test experiments applied on GFRP-S [14-17, 21, 43]. I It can be noted that the estimated coefficient \boldsymbol{\delta}_{\mathrm{S}} is practically close to the coefficient value of steel ( δ=2.5).
The analytical expressions related to the maximum bond strength and compressive strength of the concrete for each rebar type are detailed in Table 8.
The bond behaviour of the GFRP-S rebars is analytically close to the steel bond law. Contrary to the maximum bond strength of the GFRP-HW rebars, the \tau_{\max} is lower than that of steel. There is a difference about 20%. Therefore, steel and GFRP-S present a good adhesion with the concrete.
3.1.2 Parameter identification of the BPE and CMR models
The BPE and CMR models describe analytically the first ascending branch of the bond strength-slip variation [11]. They are expressed as follows:
The BPE model:
\frac{\tau}{\tau_{\max }}=\left(\frac{s}{s_{\max }}\right)^\alpha (4)
The CMR model:
\frac{\tau}{\tau_{\max }}=\left(1-\exp \left(-s / s_{\max }\right)\right)^\beta (5)
The parameters of the models BPE (α) and CMR (β) were identified referring to the ascending part of the experimental curves (τ-s). The identification procedure was achieved through the use of an optimization method of the curve fitting. Table 9 summarizes this identification for each rebar type at 7 and 28 days.
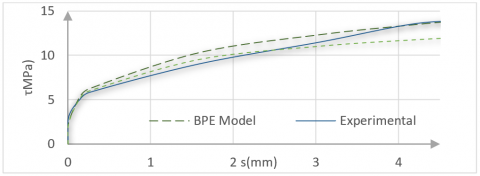
It can be noted that the maximum bond strength depends on the concrete’s age. In fact, the more hardened the concrete, the more the bond strength decreases. The models parameters are independent from the concrete’s age; this might depend on the rebar’s diameter. After determining the corresponding parameters for each model (BPE and CMR), the models were validated through the experimental results of the pull out tests applied on GFRP-HW (Φ=16mm) (Figures 11 and 12) and GFRP-S (Φ=14mm) (Figure 9) at 28 days. These Figures show that the CMR model is closer to the plotted experimental curves for the two reinforcement cases.
Table 9. Parameters identification at 7 and 28 days
|
Φ (mm) |
L (mm) |
\tau_{\max} (MPa) (7 days) |
\tau_{\max} (MPa) (28 Days) |
α (BPE) (7 Days) |
β (CMR) (7 Days) |
α (BPE) (28 Days) |
β (CMR) (28 Days) |
|
Φ=8mm (GFRP-HW) |
10Φ |
10.85 |
14.37 |
0.084 |
0.0724 |
0.080 |
0.046 |
|
Φ=14mm (GFRP-S) |
5Φ |
16.56 |
19.63 |
0.263 |
0.311 |
0.28 |
0.203 |
|
Φ=16mm ((GFRP-HW) |
5Φ |
12.88 |
14.14 |
0.237 |
0.170 |
0.27 |
0.27 |
Figure 11. BPE and CMR model validation through the experimental results of pull out tests on GFRP-HW 16Φ at 28 days
Figure 12. BPE and CMR model validation through the experimental results of pull out tests on GFRP-S 14Φ at 28 days
3.2 First cracking pattern prediction
In this section, the prediction of the cracking pattern was analytically studied in the case of a GFRP-RC element (Figure 13). Several causes can be at the origin of the concrete’s cracks like thermal and autogenous strains, among others. This inevitably leads to the problem of corrosion in the case of steel reinforcement.
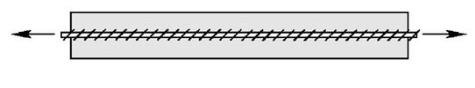
Figure 13. GFRP Reinforced concrete tension-tie member
In a reinforced element, the stresses are transferred from the concrete to the rebar’s reinforcement element via the bond between the rebar and the concrete. The cracks in the concrete appear once the concrete stress reaches the maximum tensile strength of the concrete. At the crack initiation, an immediate redistribution of stresses in the concrete or the rebar occurs and an axial tension force is applied at the cracked section [44, 45]. The distance between two cracks is defined by the transfer length lt. During the development of a new crack and when the tensile strength of the concrete is reached, the transfer length is defined as the distance between two cracks. Therefore, the number of cracks in the concrete element keeps increasing while the reinforced element simultaneously loses stiffness. When the transfer length is insufficient to reach the concrete tensile strength, no new cracks occur in the concrete element. Analytically, the RC tie model reinforced with steel rebar was well investigated by Ver De Veen [33]. Hence, this model was in our case study of a tension tie reinforced with a GFRP rebar. The BPE model, which describes the bond laws between the GFRP/Steel, rebars and the concrete was adopted in this analytical study. Table 10 summarizes the analytical equations used for the tension tie analytical analysis of Ver De Veen [33].
Table 10. The analytical model equations details according to Ver De Veen [33]
|
The BPE Model Equation |
\frac{\tau}{\tau_{\max }}=\left(\frac{\boldsymbol{s}(\boldsymbol{x})}{\boldsymbol{s}_{\max }}\right)^\alpha (Eq. (6)) |
|
First rebar stress relative to the first crack formation \sigma_{r e_1} |
\sigma_{r e_{-} 1}=n_{r e} \sigma_{b c r} (Eq. (7)) |
|
Constitutive rebar crack |
\sigma_{r e_{-} 2}=\left(\frac{1}{\rho}+n_{r e}\right) \sigma_{b c r} (Eq. (8)) |
|
Concrete stress relative to the crack formation |
\sigma_{\mathrm{c cr}}=f_{c t} (Eq. (9)) |
|
Slip expression relative to the crack formation s_{c r} |
\begin{aligned} S_{c r} =\left[\frac{(1+\alpha)}{2} \frac{\Phi}{4} \frac{\sigma_{a r c r}{ }^2}{A E_{a r}\left(1+n_{r e} \rho\right)}\right]^{\frac{1}{1+\alpha}}\end{aligned} (Eq. (10)) |
|
Crack width |
w_{c r}=2 s_{c r} (Eq. (11)) |
|
The transfer length |
l_t=\frac{w_{c r}}{(1-\alpha)} \frac{E_{a r}}{\sigma_{a r~ c r}} (Eq. (12)) |
|
Two constitutive crack spacing |
e_s=2 l_t (Eq. (13)) |
The reinforcement ratio and the young’s modulus is respectively detailed as follows:
\rho=\frac{A_r}{A_c} (14)
n_{r e}=\frac{E_r}{E_c} (15)
A=\frac{\delta \sqrt{f_{c t}}}{s_{\max }{ }^\alpha} (16)
3.2.1 Results and discussion
This subsection dealt with the application of the analytical study tension tie model to three rebar types, namely GFRP-HW, GFRP-S and steel. The tension tie model was assumed as a simple rectangular beam with a 100mm×100mm-transversal section. To cause crack formation, the stress of the concrete should reach its maximum tensile strength fct. In order to define analytically the crack apparition, various effective tensile strengths were taken in account depending from the first crack to the final one. In fact, the concrete structure exhibits random values of tensile strength. According to Farra [34], the first crack is defined by an initial value of the effective tensile strength fct. The rebar stress relative to the first crack formation mainly depends on the rebar roughness and elastic modules, which is referred to in this analytical study by the elastic modulus ratio (nre). In fact, the associated stress \sigma_{\mathrm{r} 2} to the steel rebar reaches a very high value compared to that of the GFRP. According to the results displayed in Table 11 the rebar stress depends on the reinforcement type whether it is GFRP rebar or steel one. For the tension-tie model reinforced with steel rebar, the transfer length is more important than the GFRP associated value.
l_t(G F R P-S)=160 \mathrm{~mm} 1>l_t( steel )=260 \mathrm{~mm}.
Results show that the analytically-estimated cracks width in the steel reinforced element is smaller than those of GFRP rebars. Indeed, in the case of GFRP reinforcement, the crack’s spacing is smaller than that of the Steel reinforced element. In fact, the elastic modulus of GFRP bars is lower than that of steel rebars and this affects the mechanical performance of GFRP-HW-RC elements very different of the steel reinforced elements. A statistical analysis is established by referring to certain experimental data deduced from certain experimental studies that dealt with the prediction of the crack widths in a GFRP-HW reinforced concrete element (Table 12). It can be noted that the calculated values of the crack width with the proposed analytical model have a good agreement with the experimental results [44-46].
Table 11. Analytical results of the tension-tie reinforced with GFRP-HW, GFRP-S and steel rebars
|
|
GFRP HW-Φ=16 |
GFRP-S-Φ=14 |
Steel |
|
α |
0.275 |
0.278 |
0.4 |
|
δ |
2.17 |
2.6 |
2.5 |
|
\tau_{\max} Mpa |
8.6 |
11.77 |
14.14 |
|
s_{\max} (mm) |
2.7 |
3.48 |
1 |
|
\sigma_{re_{-}1} (Mpa) |
4.93 |
4.93 |
17.28 |
|
\sigma_{re_{-}2} (MPa) |
138.14 |
172 |
185 |
|
S_{c r} (mm) |
0.14 |
0.2 |
0.07 |
|
W_{c r} (mm) |
0.28 |
0.41 |
0.14 |
|
l_t (mm) |
167 |
200 |
275 |
|
e_s (mm) |
334 |
400 |
550 |
Table 12. Statistical validation of the analytical model: prediction of the crack widths
|
|
Ec(GPa) |
fc28 (MPa) |
Ere (GPa) |
Reinforcement Ratio \rho |
AC (mm2) |
Experimental Wcr (mm) |
Analytical Wcr (mm) |
|
Model Careza and Russo [44] |
32 |
25 |
44.8 |
0.0079 |
500mm×800mm |
0.52 |
0.42 |
|
Model 2 Shannour et al. [45] |
30 |
25 |
60 |
0.0092 |
120mm×300mm |
1.15 |
1.2 |
|
Model 3 Gouda et al. [46] |
45 |
34 |
60 |
0.0082 |
200mm×400mm |
1.52 |
1.3 |
3.3 Stress-strain relation for GFRP reinforced concrete in tension
3.3.1 Analytical study
The stress-strain relation represents the general behaviour of a tension-tie reinforced concrete element. It includes the effects of cracking appearance on the concrete and the rebar behaviour along the reinforcement. The following analytical analysis has been established by Farra [34] in the way to determine the stress-strain diagram relative to a steel reinforced concrete element. Hence, a direct application of the following formulas is applied analytically on the case study of a GFRP-HW tensile tie element. This allows us to deduce a stress-strain diagram that can be subdivided into three parts [34]:
\sigma_{r e 2}=E_1 \varepsilon_{c 1}=\frac{1+\left(n_{r e}-1\right) \rho}{n_{r e} \rho} E_{r e} \varepsilon_{c 1} (17)
\sigma_{\mathrm{re} 2}=\mathrm{E}_2\left(\varepsilon-\varepsilon_{\mathrm{s} 1 \mathrm{r} 1}\right) (18)
with
E_2=\frac{\sigma_{s r n-} \sigma_{s r 1}}{\varepsilon_{s r n}-\varepsilon_{s 1 r 1}} (19)
where, \sigma_{s r 1} is the rebar stress relative to the appearance of the first crack.
\sigma_{s r 1}=\sigma_{r e_{-} 1} (20)
According to Farra [34], the rebar stress \sigma_{\text {srn}} related to the concrete cracking formation is identified by a coefficient
\delta=\frac{\sigma_{\text {srn }}}{\sigma_{\text {sr1 }}} (21)
\delta depends on the reinforcement ratio
\delta(\rho)=1,13+26,08 \rho (22)
\sigma_{r e 2}=E_3\left(\varepsilon-\varepsilon_{s r n}\right)+\sigma_{s n} (23)
with \boldsymbol{E}_3=\boldsymbol{E}_{r e}
\varepsilon_{c, r 1}: the concrete strain relative to the concrete stress:
\varepsilon_{c, r 1}=\frac{\sigma_{\mathrm{c} 1}}{E_c} (24)
\varepsilon_{s 2, r 1}: the rebar strain relative to the first crack in the concrete:
\varepsilon_{s 2, r 1}=\frac{\sigma_{\mathrm{sr} 1}}{E_{r e}}=\frac{f_t\left(1+\left(n_{r e}-1\right) \rho\right)}{\rho E_{r e}} (25)
\varepsilon_{s 2, r n}: the rebar strain relative to the final crack in the concrete:
\varepsilon_{s 2, r n}=\frac{\delta f_t(1+(n-1) \rho)}{\rho E_{r e}} (26)
The rebar strain relative to the cracking stabilisation is calculated as follows:
\varepsilon_{\mathrm{srn}}=\left(\delta-\frac{\beta_{\mathrm{n}}(1-\rho)}{1+(\mathrm{n}-1) \rho}\right) \varepsilon_{\mathrm{s} 2, \mathrm{rn}} (27)
with \beta_n defines the contribution of the concrete during the crack formation, it depends on the coefficient \alpha which is related to the bonding law. It is expressed as follows:
\beta_n=\frac{\delta(1+\alpha)(3+\alpha)}{8} (28)
As a conclusion, the following parameters should be taken in account in this analytical analysis: \delta, \beta_n, \mathrm{f}_{\mathrm{t}}, \rho, E_{a r}, and \mathrm{n}_{\mathrm{re}}.
3.3.2 Model validation
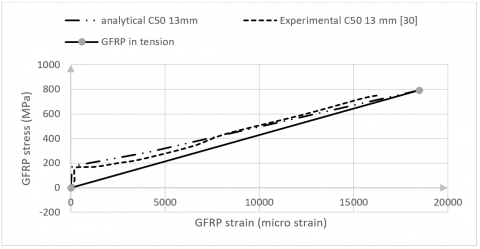
The developed analytical model was validated relying on an experimental study elaborated by Sooriyaarachchi et al. [30]. The main objective of this research work was to determine the GFRP tension members response. Various parameters were taken into account notably the concrete strength (C50), rebar diameter (13mm and 19mm), and reinforcement ratio. The applied concrete specimens were considered as prismatic in shape. Direct tension tests were experimentally investigated in order to determine the strain patterns occurring between the formed cracks on the concrete. This allowed us to draw the diagrams of stress-strain GFRP tension member. Table 13 summarizes the concrete and GFRP mechanical proprieties. Figure 14 shows the analytical and experimental stress-strain curves resulting from a tension-tie GFRP reinforced concrete. The applied concrete is grade 50 and the GFRP rebar ‘diameter is Φ=13mm. The experimental results validate the developed analytical model. Furthermore, both of the analytical and the experimental GFRP tension models exhibit similar curves as the GFRP rebar. The GFRP stress relative to the first crack formation is up to 200MPa.
3.3.3 Analytical model application
This subsection summarized the application of the analytical study of the crack prediction in a tension tie for GFRP RC and steel models. The rebar chosen diameter for the both material types is Φ=16mm. Table 14 shows the calculated parameters for each reinforcement type:
Table 13. Sooriyaarachchi et al. [30] materials proprieties
|
Materials |
GFRP |
Concrete |
|
|
Φ=13mm |
Φ=19mm |
Grade 50 |
|
|
Strength (MPa) |
f_y=792 |
f_y=715 |
f_{ck}=52 |
|
Young’s modulus (GPa) |
42.9 |
41.9 |
36.2 |
|
f_{ct} (MPa) |
- |
2.9 |
|
Table 14. Analytical model parameters for steel and GFRP(HW) rebars
|
|
\boldsymbol{\delta} |
\beta_n |
ft (MPa) |
ρ |
E_{r e}(GPa) |
n_{r e} |
|
Steel |
1.65 |
0.98 |
3.44 |
0.02 |
210 |
5 |
|
GFRP(HW) |
1.65 |
0.86 |
3.44 |
0.02 |
60 |
1.43 |
Figure 14. Model validation against experimental data of Sooriyaarachchi et al. [30]
Figure 15. Stress-strain diagrams for GFRP and steel RC elements
The analytically calculated stresses and strains for each part of the stress-strain relationship are detailed in Table 15.
Table 15. Analytical results of the GFRP and steel tension-tie elements
|
|
GFRP (HW) |
Steel |
|
\varepsilon_{s 1, r 1} |
8.23E-05 |
8.23E-05 |
|
\mathcal{E}_{s 2, r 1} |
0.0028 |
0.00088 |
|
\varepsilon_{s r n} |
0.0035 |
0.00067 |
|
\sigma_{s r 1} (MPa) |
138 |
185 |
|
\sigma_{s n} (MPa) |
227 |
305 |
|
fy (MPa) |
700 |
500 |
The achieved results on the analytical stress-strain diagrams related to the tension tie models reinforced with GFRP and Steel rebars are shown in Figure 15. It can be observed that the GFRP reinforced concrete element exhibits more important strains than those of the steel reinforced concrete element.
Moreover, the GFRP rebars were proven to be characterized by a lower stress relative to the first crack formation compared to the steel rebar.
\sigma_{s r 1}(G F R P)=138 M P a<\sigma_{s r 1}(G F R P)=305 M P a.
In this paper, some experimental and analytical studies were developed in order to evaluate the bond behaviour between different types of GFRP rebars (S and HW) and the concrete. At first, the experimental investigations were conducted using conventional pull-out tests in order to evaluate the bond behaviour between (GFRP-HW), (GFRP-S) and the concrete. Relying on this experimental process, the variation of the bond strength and slip were deduced for each type of the mentioned rebars. Four parameters were taken into account: the rebar diameter (for GFRP-HW (8mm and 16mm), for GFRP-S 14mm), its roughness (GFRP-S or GFRP-HW), its embedded length and the concrete age (7 days and 28 days). The following results were achieved from this experimental part:
In the second part, an analytical study was developed and applied to the case of a (GFRP) reinforced concrete tension tie element taking into account the BPE parameters deduced from the experimental part. It dealt with the characterization of the concrete cracking: the transfer length, the cracks width, the concrete stress, the rebar stress. Furthermore, the stress-strain diagrams of (GFRP-HW) / steel reinforced concrete elements were determined analytically. It described the different stages of the cracks formation: pre cracking step, the cracking development, and the post cracking step. The results of this part can be detailed as follows:
As perspectives:
[1] Shaikh, F.U.A. (2018). Effect of cracking on corrosion of steel in concrete. International Journal of Concrete Structures and Materials, 12: 1-12. https://doi.org/10.1186/s40069-018-0234-y
[2] Pedrosa, F., Andrade, C. (2017). Corrosion induced cracking: Effect of different corrosion rates on crack width evolution. Construction and Building Materials, 133: 525-533. https://doi.org/10.1016/j.conbuildmat.2016.12.030
[3] fib Bulletin No. 40. (2007). FRP Reinforcement in RC Structures. ISBN 978-2-88394-080-2
[4] Bilek, V., Bonczková, S., Hurta, J., Pytlík, D., Mrovec, M. (2017). Bond strength between reinforcing steel and different types of concrete. Procedia Engineering, 190: 243-247. https://doi.org/10.1016/j.proeng.2017.05.333
[5] Pothisiri, T., Panedpojaman, P. (2012). Modeling of bonding between steel rebar and concrete at elevated temperatures. Construction and Building Materials, 27(1): 130-140. https://doi.org/10.1016/j.conbuildmat.2011.08.014
[6] Chen, G., An, R., Xu, J., Fu, S. (2022). Finite element analysis of the reinforcement ratio effect on tension stiffening in FRP reinforced concrete beams. Composite Structures, 298: 116020. https://doi.org/10.1016/j.compstruct.2022.116020
[7] Bakis, C.E., Bank, L.C., Brown, V., Cosenza, E., Davalos, J.F., Lesko, J.J., Machida, A., Rizkalla, S.H., ASCE, F., Triantafillou, T.C. (2002). Fiber-reinforced polymer composites for construction-State-of-the-art review. Journal of Composites for Construction, 6(2): 73-87. https://doi.org/10.1061/(ASCE)1090-0268(2002)6:2(73)
[8] Sdiri, A., Kammoun, S., Daoud, A. (2021). Numerical modeling of the interaction between reinforcement and concrete at early age-A comparison between glass fiber reinforced polymer and steel rebars. Structural Concrete, 22(1): 168-182. https://doi.org/10.1002/suco.201900314
[9] Wu, R., Xu, R., Wang, G. (2023). Modeling and prediction of short/long term mechanical behavior of FRP-strengthened slabs using innovative composite finite elements. Engineering Structures, 281: 115727. https://doi.org/10.1016/j.engstruct.2023.115727
[10] Liang, X., Peng, J., Ren, R. (2023). A state-of-the-art review: Shear performance of the concrete beams reinforced with FRP bars. Construction and Building Materials, 364: 129996. https://doi.org/10.1016/j.conbuildmat.2022.129996
[11] Cosenza, E., Manfredi, G., Realfonzo, R. (1997). Behavior and modeling of bond of FRP rebars to concrete. Journal of Composites for Construction, 1(2): 40-51. https://doi.org/10.1061/(ASCE)1090-0268(1997)1:2(40)
[12] Lee, J.Y., Yi, C.K., Cheong, Y.G., Kim, B.I. (2012). Bond stress-slip behaviour of two common GFRP rebar types with pullout failure. Magazine of Concrete Research, 64(7): 575-591. https://doi.org/10.1680/macr.11.00050
[13] Hollý, I., Bilčík, J., Keseli, O., Gažovičová, N. (2016). Bond of GFRP reinforcement with concrete. Key Engineering Materials, 691: 356-365. https://doi.org/10.4028/www.scientific.net/KEM.691.356
[14] Rosa, I.C., Firmo, J.P., Correia, J.R., Barros, J.A.O. (2019). Bond behaviour of sand coated GFRP bars to concrete at elevated temperature-Definition of bond vs. slip relations. Composites Part B: Engineering, 160: 329-340. https://doi.org/10.1016/j.compositesb.2018.10.020
[15] Serpieri, R., Varricchio, L., Sacco, E., Alfano, G. (2014). Bond-slip analysis via a cohesive-zone model simulating damage, friction and interlocking. Fracture and Structural Integrity, 29: 284-292. http://dx.doi.org/10.3221/IGF-ESIS.29.24
[16] Arias, J.P.M., Vazquez, A., Escobar, M.M. (2012). Use of sand coating to improve bonding between GFRP bars and concrete. Journal of Composite Materials, 46(18): 2271-2278. https://doi.org/10.1177/0021998311431994
[17] Baena, M., Torres, L., Turon, A., Barris, C. (2009). Experimental study of bond behaviour between concrete and FRP bars using a pull-out test. Composites Part B: Engineering, 40(8): 784-797. https://doi.org/10.1016/j.compositesb.2009.07.003
[18] Rezazadeh, M., Carvelli, V., Veljkovic, A. (2017). Modelling bond of GFRP rebar and concrete. Construction and Building Materials, 153: 102-116. https://doi.org/10.1016/j.conbuildmat.2017.07.092
[19] Patil, S.B., Manjunatha, G.S. (2020). Experimental study on bond strength of GFRP bars. Materials Today: Proceedings, 21: 1044-1049. https://doi.org/10.1016/j.matpr.2020.01.003
[20] El-Gamal, S. (2014). Bond strength of glass fiber-reinforced polymer bars in concrete after exposure to elevated temperatures. Journal of Reinforced Plastics and Composites, 33(23): 2151-2163. https://doi.org/10.1177/0731684414555408
[21] Saleh, N., Ashour, A., Lam, D., Sheehan, T. (2019). Experimental investigation of bond behaviour of two common GFRP bar types in high-Strength concrete. Construction and Building Materials, 201: 610-622. https://doi.org/10.1016/j.conbuildmat.2018.12.175
[22] Yan, F., Lin, Z., Yang, M. (2016). Bond mechanism and bond strength of GFRP bars to concrete: A review. Composites Part B: Engineering, 98: 56-69. https://doi.org/10.1016/j.compositesb.2016.04.068
[23] ACI Committee 440. (2004). Guide test methods for fiber-reinforced polymers (FRPs) for reinforcing or strengthening concrete structures. American Concrete Institute, pp. 1-40.
[24] Abbasi, A., Hogg, P.J. (2005). Temperature and environmental effects on glass fibre rebar: Modulus, strength and interfacial bond strength with concrete. Composites Part B: Engineering, 36(5): 394-404. https://doi.org/10.1016/j.compositesb.2005.01.006
[25] Varona, F.B., Baeza, F.J., Bru, D., Ivorra, S. (2018). Evolution of the bond strength between reinforcing steel and fibre reinforced concrete after high temperature exposure. Construction and Building Materials, 176: 359-370. https://doi.org/10.1016/j.conbuildmat.2018.05.065
[26] Masmoudi, R., Masmoudi, A., Ouezdou, M.B., Daoud, A. (2011). Long-term bond performance of GFRP bars in concrete under temperature ranging from 20 C to 80 C. Construction and Building Materials, 25(2): 486-493. https://doi.org/10.1016/j.conbuildmat.2009.12.040
[27] Devaraj, R., Olofinjana, A., Gerber, C. (2023). On the factors that determine the bond behaviour of GFRP bars to concrete: An experimental investigation. Buildings, 13(11): 2896. https://doi.org/10.3390/buildings13112896
[28] Doostmohamadi, A., Shakiba, M., Bazli, M., Ebrahimzadeh, M., Arashpour, M. (2023). Enhancement of bond characteristics between sand-coated GFRP bar and normal weight and light-weight concrete using an innovative anchor. Engineering Structures, 294: 116780. https://doi.org/10.1016/j.engstruct.2023.116780
[29] Ciampi, V., Eligehausen, R., Bertero, V.V., Popov, E.P. (1982). Analytical model for concrete anchorages of reinforcing bars under generalized excitations. Berkeley, CA, USA: College of Engineering, University of California.
[30] Sooriyaarachchi, H., Pilakoutas, K., Byars, E. (2005). Tension stiffening behavior of GFRP-reinforced concrete. Special Publication, 230: 975-990.
[31] Hasan, M.A., Sheehan, T., Ashour, A., Elkezza, O. (2023). Flexural behaviour of geopolymer concrete T-Beams reinforced with GFRP bars. In Structures. Elsevier, 49: 345-364. https://doi.org/10.1016/j.istruc.2023.01.118
[32] Sarhan, M.M., Al-Zwainy, F.M. (2022). Analytical investigations of concrete beams reinforced with FRP bars under static loads. In Structures. Elsevier, 44: 152-158. https://doi.org/10.1016/j.istruc.2022.07.075
[33] Van der Veen, C. (1990). Cryogenic bond stress-slip relationship, PhD Thesis, TU Delft.
[34] Farra, B. Influence de la résistance du béton et de son adhérence avec l'armature sur la fissuration, Ecole polytechnique fédérale de Laussanne. Doctoral Dissertation, Thèse-1995. https://doi.org/10.5075/epfl-thesis-1359
[35] NF EN 12390. (2019). Essais pour béton durci-Partie 3 et partie 6: Résistance à la compression des éprouvettes, Normes nationales et documents normatifs nationaux.
[36] Schok Combar. (2005). Technical Paper. www.schoeck-combar.com.
[37] VROD. (2017). Technical Paper. https://vrodrebar.com.
[38] CSA (Canadian Standards Association). (2012). Design and construction of building structures with fibre-reinforced polymers. CAN/CSA S806-12. Mississauga, Canada, 201.
[39] Bulletin 55 fib. (2010). fib Model Code for Concrete Structures. ISBN: 978-2-88394-095-6. https://doi.org/10.35789/fib.BULL.0055
[40] Masmoudi, A., Masmoudi, R., Ben Ouezdou, M. (2010). Thermal effects on GFRP rebars: Experimental study and analytical analysis. Materials and Structures, 43: 775-788. https://doi.org/10.1617/s11527-009-9547-2
[41] Rosyidah, A., Sucita, I.K., Hidayat, F. (2018). The bond strength of glass fiber reinforced polymer (GFRP) reinforcement with monolith concrete. International Journal on Advanced Science, Engineering and Information Technology, 8(2): 495-500.
[42] Di, B., Wang, J., Li, H., Zheng, J., Zheng, Y., Song, G. (2019). Investigation of bonding behavior of FRP and steel bars in self-compacting concrete structures using acoustic emission method. Sensors, 19(1): 159. https://doi.org/10.3390/s19010159
[43] Liao, W.C., Lin, H.Y., Lee, M.C., Hung, P.H. (2009). The pullout test of a FRP rebar within a nanoclay/concrete block. In Proceedings to Seventeenth International Conference on Composite Materials, A1-7, Edinburgh, Scotland, pp. 1-8.
[44] Creazza, G., Russo, S. (2001). Crack width evaluation in FRP reinforced concrete members. Materials and Structures, 34: 119-125. https://doi.org/10.1007/BF02481561
[45] Shanour, A.S., Mahmoud, A.A., Adam, M.A., Said, M. (2014). Experimental investigation of concrete beams reinforced with GFRP bars. International Journal of Civil Engineering and Technology, 5(11): 154-164.
[46] Gouda, O., Hassanein, A., Galal, K. (2023). Experimental and numerical study on the crack width and deflection performance of GFRP reinforced concrete beams. Engineering Structures, 283: 115721. https://doi.org/10.1016/j.engstruct.2023.115721