Siti Nurmuslimah*![]() | Budanis Dwi Meilani
| Budanis Dwi Meilani![]() | Eka Mala Sari Rochman
| Eka Mala Sari Rochman![]() | Miswanto
| Miswanto![]() | Yuli Panca Asmara
| Yuli Panca Asmara![]() | Aeri Rachmad
| Aeri Rachmad![]()
© 2025 The authors. This article is published by IIETA and is licensed under the CC BY 4.0 license (http://creativecommons.org/licenses/by/4.0/).
OPEN ACCESS
To balance food production and environmental health, sustainable agricultural methods are crucial. Corn (Zea mays L.) is one of the most important food crops widely cultivated in various countries, including Indonesia. As a primary food source and industrial raw material, corn plays a crucial role in the agricultural economy. However, the productivity of corn plants is often hindered by various diseases that attack the stems and leaves, such as Erwinia carotovora, Pythium, Stenocarpella, and Gibberella. These diseases can lead to a decline in crop quality and significant economic losses. Therefore, this study classifies corn stem diseases using a Convolutional Neural Network (CNN) with the 50-layer Residual Network (ResNet-50) architecture. The dataset consists of 750 Red, Green, Blue (RGB) images divided into five categories: healthy corn and four categories of infected corn. The study was conducted both with and without data augmentation, and the classification performance was compared using different color spaces (RGB and Hue, Saturation, Value (HSV)). The results showed that the use of data augmentation significantly improved the model's accuracy. The highest accuracy achieved was 92.76% with augmented RGB images and 90.13% with HSV images.
food production, corn stalk disease, classification, ResNet50, color space
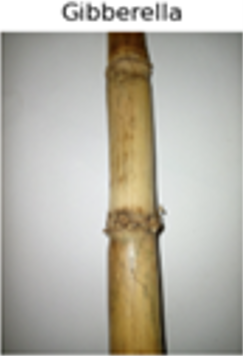
Corn (Zea mays L.) is one of the important food crops widely cultivated in various countries, including Indonesia [1, 2]. As a primary food source and industrial raw material, corn plays a crucial role in the agricultural economy [3]. However, the productivity of corn plants is often hindered by various types of diseases that attack the stems and leaves [4], such as Erwinia carotovora, Pythium, Stenocarpella, and Gibberella.
Reduced crop quality and substantial economic losses can result from these diseases. The diseases affecting corn stems can significantly impact crop yields because the stem plays an essential role in supporting plant growth and nutrient distribution, which sustains the plant structure and serves as the main pathway for transporting water, nutrients, and photosynthesis products from the leaves to other parts of the plant, including the cobs and seeds [5]. When the stem is infected by pathogens, its function as a support and nutrient transporter is disrupted, which can cause various serious problems. For example, Gibberella is one of the pathogens that causes stem rot in corn. This disease usually starts with rot at the base of the stem, which then spreads throughout the stem, making it weak and prone to breaking. Severe infections can lead to reduced yields. Therefore, an effective and efficient system is needed to detect and classify these diseases early, so that proper handling can be carried out immediately [6].
With advancements in digital technology and artificial intelligence, Convolutional Neural Network (CNN) based pattern recognition methods have become widely used for diverse image classification tasks, including applications in agriculture. Network architectures like ResNet50 enable high-accuracy classification through their ability to learn from complex features in plant disease images. This method is expected to provide a solution for detecting corn stem diseases more quickly and accurately compared to conventional methods based on manual visual observation.
CNNs are a type of artificial neural network architecture specifically designed to handle grid-like data, such as images [7]. CNN consists of several convolutional layers that extract essential features from input images. ResNet50, as a variant of CNN, it is recognized for its ability to address the vanishing gradient problem, a common issue in deep networks [8]. Using the concept of skip connections, ResNet50 can perform more stable learning even with many layers, making it very suitable for complex image classification tasks, such as identifying plant diseases.
There have been several previous studies that have shown the effectiveness of CNN-ResNet50 in image classification, such as research on colorectal cancer classification using residual network 50 and 18 architectures [9]. The results obtained showed that the approach using 50-layer Residual Network (ResNet-50) provided better accuracy, reaching 88% with a data split of 80 for training data and 20 for testing data. Moreover, a study in 2023 compared the performance of VGG-16 and ResNet50 models [10]. The results showed that the ResNet50 architecture was superior in classifying complex problems in the study. Based on previous research results, using CNN architecture has proven effective in recognizing complex patterns that cannot be manually detected by humans. ResNet50 was chosen in this study due to its ability to maintain accuracy even in deeper networks.
This study used two approaches to test the effectiveness of the proposed method, namely with and without data augmentation, on two image formats, Red, Green, Blue (RGB), Hue, Saturation, Value (HSV). Using these two-color spaces provides opportunities to leverage the advantages of each. Sometimes, the model can perform better in one color space than another, depending on the characteristics of the disease being detected. By testing and comparing the results from both color spaces, researchers can determine the most optimal approach for classifying corn stem diseases.
As a whole, using data augmentation and exploring various color spaces allows the model to be more flexible and accurate in tackling pattern recognition challenges in corn stem disease images, improving detection performance and facilitating faster treatment in the field. This research is expected to provide clear guidance on the effectiveness and efficiency of the CNN-ResNet50 method in classifying corn stem diseases and contribute to developing plant disease classification systems in the future.
This study focused on developing a corn stem disease classification model using the CNN ResNet-50 architecture. The main goal of this research was to create a model that can accurately identify and classify five types of corn stem conditions: healthy corn, and diseases caused by Erwinia carotovora, Pythium, Stenocarpella, and Gibberella.
Classification is one of the main techniques in data mining. Data mining is the process of extracting useful information or knowledge from large and complex datasets [11]. This technique involves analyzing and discovering hidden patterns in the data, which can be used to make decisions or develop predictive models. Data mining encompasses various techniques, such as classification, clustering, regression, and association, all designed to uncover valuable insights from data [12]. Classification itself is a technique in machine learning aimed at grouping data into predefined categories based on certain features [13]. In this context, classification models learn from labeled training data to recognize patterns or characteristics that distinguish one category from another, enabling them to predict the category of new, unseen data.
2.1 Color space
Color space is a system for representing color in numerical format that allows computers to process and display digital images [14]. Color space defines how colors are represented through combinations of different color channels, facilitating visual analysis and image processing. In the field of image processing, selecting the right color space is crucial because it can affect how well the visual features of an image can be identified and processed by algorithms [15]. Common color spaces include RGB, HSV, YCbCr, and LAB, each with specific advantages and characteristics. In this research, two types of color spaces are used, namely RGB and HSV, to explore the model's effectiveness in detecting corn stem diseases. The selection of these two-color spaces is based on their ability to capture different visual features, with RGB working with basic color intensities, while HSV emphasizes hue, saturation, and brightness which is more similar to human perception.
A. RGB
The RGB color space is one of the most common and widely used color models in digital image processing [16]. In this model, each color is represented as a combination of three primary colors: red (R), green (G), and blue (B) [17]. The value of each color channel typically ranges from 0 to 255 in 8-bit representation, enabling more than 16 million different color combinations. The combination of intensities from these three channels produces various color spectrums visible on monitor screens, televisions, digital cameras, and other visual devices.
The color formation process in RGB color space follows the additive color model principle, where the primary colors (red, green, and blue) are added at various intensities to produce the final color. For example, when all three channels are given maximum values (255, 255, 255), the result is white, while if all values are zero (0, 0, 0), the result is black [18]. Other value combinations will produce different spectrum colors such as purple, brown, yellow, and others.
The advantage of RGB color space lies in its ease of digital image processing, as sensors in cameras and other digital devices also capture images in this format. Additionally, many image processing algorithms, such as edge detection, color segmentation, and pattern recognition, use RGB as standard input due to its simplicity in managing color based on intensity. However, one weakness of RGB is its dependence on lighting conditions, which can affect color recognition performance in different environments [19]. This makes RGB less effective when variations in light intensity or shadows affect the image, leading to other color spaces like HSV being often chosen for such situations.
In this research, the use of RGB color space enables the model to learn from differences in primary color intensities in detecting disease symptoms in corn stems. Images are processed in RGB format, where color changes in disease-infected stems can be recognized by the model based on intensity variations in each color channel.
B. HSV
The HSV color space is designed to more closely match human color perception compared to the RGB color space. HSV separates color information (hue), intensity (value), and clarity (saturation), enabling easier analysis under various lighting conditions [20]. In this color space, each color is represented by three main components: Hue (H), which describes the tone or type of basic color such as red, green, blue, and others; Saturation (S), which indicates how pure or saturated the color is; and Value (V), which represents the brightness level of the color [21].
Calculations in HSV involve transforming RGB values into cylindrical coordinates. Hue is measured in degrees from 0° to 360°, where 0° represents red, 120° green, and 240° blue, with intermediate values producing mixed colors. Saturation ranges from 0% (no saturation, resulting in grayscale) to 100% (full color without white mixing). Value or brightness is also measured in percentages, with 0% being total black and 100% being the brightest color [22].
The main advantage of HSV color space is its ability to isolate color hue from lighting and saturation, allowing color differences to be recognized even when images are taken under varying lighting conditions [23]. This is particularly useful in image processing tasks such as color segmentation, object detection, and image analysis in real-world environments, where light changes can affect image appearance. For example, in plant recognition, HSV allows the model to more easily detect color changes caused by disease without being overly affected by shadows or uneven lighting.
Therefore, in this research, HSV color space is used as an alternative to RGB to test the model's ability to identify corn stem diseases. By separating hue from lighting, HSV enables more stable detection of color changes in infected areas, which might be more difficult to detect in RGB color space. Thus, the model can be more adaptive to lighting variations while remaining accurate in detecting early signs of disease in corn stems.
2.2 Data augmentation
Data augmentation is a method in machine learning and deep learning employed to increase the size and diversity of training datasets by modifying existing data. In the context of image processing, data augmentation generates new images are generated by applying different transformations to the original images, such as cropping, horizontal or vertical flips, scaling, rotation, contrast and brightness adjustments, and noise addition [24]. The main purpose of data augmentation is to introduce new variations into the training data so that the model can learn from more examples without needing to collect large additional datasets.
Augmentation techniques are particularly important when the original dataset size is limited, as deep learning models like CNN tend to require large amounts of data to effectively recognize complex patterns. If the training dataset is too small or lacks variation, the model can experience overfitting, where it learns too specifically from the training data and is unable to generalize to new data. Data augmentation helps address this issue by providing various examples of variations, making the model more accurate and having better generalization capabilities.
Several commonly used data augmentation methods include [25]:
a) Rotation and Flip: Changing image orientation by rotating or flipping to create new variations. This helps the model learn to recognize objects from various angles and orientations.
b) Scaling and Cropping: Modifying image size or cropping certain parts of the image to introduce variations in scale. This technique helps the model learn to recognize objects despite varying sizes.
c) Contrast and Brightness Adjustment: Altering image light intensity or contrast to simulate different lighting conditions. This is useful so that the model doesn't become too dependent on specific lighting conditions when recognizing objects.
In this research, data augmentation is used to expand the variation of the collected corn stem image dataset. The augmentation techniques applied include rotation, flip, and brightness adjustment to ensure the model can recognize patterns from various angles and lighting conditions. Thus, the developed ResNet-50 model will be more robust and accurate in classifying types of corn stem diseases under different conditions. These augmentation techniques not only help improve model accuracy but also reduce the risk of overfitting, resulting in better model performance when applied to new data or real data in the field.
2.3 ResNet-50
ResNet-50 architecture is a CNN model consisting of 50 layers with a residual mechanism. This approach was introduced to address the degradation problem that commonly occurs in very deep networks, where accuracy tends to decrease as the number of layers increases. ResNet50 uses the concept of skip connections in other words also called as shortcut connections that allow signals to bypass one or more layers, it is making easier for the network to learn more complex features without experiencing the vanishing gradient problem [8].
ResNet50 uses residual blocks that allow the network to learn the identity function from previous layers. These blocks consist of two or three layers with direct connections known as skip connections or shortcuts. The main concept of residual blocks is to simplify the network's learning of the differences (residuals) between the input and output, rather than learning the complete transformation function. In general, the ResNet50 architecture consists of the following parts [26]:
a. 1 initial convolutional layer (7 × 7 kernel)
b. 4 main residual blocks, each having a different number of layers
c. Global average pooling layer at the end
d. Fully connected layer as output
The ResNet-50 architecture is shown in the Table 1.
Table 1. ResNet-50 architecture
|
Layers |
Output Size |
ResNet-50 |
|
Con 1 |
112 × 112 |
7 × 7 conv, stride 2 |
|
Con 2_x |
56 × 56 |
3 × 3 max pool, stride 2 |
|
$\left[\begin{array}{ccc}1 & \times & 1.64 \\ 3 & \times & 3.64 \\ 1 & \times & 1.256\end{array}\right] \times 3$ |
||
|
Con 3_x |
28 × 28 |
$\left[\begin{array}{ccc}1 & \times & 1.128 \\ 3 & \times & 3.128 \\ 1 & \times & 1.512\end{array}\right] \times 4$ |
|
Con 4_x |
14 × 14 |
$\left[\begin{array}{ccc}1 & \times & 1.256 \\ 3 & \times & 3.256 \\ 1 & \times & 1.1024\end{array}\right] \times 6$ |
|
Con 5_x |
7 × 7 |
$\left[\begin{array}{ccc}1 & \times & 1.512 \\ 3 & \times & 3.512 \\ 1 & \times & 1.2048\end{array}\right] \times 3$ |
|
|
1 × 1 |
Average pool, 1000-d fc, Softmax |
|
FLOPs |
3.8 × 10⁹ |
|
In this research, the ResNet-50 architecture was used to classify corn stem diseases from RGB and HSV images. This model was chosen due to its proven capabilities in various image classification tasks, including object recognition and plant disease detection. The basic ResNet-50 architecture consists of several residual blocks containing convolution layers, ReLU activation, and batch normalization. These residual blocks are equipped with shortcut paths that connect input directly to output, thus accelerating convergence and improving model performance during training.
2.4 Confusion matrix
In this research, a confusion matrix was used to assess the performance of the ResNet-50 model in classifying corn stem diseases. A confusion matrix is an evaluation tool used to measure the effectiveness of classification models by providing detailed insights about model predictions compared to actual values [27, 28].
This matrix will help identify how well the model recognizes each different category and examine if certain categories are frequently misclassified by the model. Thus, the results from the confusion matrix can be used for further analysis in optimizing the model or identifying specific weaknesses that need improvement, such as adding more training data for less accurate classes or using more appropriate augmentation techniques.
Figure 1. Confusion matrix
Figure 1 illustrates the use of a confusion matrix for evaluating model performance. The matrix includes four key elements: True Positive (TP), False Positive (FP), True Negative (TN), and False Negative (FN), arranged in a matrix format. In multi-class classification, the confusion matrix can be extended to assess the model’s accuracy in classifying each class separately. Below are explanations of these four components.
We can compute a number of model performance evaluation metrics, that include recall, accuracy, precision, and F1-score, using data from the confusion matrix [29]. Here are the equations:
$Accuracy=~\frac{TP+TN}{TP+TN+FP+FN}$ (1)
$Precision=~\frac{TP}{TP+FP}\times ~100%$ (2)
$Recall=~\frac{TN}{TN+FN}\times ~100%$ (3)
$F-measure~=2~\times ~\frac{Recall~\times ~Precision}{Recall+Precision}\times ~100%$ (4)
3.1 Data gathering
Dataset collection is a crucial first step in developing a corn stem disease classification model using ResNet-50. In this research, the dataset consists of corn stem images covering five categories: healthy corn and four types of diseases, namely Erwinia carotovora, Pythium, Stenocarpella, and Gibberella. Each disease category has different visual characteristics, such as color changes, spots, or rotting areas on the stem, which serve as important indicators in classification. Table 2 shows detailed information about the dataset used in this research.
Table 2. Dataset
|
No. |
Class |
Real |
Augmentation |
|
1 |
Healthy |
90 |
220 |
|
2 |
Erwina carotovora |
102 |
220 |
|
3 |
Pythium |
131 |
220 |
|
4 |
Stenocarpella |
210 |
220 |
|
5 |
Gibberella |
217 |
220 |
|
Total |
750 |
1100 |
|
Figure 2. Citra input RGB
Figure 3. Citra input RGB
Each image was taken under varying natural lighting conditions to reflect actual field situations, ensuring the model can recognize disease patterns despite changes in light intensity. Therefore, this research uses datasets with different color spaces, namely RGB as shown in Figure 2 and HSV as shown in Figure 3.
3.2 Analysis
This subsection explains the research process flow, which is divided into three main components: the input process, the classification process, and the output process. The input process involves the collection and preparation of a corn image dataset, including images of healthy corn and those infected with various types of diseases. These images are processed and prepared using augmentation techniques to enhance data variability, and they are transformed into two different color spaces, namely RGB and HSV, to explore the effectiveness of detection across different color representations. As a continuation, in the classification process, the CNN-ResNet50 model is developed and trained using the prepared dataset. Finally, the output process displays the model's classification results, where performance is evaluated using metrics such as accuracy, precision, recall, and F1-score. For clarity, the IPO diagram is shown in Figure 4.
Figure 4. IPO diagram
Referring to the illustration presented in Figure 4, this classification system is constructed with three main components: the input stage, the main stage, and the output stage. Below is an explanation detail of each of the three components in these phases.
The process begins with the collection of corn images in two color spaces: RGB and HSV. The total dataset for each of these consists of 750 records with 5 target classes.
The collected images are then processed to standardize the image quality. This preprocessing step includes resizing the images, normalizing the colors, and enhancing the image quality to meet the model's input requirements.
The collected images are then processed to standardize the image quality. This preprocessing step includes resizing the images, normalizing the colors, and enhancing the image quality to meet the model's input requirements. The processed dataset will be divided into two main parts: 80% for training data and 20% for testing data. This division is made to ensure that the model can learn from the majority of the available data, while the remaining portion is used to test the model's ability to recognize patterns in new, unseen data.
To enhance the variation in the training data and avoid overfitting, augmentation techniques are applied. Augmentation includes modifications to the images such as rotation, flipping, brightness adjustment, and others, which create more variation from the original dataset.
After augmentation, the obtained data is used to train the classification model using the CNN-ResNet50 architecture. This model is capable of recognizing visual patterns and classifying images based on the diseases present on the corn stalks.
The model produces outputs in the form of predicted classes of diseases present on the corn stalks. This output can assist farmers or relevant parties in taking immediate action against the detected diseases. The model’s prediction results are evaluated using metrics like f1-score, recall, accuracy, and precision. This evaluation offers insights into the model’s effectiveness and reliability in detecting corn diseases and highlights areas that require further improvement.
In this study, a CNN model with the ResNet50 architecture was used to classify corn stalk diseases based on images processed in two main scenarios: without augmentation and with data augmentation. The parameters applied in training the model include an input image size of 224 × 224 pixels, a batch size of 8, and a total of 10 epochs. The optimizer used is Adam with a learning rate of 0.001, aimed at accelerating convergence during the training process. The available image data is split with 80% allocated for training and 20% for testing data. In order to make the model better at identifying various disease patterns, data is also added to the training dataset to increase image variability. The classification results using the proposed method are displayed in the Table 3.
Table 3. Result of classification using ResNet-50
|
Testing Scenario |
Accuracy |
Precision |
Recall |
F1-Score |
Running Time |
|
|
RGB |
Without |
80.00% |
80.78% |
80.30% |
80.54% |
2410.38 s |
|
With Augmentation |
97.76% |
91.91% |
92.43% |
92.17% |
5752.3 s |
|
|
HSV |
Without |
86.67% |
83.54% |
87.05% |
85.26% |
2565.45 s |
|
With Augmentation |
90.13% |
87.81% |
87.81% |
87.81% |
5302.75 s |
|
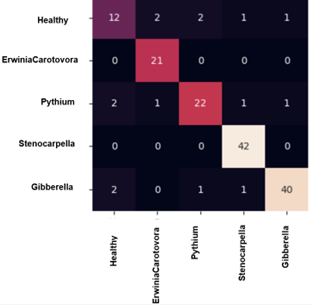
Table 3 shows that the results indicate that data augmentation significantly improves model performance across both RGB and HSV color spaces. In the RGB color space, accuracy improved from 80.00% to 97.76% after augmentation, with corresponding increases in precision, recall, and F1-score. However, this improvement comes at the cost of increased running time, from 2410.38 seconds to 5752.3 seconds seen in Figure 5 and Figure 6.
Figure 5. Confusion matrix for augmentation RGB
Figure 6. Training and validation for augmentation RGB
On the other hand, in the HSV color space, accuracy also increased—from 86.67% to 90.13% with augmentation. The F1-score improved from 85.26% to 87.81%, showing more consistent gains across all metrics compared to the unaugmented version, although with increased computation time as well, from 2565.45 seconds to 5302.75 seconds seen in Figure 7 and Figure 8.
Figure 7. Confusion matrix for augmentation RGB
Figure 8. Training and validation for augmentation RGB
Overall, RGB with augmentation achieved the highest accuracy (97.76%), but HSV without augmentation already outperformed RGB without augmentation. This suggests that HSV may inherently provide better feature separation, while augmentation further enhances performance by providing more diverse training data.
The results of the testing indicate that data augmentation has a significant impact on enhancing the model's performance when utilizing RGB images. In the absence of augmentation, the model achieved an accuracy of 80.00%, with precision at 80.78%, recall at 80.30%, and an F1-score of 80.54%. Following the implementation of data augmentation, the accuracy drastically increased to 92.76%, accompanied by corresponding improvements in precision (91.91%), recall (92.43%), and F1-score (92.17%).
These findings suggest that data augmentation facilitates the model's ability to learn more effectively from the variations in features present within the dataset, thereby enhancing its capability to recognize distinct patterns in images of healthy and diseased corn stalks. However, it is noteworthy that the training duration increased to 5752.3 seconds due to the model processing a larger volume of data during the learning phase.
Additionally, the table shows a comparison of performance between the models trained using images in RGB format and HSV format. In the scenario without augmentation, the model using HSV images demonstrated better performance compared to RGB, with an accuracy of 86.67% compared to 80.00% for RGB. The precision value was 83.54%, recall was 87.05%, and F1-score was 85.26%, all of which were higher for HSV. This suggests that the model is more effective at recognizing disease patterns when using images in the HSV color format. This may be due to the different ways colors are represented in the HSV format, allowing the model to focus more on variations in hue, saturation, and value, which enables better separation between areas infected by pathogens and healthy areas.
However, in the application of augmentation, images in the RGB color space perform better in classifying the dataset compared to those in the HSV space. Therefore, both data augmentation techniques and the selection of appropriate color representations are crucial for improving the performance of deep learning models.
The results of the research indicate that data augmentation significantly enhances classification performance. For RGB images without augmentation, the accuracy reached 80.00%, whereas with augmentation, the accuracy increased to 92.76%. The use of HSV images also demonstrates favorable results, with an accuracy of 86.67% without augmentation and 90.13% with augmentation. The estimation of training time indicates that data augmentation requires more time compared to scenarios without augmentation; however, it produces more accurate and reliable results. The analysis results show that RGB images with augmentation provide the best performance in classifying corn stalk diseases.
We express our gratitude to the University of Trunojoyo Madura for providing guidance for this research endeavor. We express our gratitude to INTI University Malaysia and Institut Teknologi Adhi Tama Surabaya, and University of Airlangga, for their support of this research endeavor.
[1] Rachmad, A., Fuad, M., Rochman, E.M.S. (2023). Convolutional neural network-based classification model of corn leaf disease. Mathematical Modelling of Engineering Problems, 10(2): 530-536. https://doi.org/10.18280/mmep.100220
[2] Viana, C.M., Freire, D., Abrantes, P., Rocha, J., Pereira, P. (2022). Agricultural land systems importance for supporting food security and sustainable development goals: A systematic review. Science of the Total Environment, 806: 150718. https://doi.org/10.1016/j.scitotenv.2021.150718
[3] Grote, U., Fasse, A., Nguyen, T.T., Erenstein, O. (2021). Food security and the dynamics of wheat and maize value chains in Africa and Asia. Frontiers in Sustainable Food Systems, 4: 617009. https://doi.org/10.3389/fsufs.2020.617009
[4] Xue, Z.P., Liu, Q.Y., Emmanuel, P., Qin, J.W., Liu, D.J., Gao, W., Gong, Y.J., Bai, X.W. (2017). Analysis on the effects of pre-heating temperature on mechanical properties of pellets made from corn stalk powder. International Journal of Heat and Technology, 35(2): 421-425. https://doi.org/10.18280/ijht.350227
[5] Sumpala, A.T., Rasyid, R. (2019). Expert system for corn plant disease diagnosis with the breadth-first search method. IOP Conference Series: Earth and Environmental Science, 382: 012001. https://doi.org/10.1088/1755-1315/382/1/012001
[6] Rajeena P.P., F., S.U., A., Moustafa, M.A., Ali, M.A.S. (2023). Detecting plant disease in corn leaf using EfficientNet architecture—An analytical approach. Electronics, 12(8): 1938. https://doi.org/10.3390/electronics12081938
[7] Yamashita, R., Nishio, M., Do, R.K.G., Togashi, K. (2018). Convolutional neural networks: An overview and application in radiology. Insight into Imaging, 9: 611-629. https://doi.org/10.1007/s13244-018-0639-9
[8] Rachmad, A., Sonata, F., Hutagalung, J., Hapsari, D., Fuad, M., Rochman, E.M.S. (2023). An automated system for osteoarthritis severity scoring using residual neural networks. Mathematical Modelling of Engineering Problems, 10(5): 1849-1856. https://doi.org/10.18280/mmep.100538
[9] Sainda, D., Pradisa, R.H., Bustamam, A., Anggia, P. (2021). Deep learning in image classification using residual network (ResNet) variants for detection of colorectal cancer. Procedia Computer Science, 179: 432-431. https://doi.org/10.1016/j.procs.2021.01.025
[10] Tey, H.C., Chong, L.Y., Chong, S.C. (2023). Comparative analysis of VGG-16 and ResNet-50 for occluded ear recognition. International Journal on Informatics Visualization, 7(4): 2247-2257. https://doi.org/10.62527/joiv.7.4.2276
[11] Rajab Asaad, R., Masoud Abdulhakim, R. (2021). The concept of data mining and knowledge extraction techniques. Qubahan Academic Journal, 1(2): 17-20. https://doi.org/10.48161/qaj.v1n2a43
[12] Alasadi, S.A., Bhaya, W.S. (2017). Review of data preprocessing techniques in data mining. Journal of Engineering and Applied Sciences, 12(16): 4102-4107.
[13] Ali, A.R.B., Mahani, A. (2020). Classification problem in imbalanced datasets. Recent Trends in Computational Intelligence, IntechOpen. https://doi.org/10.5772/intechopen.89603
[14] Gowda, S.N., Yuan, C. (2019). ColorNet: Investigating the importance of color spaces for image classification. In Computer Vision – ACCV 2018. ACCV 2018. Lecture Notes in Computer Science, Springer, Cham. https://doi.org/10.1007/978-3-030-20870-7_36
[15] Gateri, J., Rimiru, R., Kimwele, M. (2023). COLORNET: Importance of color spaces in content based image retrieval. International Journal of Computer Science and Network Security, 23(5): 33-41.
[16] Shishmanova, S., Rinaldi, A. (2018). RGB color wheel intended to create color harmony compositions in modern art and design. International Journal of Science and Engineering, 4(4): 45-57. https://doi.org/10.53555/eijse.v4i4.163
[17] Mary, G.G., Rani, M.M.S. (2016). A study on secret image hiding in diverse color spaces. International Journal of Advanced Research in Computer and Communication Engineering, 5(5): 779-783. https://doi.org/10.17148/IJARCCE.2016.55191
[18] EL-Azazy, A.M. (2018). Inspect the potential of using leaf image analysis procedure in estimating nitrogen status in citrus leaves. Middle East Journal of Agriculture Research, 7(3): 1059-1071.
[19] Mamadou, D., Ayikpa, K.J., Ballo, A.B., Kouassi, B.M. (2023). Analysis of the impact of color spaces on skin cancer diagnosis using deep learning techniques. Revue d'Intelligence Artificielle, 37(6): 1377-1385. https://doi.org/10.18280/ria.370601
[20] Chernov, V., Alander, J. Bochko, V. (2015). Integer-based accurate conversion between RGB and HSV color spaces. Computers & Electrical Engineering, 46: 328-337. https://doi.org/10.1016/j.compeleceng.2015.08.005
[21] Kurniaastuti, I., Yuliati, E.N.I., Yudianto, F., Wulan, T.D. (2022). Determination of Hue Saturation Value (HSV) color feature in kidney histology image. Journal of Physics: Conference Series, 2157: 012020. https://doi.org/10.1088/1742-6596/2157/1/012020
[22] Islami, F. (2021). Implementation of HSV-based thresholding method for iris detection. Journal of Computer Networks, Architecture and High Performance Computing, 3(1): 97-104. https://doi.org/10.47709/cnahpc.v3i1.939
[23] Kartika, D.S.Y., Herumurti, D., Yuniarti, A. (2018). Butterfly image classification using color quantization method on HSV color space and local binary pattern. IPTEK Journal of Proceedings Series, (1): 78-82.
[24] Oza, P., Sharma, P., Patel, S., Adedoyin, F., Bruno, A. (2022). Image augmentation techniques for mammogram analysis. Journal of Imaging, 8(5): 141. https://doi.org/10.3390/jimaging8050141
[25] Alomar, K., Aysel, H.I., Cai, X. (2023). Data augmentation in classification and segmentation: A survey and new strategies. Journal of Imaging, 9(2): 46. https://doi.org/10.3390/jimaging9020046
[26] He, K., Zhang, X., Ren, S., Sun, J. (2016). Deep residual learning for image recognition. In 2016 IEEE Conference on Computer Vision and Pattern Recognition (CVPR), Las Vegas, NV, USA, pp. 770-778. https://doi.org/10.1109/CVPR.2016.90
[27] Rachmad, A., Husni, Hutagalung, J., Hapsari, D., Hernawati, S., Syarief, M., Rochman, E.M.S., Asmara, Y.P. (2024). Deep learning optimization of the EfficienNet architecture for classification of tuberculosis bacteria. Mathematical Modelling of Engineering Problems, 11(10): 2664-2670. https://doi.org/10.18280/mmep.111008
[28] Mehdiyev, N., Enke, D., Fettke, P., Loos, P. (2016). Evaluating forecasting methods by considering different accuracy measures. Procedia Computer Science, 95: 264-271. https://doi.org/10.1016/j.procs.2016.09.332
[29] Leow, J.R., Khoh, W.H., Pang, Y.H., Yap, H.Y. (2023). Breast cancer classification with histopathological image based on machine learning. International Journal of Electrical & Computer Engineering, 13(5): 5885-5897. https://doi.org/10.11591/ijece.v13i5.pp5885-5897