Prajakta Ugale*![]() | Poonam Railkar
| Poonam Railkar![]()
© 2025 The authors. This article is published by IIETA and is licensed under the CC BY 4.0 license (http://creativecommons.org/licenses/by/4.0/).
OPEN ACCESS
Remote sensing images are widely utilized in various applications, including mineral detection, vegetation mapping, land mapping, military operations, agricultural applications, and monitoring remote areas. However, the privacy, integrity, identification, and authentication of remote sensing images are crucial due to the complex information they contain, their higher acquisition cost, and the preservation of copyright information. This paper presents a two-way feature representation content-based remote sensing image retrieval (TWFR-CBRSIR) approach that utilizes ResNet-50 and combines texture and shape features to enhance feature distinctiveness. The texture features of the images are obtained using a novel multiscale adaptive local ternary pattern (MALTP) to increase the spatial correlation in the texture features. Furthermore, a block-based discrete wavelet transform based blind watermarking scheme is utilized to embed features into remote sensing images, thereby minimizing feature extraction time during online CBRSIR. The K-Nearest Neighbors classifier is utilized for the CBRSIR on the UC Merced Land Use dataset (UCM), resulting in an improved overall accuracy of 98.57% for the 21-class retrieval of the UCM dataset compared to traditional techniques.
remote sensing images, image retrieval, local ternary pattern (LTP), ResNet50, K-Nearest Neighbors (KNNs)
Content-based image retrieval (CBIR) is the process of retrieving an image from a large dataset based on its visual content, rather than relying on keywords and metadata. CBIR uses spatial information, color, texture, and shape features for image retrieval [1]. It is essential in various medical image retrieval systems, e-commerce applications, digital art archives, satellite and remote sensing, digital libraries, and security and surveillance [2]. CBIR for remote sensing images is very challenging, as Remote sensing generates a considerable volume of aerial, satellite, and drone-captured images daily. Traditional CBIR depends on timestamps, manually annotated descriptions, and location tags. These methods are often inconsistent, time-consuming, unreliable, and subjective, failing to adequately represent the visual content of images [3]. Thus, CBIR is crucial for enabling efficient, automated, and precise retrieval of remote sensing images based on actual visual content, rather than relying on tags and text-based annotations. The necessity of CBIR for remote sensing is due to the higher complexity of remote sensing images. The CBIR is widely utilized in various remote sensing applications, including environmental monitoring and climate change, disaster management, agricultural monitoring, land use and planning, as well as military and security applications [4]. The CBIR for remote sensing is useful for automating image analysis, handling larger-scale datasets, retrieving geospatial data, and supporting multispectral and hyperspectral data [5].
Various automated machine learning (ML) and deep learning (DL) schemes have been proposed for the CBIR to enhance the effectiveness of multimedia content retrieval [6-10]. Yuan et al. [11] proposed a Cross-modal Remote Sensing Text-Image Retrieval approach utilizing GaLR for image-text retrieval, assessed on the Remote Sensing Image Captioning Dataset (RSICD) and Remote Sensing Image–Text Matching Dataset (RSITMD) datasets. This approach enhances retrieval accuracy to 31.41% in RSITMD by dynamically integrating global and local features, thus improving retrieval precision. Nonetheless, excessive redundancy in local features may occasionally result in diminished performance. Cheng et al. [12] proposed a deep semantic alignment network (DSAN) for cross-modal retrieval, which was tested on multiple captioned datasets, including UC Merced Land Use-Captions and NWPU- RESISC45-Captions. By enhancing cross-modal retrieval through semantic alignment, it achieves more than 90% classification accuracy on the UCM dataset. Despite its high performance, it struggles with lower accuracy in visually similar categories, which may limit its effectiveness. Zhang et al. [13] developed a triplet non-local neural network with dual-anchor triplet loss and applied it to UCM dataset, the aerial image dataset, and the PatternNet dataset. This approach significantly improves retrieval performance, particularly on the UCM dataset, by leveraging better discriminative learning. However, its accuracy is limited when dealing with images that have simple backgrounds, which may reduce its applicability in specific scenarios.
Sumbul et al. [14] proposed a deep metric learning approach using triplet selection for multilabel CBIR, tested on IRS-BigEarthNet and UC Merced datasets. Efficient triplet selection enhances multilabel image retrieval while reducing training complexity. However, selecting optimal triplets remains a challenge, especially for large-scale datasets. Mi et al. [15] introduced a knowledge-aware cross-modal retrieval (KCR) framework utilizing external knowledge graphs for retrieval, evaluated on two standard remote sensing benchmarks. The method outperforms state-of-the-art retrieval techniques by mitigating the semantic gap through the use of knowledge graphs. Nevertheless, its reliance on external knowledge graphs may introduce bias, which can affect the consistency of retrieval results. Al Rahhal et al. [16] presented a multilingual Transformer-based retrieval method for text-to-image matching, which was tested on the RSITMD, RSICD, and UCM datasets. This model improves retrieval performance by 11% compared to previous approaches, supporting multilingual queries and thereby increasing its versatility. However, its performance varies depending on dataset size and language complexity, which could impact its usability across different applications.
Song et al. [17] proposed an asymmetric hash code learning (AHCL) technique for remote sensing image retrieval, which was applied to three publicly available datasets. It achieves the highest mean average precision (MAP) across multiple datasets, reducing computational costs through efficient hashing while maintaining retrieval accuracy. However, optimal performance requires precise tuning of hash functions, a process that can be resource-intensive. Zhang et al. [18] presented deep multi-similarity hashing (DMsH) for remote sensing image (RSI) retrieval by combining spatial information and hashing information to mitigate noise. It provided a mean average precision of 0.97 for the UCM dataset. Maurya et al. [19] suggested an adaptive DL-based model for the RSI retrieval to minimize the limitations of poor retrieval, lack of flexibility, and lower efficiency. They analyzed the effectiveness of various transfer learning models on the UCM dataset for image retrieval. It achieved a superior accuracy of 95.07% for VGG19, compared to 93% for VGG16 and 91% for ResNet, in a 21-class classification task. However, the higher number of trainable parameters in the VGG19, VGG16, and ResNet models leads to an increase in the computational complexity of the system. It limits its deployment on systems with limited resources.
In recent years, Chembian et al. [20] proposed the k-means pelican optimized algorithm (KMPOA) for the CBRSIR, aiming to reduce the search space and enhance the retrieval of RSIs. It used the RSIs’ grey-level cooccurrence matrix (GLCM), color moments, LBP, and ResNet-18 features. Neighborhood component analysis (NCA) is used to select the most salient features. The KMPOA achieved a 96.29% accuracy for the ARIAL image dataset using CBRSIR. Hou et al. [21] explored an efficient and secure CBRSIR based on CNN. It used feature dimension reduction using mapping-based spectral hashing with spectral rotation (SHSR) and clustering to enhance retrieval accuracy. Further, the asymmetric scalar product-preserving encryption scheme is utilized to protect the image during retrieval. It provided better authenticity, security, and retrieval rate. However, the system’s effectiveness is challenging because of the CNN’s intricate structure and parameter optimization. Sudha and Aji [22] proposed an optimized label propagation network (OLPNet) for hierarchical CBRSIR. The system utilized a support vector machine and a relevance vector machine to boost the label distribution of the RSIs’ high-dimensional and complex features. The complexity in the framework results in higher time complexity, which limits the system's real-time deployment. Yang et al. [23] and Zhang et al. [24] proposed remote sensing text image retrieval based on descriptive text. Retrieving the RSIs based on the text inputs is challenging, as there can be a disparity between the metadata and the actual RSI content. Therefore, it is necessary to focus on the actual image content depicted using color, textural properties, and shape attributes [25, 26].
From the extensive survey of the various RSI retrieval schemes, it is observed that the outcomes of the existing systems are challenging because of the following research gaps:
Existing CBRSIR systems face limitations, including weak spatial connectivity between local and global features, high computational complexity, long retrieval times, reduced accuracy for large-class datasets, and reliance on irrelevant, manually tagged metadata. To overcome these challenges, this work proposes a hybrid CBIR framework that combines deep learning and traditional descriptors, enabling richer feature representation, faster retrieval, and higher accuracy, particularly for complex and large-scale RSI datasets. The main contributions of the article are summarized as follows:
The remainder of this article is structured as follows. Section 2 details the methodology, Section 3 outlines feature embedding block based discrete wavelet transform technique, Section 4 presents the experimental results and corresponding discussion. Finally, Section 5 presents the conclusions and outlines the future direction for improving the proposed work.
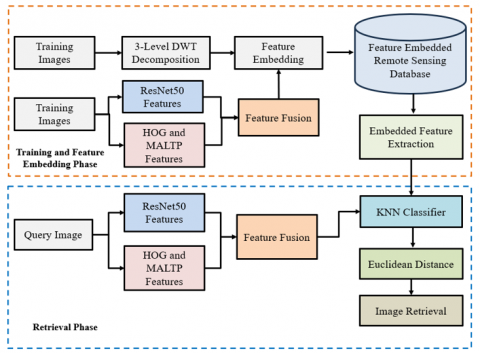
The flow of the proposed system is illustrated in Figure 1, which comprises the training and testing phases. During the training phase, the system is trained using the features of the training samples of the remote sensing images. During the testing phase, the system provides a query image for CBIR. ResNet50 captures deep, high-level semantic features for depicting objects, shapes, and patterns in remote sensing images. The HOG features acquire the edge orientations to describe the structural features, and MALTP features provide the local variations and fine texture details of the remote sensing images. Combining the ResNet50, MALTP, and HOG features enhances the system’s robustness against variations in contrast, shift, illumination, noise, and textural abnormalities. ResNet50 helps characterize the complex patterns in remote sensing images. The features are concatenated and provided to the KNN classifier for the CBIR of remote sensing images. The features are embedded in the RSIs using BBDWT during the upload to the server. During the online CBRSIR, the features are extracted from the stored images for matching with the features of query images, reducing the feature extraction time without degrading the visual quality of the images.
Figure 1. Flow diagram of proposed system
2.1 HOG
The HOG provides the orientation of the gradients in various directions to characterize the shape of objects present in remote sensing images. The horizontal and vertical gradients are computed using a horizontal derivative filter (Hx) and a vertical derivative filter (Hy) as given in Eq. (1) and Eq. (2), respectively:
$H x=\left[\begin{array}{lll}-1 & 0 & 1\end{array}\right]$ (1)
$H y=\left[\begin{array}{lll}-1 & 0 & 1\end{array}\right]^T$ (2)
The gradients are computed by convolving the image (im) with Hx and Hy as given in Eq. (3) and Eq. (4). The gradient’s magnitude (GM) provides the edges’ overall concentration as in Eq. (5). The orientation (θ) of the gradient is computed using Eq. (6) in 9 bins (9 directions) between 0 and 180 degrees.
$I x=i m * H x$ (3)
$I y=i m * H y$ (4)
$G M=\sqrt{I x^2+I y^2}$ (5)
$\theta=\tan ^{-1}\left(\frac{I y}{I x}\right)$ (6)
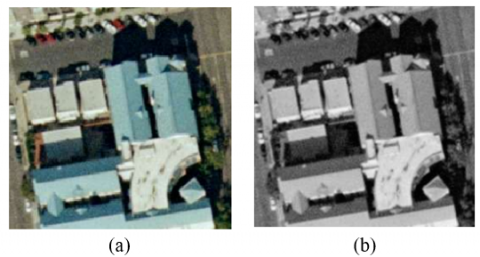
Initially, the images are normalized using the second normalization form to address the problem of illumination variations. The image is divided into local blocks of size 2 × 2 cells, each with a cell size of 16 × 16 pixels. For contrast enhancement, the blocks are considered to be 50% overlapping. A total of 9-bin histograms is computed over the cell. The cell size is 16 × 16 pixels, the block size is 2 × 2 cells, and there are nine bin orientations with 50% block overlap, resulting in a total of 31 × 31 × 2 × 2 × 9 = 34596 features. The visualizations of the HOG descriptors are shown in Figure 2.
Figure 2. Visualization of HOG features: (a) Original remote sensing image, (b) Gray image, (c) Horizontal gradient, (d) Vertical gradient, (e) Magnitude of gradient, (f) Orientation of gradient
2.2 LTP features
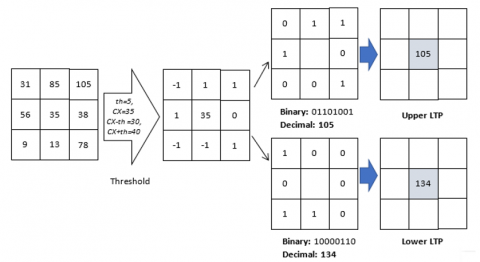
LTP is an enhanced version of LBP that introduces three binarisation levels instead of the two levels used in LBP. This modification enables LTP to capture finer local spatial details, thereby enhancing its ability to represent local variations within images. In LTP, an image is divided into local patches of 3 × 3 pixels. A threshold value (th) is set and each neighboring pixel is compared to the central pixel value (CX). If a neighboring pixel’s value exceeds CX + th, it is assigned a pattern value of 1. If it is less than CX - th, it is assigned -1. When the value of the pixels falls between CX + th and CX - th, the LTP value (Ł) is assigned 0, as described in Eq. (7).
$\mathrm{Ł}(x)=\left\{\begin{array}{c}-1, \text { if } x<C X-t h \\ 0, \text { if } C X-t h \leq x \leq C X+t h \\ 1, \text { if } x>C X+t h\end{array}\right.$ (7)
The U-LTP is generated by replacing -1 with 0, while the L-LTP is formed by converting -1 to 1 and 1 to 0, creating a binary pattern. The binary sequences of both L-LTP and U-LTP are then transformed into their decimal equivalents, resulting in values ranging from 0 to 255 due to the presence of 8 neighboring pixels, as given in Figure 3. The manually chosen threshold value highly influences the performance of LTP. Additionally, LTP features are susceptible to noise and variations in illumination across the image. Conventional LTP relies on a single neighbouring pixel to analyse correlation, making it more susceptible to noise and uneven contrast.
Figure 3. Visualization of the LTP process
2.3 Multiscale adaptive LTP features
The conventional LTP evaluates texture based solely on adjacent neighbours, reducing its robustness in noisy and low-contrast images. Additionally, the manual decision of the threshold value and its limited spatial connectivity negatively impact classification performance. To address these limitations, the proposed modified multiscale adaptive LTP (MALTP) incorporates multiple neighbouring levels (up to three) for texture analysis.
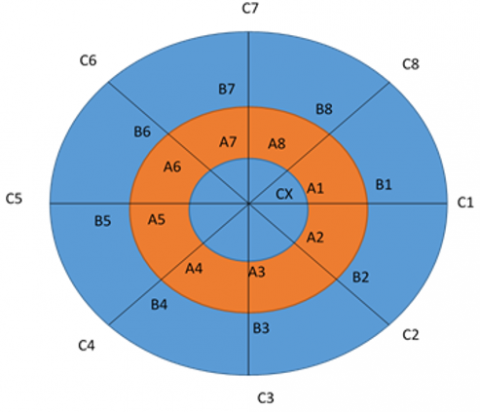
MALTP considers eight neighbours such as A1−8, B1−8, C1−8. The proposed MALTP considers the threshold value based on the average local covariance in Eq. (8). The proposed adaptive threshold considers the minimum and maximum values of the local covariance of the local window to retain the texture information.
$t h=\frac{\min \left(I m_{v a r}\right)+\max \left(I m_{v a r}\right)}{2}$ (8)
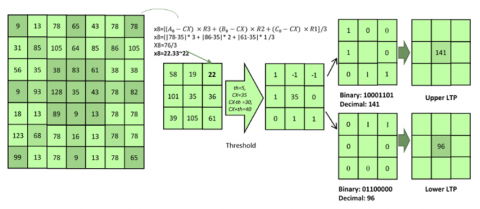
Figure 4 illustrates the MALTP process at radii R1 = 1, R2 = 2, and R3 = 3, respectively. This approach establishes connectivity between the center pixel and its first, second, and third adjacent neighbors, thereby enhancing texture representation. The equivalent neighbouring pixel value is computed using Eq. (9), which assigns greater weight to the closest neighbour than to those at R3 = 3.
$\begin{gathered}x=\mathrm{Ł}\left(A_i-C X\right) \times R 3 +\mathrm{Ł}\left(B_i-C X\right) \times R 2+\mathrm{L}\left(C_i-C X\right) \times R 1\end{gathered}$ (9)
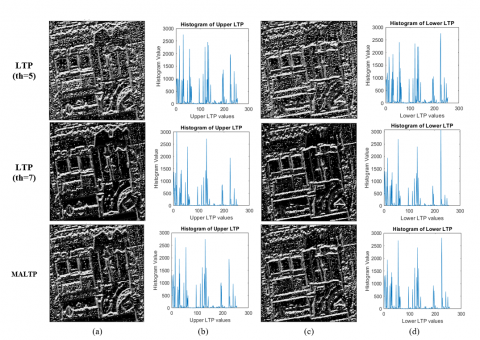
The ULTP and LLTP are divided into the N × N blocks, and each block’s histograms are computed. The histograms from every block are concatenated to generate the final feature vector. Splitting the image into blocks helps capture the variation in ECG signals within the local region. It offers better spatial connectivity than the single-block features. The MALTP histogram single block (N = 1) offers 512 features (256 for ULTP and 256 for LLTP), computed to provide scale and shift invariance. When N = 2, the LLTP and ULTP descriptors are divided into equal blocks of a 2 × 2 local region, where each block consists of a total of (row/2) rows and (cols/2) columns, where row and col indicate the original rows and columns in the image. The processes of MALTP and visualization of ULTP, LLTP, and their histograms are illustrated in Figure 5 and Figure 6, respectively.
Figure 4. Spatial representation of MALTP
Figure 5. Process of MALTP
Figure 6. Visualizations of the traditional LTP and MALTP: (a) Upper LTP descriptor, (b) Histogram of ULTP descriptor, (c) Lower LTP descriptor, (d) Histogram of LLTP descriptor
The algorithm for the MALTP-based feature representation is provided in Algorithm 1:
|
Algorithm 1: MALTP for texture feature representation |
|
|
Input: RSI image, Radius R Output: MALTP features |
|
|
1. |
Read the image im |
|
2. |
Convert the image to gray scale. |
|
3. |
Consider the local block with R neighbors. |
|
4. |
Compute the threshold using Eq. (8). |
|
5. |
Compute the upper and lower LTP using Eq. (7) and Eq. (9). |
|
6. |
Compute histogram for upper and lower LTP as $H_{U L T P}$ and $H_{L L T P}$ |
|
7. |
Combine the histograms to provide the final feature vector MALTP=[$H_{U L T P}$, $H_{L L T P}$] |
The Discrete Wavelet Transform (DWT)-based data hiding helps to retain the structural and perceptual quality of the RSIs. The features are embedded in the RSIs as the blind watermarking techniques without disturbing the visual, perceptual, and structural quality of the RSIs. The embedded features are extracted during the retrieval process to compare the features of the stored images with those of the query images. This feature embedding helps to minimize the retrieval time of the CBRSIR. The original RSI is divided into blocks of smaller blocks, each with m×m pixels, to preserve the local texture and shape properties of the RSIs. The RSI is divided into three levels, utilizing a Daubechies-2 (Db2) filter to embed the feature vector (message) within the RSI, ensuring robustness and imperceptibility. The DWT decomposes the host RSI into four sub-bands: LL (Low-Low), LH (Low-High), HL (High-Low), and HH (High-High). At the first level, the image undergoes DWT decomposition, resulting in LL1, HL1, LH1, and HH1 sub-bands. The LL1 sub-band is further decomposed at the second level, yielding LL2, HL2, LH2, and HH2 sub-bands. Furthermore, third-level DWT decomposition provides subbands such as LL3, HL3, LH3, and HH3, enabling the creation of a hierarchical structure of frequency components. Using Db2 as the wavelet basis ensures better smoothness and frequency localization, making the data embedding less visible while maintaining robustness against attacks like compression and noise. The features are typically embedded in the LL sub-bands of the third-level decomposition, as they contain less important edge information and offer a good trade-off between robustness and imperceptibility. After embedding, an Inverse DWT is applied to reconstruct the watermarked image. This approach ensures that the features remain hidden from the human eye while being resilient to common image-processing attacks. Eq. (10) shows the embedding process. We have considered a block size of 2×2 to retain the subband’s overall structural and local perceptual quality.
$W M^{\prime}=(k \times L L 3)+(q \times w m)$ (10)
where, WM' denotes the feature embedded image, k and q denote scaling factors, LL3 suggests the low-frequency element of the level 3 decomposed components of the original RSI, and wm means feature vector. The watermark image and the decomposed components of the cover after being multiplied by k are added. The scaling factor q is crucial in DWT-based feature embedding, as it balances imperceptibility and robustness. A higher q increases robustness against attacks but may introduce visible distortions, while a lower q preserves image quality but makes the feature vector more vulnerable. Typically, q ranges between 0.1 and 0.5, depending on the application and image characteristics. A value of 0.25 is chosen as the optimal trade-off, ensuring the features remain perceptually invisible while providing sufficient resistance against common attacks, such as geometric attacks, filtering, and noise. This value is particularly effective in RSIs, where preserving visual fidelity is essential while maintaining feature vector preservation under various transformations.
During retrieval, features are extracted from RSIs by applying the reverse process of feature embedding and are then compared with the features of the query image.
This section provides the experimental results and discussions of the proposed CBRSIR.
4.1 Dataset
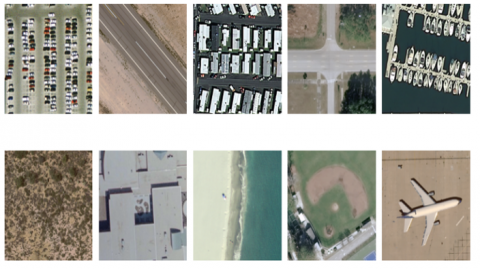
The results of the proposed CBIR method are evaluated using the UCM dataset [1], which comprises 21 classes of land-use images. There are 100 images of each class, with a resolution of 256 × 256 pixels. The images are collected from the USGS National Map Urban Area Imagery collection for various urban areas around the country. The sample images of the dataset are given in Figure 7.
Figure 7. Sample images of UCM dataset
4.2 Feature embedding evaluation
Table 1 summarizes the performance of feature embedding in RSIs using BBDWT for a block size of 2 × 2, evaluated across various land cover classes. Key image quality metrics—Mean Squared Error (MSE), Peak Signal-to-Noise Ratio (PSNR), and Structural Similarity Index (SSIM)—are used to assess the distortion after embedding. Most datasets exhibit low MSE values (e.g., Agricultural: 3.86, Intersection: 3.67), indicating minimal error. Meanwhile, PSNR values above 40 dB reflect high fidelity between the original and processed images. High SSIM values (mostly 0.90) across datasets confirm good structural preservation. Classes such as Dense Residential, Mobile Home Park, and Storage Tanks demonstrate excellent performance with SSIM values of 0.96, indicating the strong robustness of the BBDWT method.
Table 1. Feature embedding performance comparison for various classes
|
Dataset |
MSE |
PSNR |
SSIM |
|
Agricultural |
3.86 |
42.30 |
0.95 |
|
Airplane |
8.17 |
39.04 |
0.95 |
|
Baseball diamond |
5.48 |
40.78 |
0.90 |
|
Beach |
4.3 |
41.83 |
0.91 |
|
Buildings |
4.47 |
41.66 |
0.91 |
|
Chaparral |
5.44 |
40.81 |
0.94 |
|
Dense residential |
6.08 |
40.33 |
0.96 |
|
Forest |
7.69 |
39.31 |
0.93 |
|
Freeway |
4.44 |
41.69 |
0.96 |
|
Golf course |
6.05 |
40.35 |
0.94 |
|
Harbor |
6.55 |
40.00 |
0.92 |
|
Intersection |
3.67 |
42.52 |
0.88 |
|
Medium residential |
5.82 |
40.52 |
0.94 |
|
Mobile home park |
7.5 |
39.41 |
0.96 |
|
Overpass |
6.57 |
39.99 |
0.93 |
|
Parking lot |
5.01 |
41.17 |
0.94 |
|
River |
7.03 |
39.70 |
0.91 |
|
Runway |
4.84 |
41.32 |
0.93 |
|
Sparse residential |
8.14 |
39.06 |
0.88 |
|
Storage tanks |
7.06 |
39.68 |
0.96 |
|
Tennis court |
8.07 |
39.10 |
0.94 |
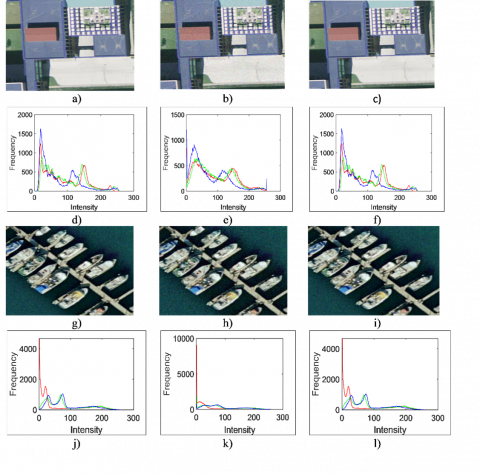
Figure 8. Histogram analysis of the feature embedding: a) and g) Samples images; b) and h) Feature embedded image; c) and i) Recovered image; d) and j) Histogram of original samples; e) and k) Histogram of feature embedded image; f) and l) Histogram of recovered image
However, slightly lower SSIM scores for Intersection and Sparse Residential (0.88) suggest marginal perceptual degradation in complex scenes. Overall, the BBDWT-based embedding approach maintains high visual and structural quality, making it effective for various types of remote sensing images. The histogram analysis of the original, feature-embedded, and recovered images for the two sample images is shown in Figure 8.
The histogram analysis reveals that the feature-embedded and recovered images retain the structural and visual characteristics of the RSIs, exhibiting 93–95% similarity in the histogram values. The number of pixels change rate (NPCR) between the original and feature-embedded RSI varies between 0.04 and 0.078. In contrast, the NPCR for the original and recovered image varies in the range of 0.001 to 0.003, which demonstrates the retention of the overall quality of the RSIs.
4.3 Retrieval performance
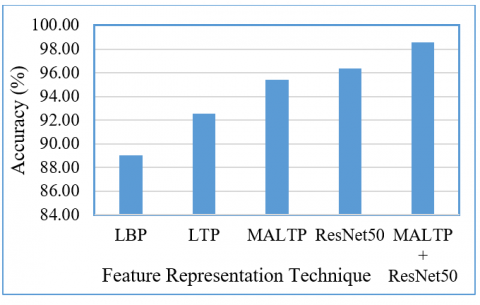
Table 2 presents the performance of various algorithms in content-based CBRSIR, evaluated by accuracy, recall, precision, and F1-score for 21 classes. The LBP method, a widely used texture descriptor, achieves an accuracy of 89.05% with a recall of 0.89, precision of 0.88, and an F1-score of 0.89. While LBP is computationally efficient and robust to illumination variations, its limited feature extraction capability constrains its retrieval performance.
Table 2. Comparative results of the proposed CBRSIR method
|
Algorithm |
Accuracy |
Recall |
Precision |
F1-Score |
|
LBP |
89.05 |
0.89 |
0.88 |
0.89 |
|
LTP |
92.54 |
0.93 |
0.90 |
0.91 |
|
MALTP |
95.40 |
0.95 |
0.93 |
0.94 |
|
ResNet50 |
96.35 |
0.96 |
0.95 |
0.95 |
|
MALTP+ResNet50 |
98.57 |
0.98 |
0.98 |
0.98 |
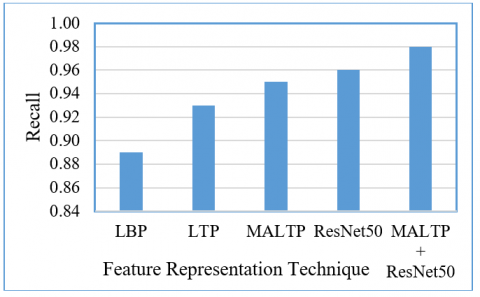
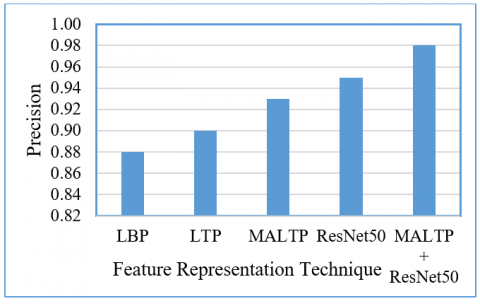
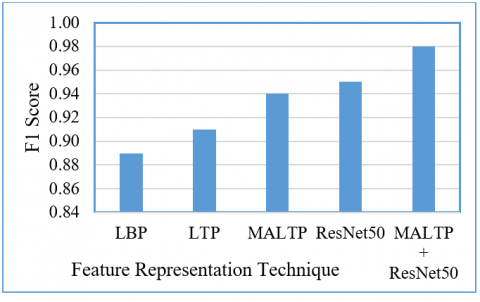
This enhancement results in a higher accuracy of 92.54%, a recall of 0.93, a precision of 0.90, and an F1-score of 0.91, demonstrating its superiority in CBRSIR applications. The MALTP further refines feature extraction by integrating adaptive and multiscale techniques, significantly improving retrieval effectiveness. With an accuracy of 95.40%, a recall of 0.95, a precision of 0.93, and an F1-score of 0.94, MALTP outperforms traditional LBP and LTP methods, demonstrating its ability to extract richer texture features and improve retrieval accuracy. The ResNet50 DL model, known for its powerful hierarchical feature representation, achieves even higher performance with an accuracy of 96.35%, a recall of 0.96, a precision of 0.95, and an F1-score of 0.95. This demonstrates the effectiveness of deep convolutional networks in learning discriminative image features, making them well-suited for remote sensing image retrieval tasks. Combining MALTP with ResNet50 further enhances performance, achieving a record accuracy of 98.57%, with recall, precision, and F1-score values of 0.98. This hybrid approach leverages the handcrafted feature extraction strengths of MALTP with the DL capabilities of ResNet50, leading to a highly effective and robust CBRSIR system. Figures 9-12 visualize the results for the different feature representation schemes, respectively.
Figure 9. Accuracy comparison of the proposed CBRSIR
Figure 10. Recall comparison of the proposed CBRSIR
Figure 11. Precision comparison of the proposed CBRSIR
Figure 12. F1-score comparison of the proposed CBRSIR
Table 3. Comparative analysis of CBRSIR
|
Performance Metrics |
Number of Classes |
LBP |
LTP |
MALTP |
ResNet50 |
MALTP+ ResNet50 |
|
Accuracy |
5-class |
91.09 |
94.63 |
98.63 |
98.83 |
100 |
|
10-class |
90.46 |
93.88 |
97.44 |
97.89 |
100 |
|
|
15-class |
89.61 |
93.16 |
96.28 |
97.19 |
99.29 |
|
|
20-class |
89.05 |
92.54 |
95.4 |
96.35 |
98.57 |
|
|
Recall |
5-class |
0.91 |
0.95 |
0.99 |
0.99 |
1 |
|
10-class |
0.9 |
0.94 |
0.97 |
0.98 |
1 |
|
|
15-class |
0.9 |
0.93 |
0.96 |
0.97 |
0.99 |
|
|
20-class |
0.89 |
0.93 |
0.95 |
0.96 |
0.99 |
|
|
Precision |
5-class |
0.96 |
0.98 |
0.99 |
1 |
1 |
|
10-class |
0.95 |
0.95 |
0.98 |
0.99 |
1 |
|
|
15-class |
0.94 |
0.94 |
0.96 |
0.97 |
0.99 |
|
|
20-class |
0.88 |
0.9 |
0.93 |
0.95 |
0.98 |
|
|
F1-score |
5-class |
0.93 |
0.96 |
0.99 |
0.99 |
1 |
|
10-class |
0.92 |
0.94 |
0.98 |
0.98 |
1 |
|
|
15-class |
0.92 |
0.94 |
0.96 |
0.97 |
0.99 |
|
|
20-class |
0.89 |
0.91 |
0.94 |
0.95 |
0.98 |
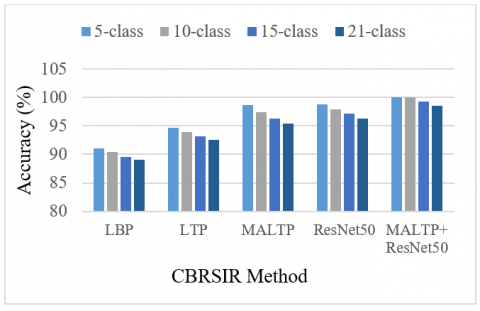
Figure 13. Accuracy for CBRSIR for different retrieval classes
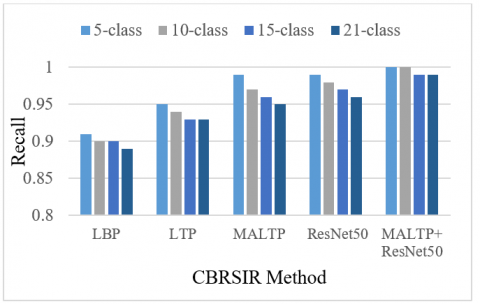
Figure 14. Recall for CBRSIR for different retrieval classes
Figure 15. Precision for CBRSIR for different retrieval classes
Figure 16. F1-score for CBRSIR for different retrieval classes
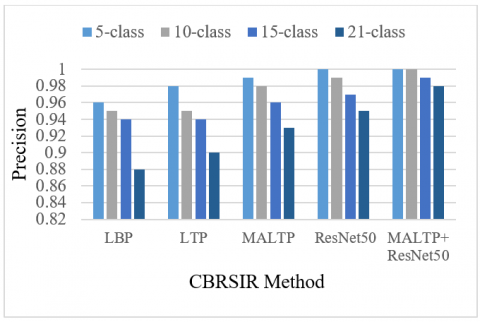
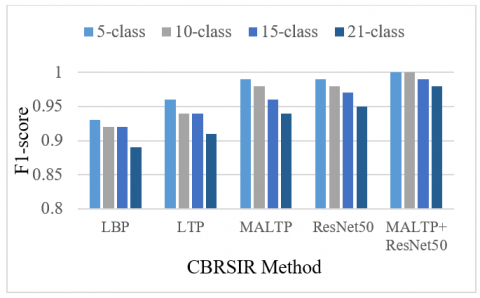
Table 3 analyses CBRSIR across different classification levels (5-class, 10-class, 15-class, and 21-class). The evaluation is based on accuracy, recall, precision, and F1-score for five different algorithms: LBP, LTP, MALTP, ResNet50, and MALTP+ResNet50. The results are presented in Figures 13-16, respectively. As the number of classes increases, a general decline in performance is observed across all algorithms.
A higher number of classes introduces greater complexity and inter-class similarity, making retrieval more challenging. However, the extent of degradation varies among methods. LBP, a traditional texture descriptor, performs the worst among all techniques, dropping accuracy from 91.09% in the 5-class scenario to 89.05% in the 21-class scenario. LTP outperforms LBP by introducing ternary patterns, achieving higher accuracy (92.54% for 21 classes) and better precision and recall. However, both methods struggle as the number of classes increases, highlighting their limitations in handling complex remote-sensing images.
Proposed MALTP, which enhances LTP by incorporating adaptive multiscale analysis, significantly outperforms traditional descriptors. It achieves 95.40% accuracy in the 21-class scenario, indicating its superior ability to extract discriminative features. ResNet50, a DL model, further improves performance, reaching 96.35% accuracy in the most complex case. DL’s hierarchical feature extraction proves to be highly effective in CBRSIR. The best-performing method combines MALTP and ResNet50, achieving perfect retrieval (100%) for smaller class sets and maintaining the highest accuracy (98.57%) even for 21-class retrieval. Its recall, precision, and F1 score remain near-perfect, showcasing the power of combining hand-crafted features with DL. As the number of classes increases, retrieval accuracy drops across all models, emphasising the need for more robust feature extraction. Traditional methods (LBP, LTP) struggle with large-scale retrieval, while DL approaches (ResNet50) and hybrid techniques (MALTP+ResNet50) maintain strong performance. The fusion of handcrafted features (MALTP) with DL (ResNet50) significantly boosts retrieval effectiveness, demonstrating the importance of feature diversity in CBRSIR.
Table 4 presents the Mean ± SD performance comparison of different CBRSIR methods across accuracy, F1-score, precision and recall. The MALTP + ResNet50 combination outperformed all other methods, achieving near-perfect accuracy (99.47 ± 0.68) and balanced precision–recall performance (0.992 ± 0.010 and 0.995 ± 0.006, respectively), demonstrating the effectiveness of integrating handcrafted and deep features for CBRSIR tasks.
Table 4. Mean ± SD comparison of various CBRSIR methods
|
Method |
Accuracy |
F1-Score |
Precision |
Recall |
|
LBP |
90.05 ± 0.90 |
0.915 ± 0.017 |
0.932 ± 0.036 |
0.900 ± 0.008 |
|
LTP |
93.55 ± 0.90 |
0.937 ± 0.021 |
0.942 ± 0.033 |
0.937 ± 0.010 |
|
MALTP |
96.94 ± 1.40 |
0.967 ± 0.022 |
0.965 ± 0.026 |
0.967 ± 0.017 |
|
ResNet50 |
97.57 ± 1.05 |
0.972 ± 0.017 |
0.977 ± 0.022 |
0.975 ± 0.013 |
|
MALTP + ResNet50 |
99.47 ± 0.68 |
0.992 ± 0.010 |
0.992 ± 0.010 |
0.995 ± 0.006 |
Table 5 presents a comparison of the retrieval times for the different classes with and without feature embedding. It is observed that the feature embedding offers improvements of 61.97%, 54.54%, 53.16%, and 62.76% in average retrieval time over CBRSIR without feature embedding. The feature embedding into RSIs helps minimize the time required for hand-crafted feature extraction during the online query comparison process, leading to lower retrieval times. The better value of PSNR and MSE results in better extraction of features from the RSIs.
Table 5. Retrieval time comparison with and without feature embedding
|
Algorithm |
Number of Classes |
Average Retrieval Time (sec) |
|
|
|
|
Without Feature Embedding |
With Feature Embedding |
|
TWFR-CBRSIR |
5 |
3.45 |
2.31 |
|
10 |
5.78 |
3.74 |
|
|
15 |
7.98 |
5.21 |
|
|
20 |
13.64 |
8.38 |
|
4.4 Comparative study
Table 6 compares the proposed CBRSIR with the traditional techniques. It achieves an improved MSE of 0.98 for 21-class retrieval, outperforming the DMsH presented by Zhang et al. [18]. TWFR-CBRSIR achieves an improved accuracy of 98.57% for 21-class retrieval, surpassing DSAN (90%), VGG19 (95.07%), VGG16 (93%), and ResNet (91%). It is observed that the combination of the novel MALTP texture descriptor and ResNet-50 yields an improved texture description of the RSIs, thereby enhancing the system’s retrieval accuracy.
Table 6. Results comparison with the traditional state-of-the-art
|
Authors |
Method |
Number of Classes |
Accuracy |
MAP |
|
Zhang et al. [18] |
DMsH |
21 |
- |
0.97 |
|
Cheng et al. [12] |
DSAN |
21 |
90% |
- |
|
Maurya et al. [19] |
VGG19 |
21 |
95.07% |
- |
|
VGG16 |
21 |
93% |
- |
|
|
ResNet |
21 |
91% |
- |
|
|
Proposed |
TWFR-CBRSIR |
5 |
100% |
1 |
|
10 |
100% |
1 |
||
|
15 |
99.29% |
0.99 |
||
|
20 |
98.57% |
0.98 |
The proposed TWFR-CBRSIR helps improve feature distinctiveness by enhancing spatial connectivity using MALTP and utilizing a multilevel hierarchical feature depiction with ResNet50. The TWFR-CBRSIR achieves an improved accuracy of 98.57% for 20-class retrieval, surpassing the accuracy of traditional methods. The MALTP offers a superior texture representation to the traditional LBP and LTP by enhancing its texture feature depiction capability. The BBDWT helps preserve the structural and perceptual quality of images by embedding features into RSIs, which minimize retrieval time. The feature embedding into RSIs shows a significant drop-in retrieval time, ranging from 53.16% to 62.76% compared to CBRSIR without feature embedding. The proposed feature embedding enhances the ease of the CBIR system by storing the features inside the RSIs that can be extracted during the retrieval process, thereby saving runtime feature extraction time.
In the future, the system's outcomes can be enhanced by embedding metadata of objects in images for text-based retrieval of RSI based on actual appearance, shape, attributes, and color information of objects. The existing DL model lacks in interpretation results because of its black box nature, therefore, in future system, effectiveness can be improved by boosting the “Interpretability and Explainability” of the system.
[1] Yang, Y., Newsam, S. (2010). Bag-of-visual-words and spatial extensions for land-use classification. In Proceedings of the 18th SIGSPATIAL International Conference on Advances in Geographic Information Systems, pp. 270-279. https://doi.org/10.1145/1869790.1869829
[2] Latif, A., Rasheed, A., Sajid, U., Ahmed, J., Ali, N., Ratyal, N.I., Zafar, B., Dar, S.H., Sajid, M., Khalil, T. (2019). Content-based image retrieval and feature extraction: A comprehensive review. Mathematical Problems in Engineering, 2019: 9658350. https://doi.org/10.1155/2019/9658350
[3] Omran, G.A., Hayale, W.S.A., AlRababah, A.A., Al-Barazanchi, I.I., Sekhar, R., Shah, P., Parihar, S., Penubadi, H.R. (2025). Utilizing a novel deep learning method for scene categorization in remote sensing data. Mathematical Modelling of Engineering Problems, 12(2): 657-668. https://doi.org/10.18280/mmep.120229
[4] Kishore, D., Rao, C.S. (2021). Content-based image retrieval system based on fusion of wavelet transform, texture and shape features. Mathematical Modelling of Engineering Problems, 8(1): 110-116. https://doi.org/10.18280/mmep.080114
[5] Garg, M., Dhiman, G. (2021). A novel content-based image retrieval approach for classification using GLCM features and texture fused LBP variants. Neural Computing and Applications, 33(4): 1311-1328. https://doi.org/10.1007/s00521-020-05017-z
[6] Shao, Z., Zhou, W., Deng, X., Zhang, M., Cheng, Q. (2020). Multilabel remote sensing image retrieval based on fully convolutional network. IEEE Journal of Selected Topics in Applied Earth Observations and Remote Sensing, 13: 318-328. https://doi.org/10.1109/JSTARS.2019.2961634
[7] Vharkate, M.N., Musande, V.B. (2021). Remote sensing image retrieval using hybrid visual geometry group network with relevance feedback. International Journal of Remote Sensing, 42(14): 5540-5567. DOI:10.1080/01431161.2021.1925373
[8] Gu, Y., Wang, Y., Li, Y. (2019). A survey on deep learning-driven remote sensing image scene understanding: Scene classification, scene retrieval and scene-guided object detection. Applied Sciences, 9(10): 2110. https://doi.org/10.3390/app9102110
[9] Zhang, W., Tang, P., Zhao, L. (2019). Remote sensing image scene classification using CNN-CapsNet. Remote Sensing, 11(5): 494. https://doi.org/10.3390/rs11050494
[10] Ma, L., Liu, Y., Zhang, X., Ye, Y., Yin, G., Johnson, B.A. (2019). Deep learning in remote sensing applications: A meta-analysis and review. ISPRS Journal of Photogrammetry and Remote Sensing, 152: 166-177. https://doi.org/10.1016/j.isprsjprs.2019.04.015
[11] Yuan, Z., Zhang, W., Tian, C., Rong, X., Zhang, Z., Wang, H., Fu, K., Sun, X. (2022). Remote sensing cross-modal text-image retrieval based on global and local information. IEEE Transactions on Geoscience and Remote Sensing, 60: 1-16. https://doi.org/10.1109/TGRS.2022.3163706
[12] Cheng, Q., Zhou, Y., Fu, P., Xu, Y., Zhang, L. (2021). A deep semantic alignment network for the cross-modal image-text retrieval in remote sensing. IEEE Journal of Selected Topics in Applied Earth Observations and Remote Sensing, 14: 4284-4297. https://doi.org/10.1109/JSTARS.2021.3070872
[13] Zhang, M., Cheng, Q., Luo, F., Ye, L. (2021). A triplet nonlocal neural network with dual-anchor triplet loss for high-resolution remote sensing image retrieval. IEEE Journal of Selected Topics in Applied Earth Observations and Remote Sensing, 14: 2711-2723. https://doi.org/10.1109/JSTARS.2021.3058691
[14] Sumbul, G., Ravanbakhsh, M., Demir, B. (2022). Informative and representative triplet selection for multilabel remote sensing image retrieval. IEEE Transactions on Geoscience and Remote Sensing, 60: 1-11. https://doi.org/10.1109/TGRS.2021.3124326
[15] Mi, L., Li, S., Chappuis, C., Tuia, D. (2022). Knowledge-aware cross-modal text-image retrieval for remote sensing images. In Proceedings of the Second Workshop on Complex Data Challenges in Earth Observation (CDCEO 2022).
[16] Al Rahhal, M.M., Bazi, Y., Alsharif, N.A., Bashmal, L., Alajlan, N., Melgani, F. (2022). Multilanguage transformer for improved text to remote sensing image retrieval. IEEE Journal of Selected Topics in Applied Earth Observations and Remote Sensing, 15: 9115-9126. https://doi.org/10.1109/JSTARS.2022.3215803
[17] Song, W., Gao, Z., Dian, R., Ghamisi, P., Zhang, Y., Benediktsson, J.A. (2022). Asymmetric hash code learning for remote sensing image retrieval. IEEE Transactions on Geoscience and Remote Sensing, 60: 1-14. https://doi.org/10.1109/TGRS.2022.3143571
[18] Zhang, H., Qin, Q., Ge, M., Huang, J. (2024). Deep multi-similarity hashing with spatial-enhanced learning for remote sensing image retrieval. Electronics, 13(22): 4520. https://doi.org/10.3390/electronics13224520
[19] Maurya, A., Akashdeep, Kumar, R. (2024). Classification of University of California (UC), Merced land-use dataset remote sensing images using pre-trained deep learning models. In Deep Learning Techniques for Automation and Industrial Applications, pp. 45-67. https://doi.org/10.1002/9781394234271.ch4
[20] Chembian, W., Senthilkumar, G., Prasanth, A., Subash, R. (2025). K-means pelican optimization algorithm-based search space reduction for remote sensing image retrieval. Journal of the Indian Society of Remote Sensing, 53(1): 101-115. https://doi.org/10.1007/s12524-024-01994-z
[21] Hou, Z., Yan, H., Zhang, L., Ma, R., Yan, Q., Yang, B. (2025). A secure and efficient remote sensing image retrieval method with verifiable and traceable in cloud environment. IEEE Transactions on Geoscience and Remote Sensing, 63: 4701216. https://doi.org/10.1109/TGRS.2025.3539846
[22] Sudha, S., Aji, S. (2025). An intelligent two-stage hybrid hierarchical classification using optimized label propagation for remote sensing image retrieval. Journal of the Indian Society of Remote Sensing, 53: 2559-2575. https://doi.org/10.1007/s12524-025-02136-9
[23] Yang, X., Li, C., Wang, Z., Xie, H., Mao, J., Yin, G. (2025). Remote sensing cross-modal text-image retrieval based on attention correction and filtering. Remote Sensing, 17(3): 503. https://doi.org/10.3390/rs17030503
[24] Zhang, W., Li, J., Li, S., Niu, Z., Chen, J., Zhang, W. (2025). A resource-efficient training framework for remote sensing text–image retrieval. arXiv:2501.10638v1. https://doi.org/10.48550/arXiv.2501.10638
[25] Song, X., Lin, H., Wen, H., Hou, B., Xu, M., Nie, L. (2025). A comprehensive survey on composed image retrieval. arXiv:2502.18495v2. https://doi.org/10.48550/arXiv.2502.18495
[26] Walter, K., Gibson, M.J., Sowmya, A. (2020). Self-supervised remote sensing image retrieval. In IGARSS 2020 - 2020 IEEE International Geoscience and Remote Sensing Symposium, Waikoloa, HI, USA, pp. 1683-1686. https://doi.org/10.1109/IGARSS39084.2020.9323294