Ali Wala'a Khudair![]() | Ali Fadhil Naser*
| Ali Fadhil Naser*![]() | Ali A. Aldhalemi
| Ali A. Aldhalemi![]() | Haider F. Mahmood
| Haider F. Mahmood![]()
© 2025 The authors. This article is published by IIETA and is licensed under the CC BY 4.0 license (http://creativecommons.org/licenses/by/4.0/).
OPEN ACCESS
This research presents a complete assessment of the structural performance of precast prestressed concrete I-girder bridge spans. The study aimed to determine the self-weight natural frequency through modal analysis based on a combination of field inspection and numerical modeling using finite element methods (FEM), quantify the dynamic responses from live loads induced by vehicles using dynamic time history assessment (FEM) and evaluate the total structural health of the system. Results from the damage assessment showed that the girders, deck, piers, and abutments do not have any severe defect indications such as cracks with the bridge appearing to be in a fair condition. The static analysis shows expected positive bending moments of tensile and compressive stresses along the bridge span, vertical deflections, and area moments. For the Load combination analysis, no positive moments from prestressing showed maximum negative moments of -3822 kN·m at span No. 2, which does not permit cracking. There were no observable downward deflections and the maximum upward deflection was 5.31 mm. Dynamic analysis reveals that the structure has sufficient stiffness and elasticity. These findings suggested the bridge structure maintains sufficient stiffness and elasticity to withstand service loads effectively because natural frequency (4.98 Hz) was more than the dynamic vibration frequency under vehicle load (3.75 Hz). Thus, there is no evidence of structural damage or deterioration requiring intervention.
precast girder, damage, static, dynamic, deflection, natural frequency, velocity, acceleration
Such passages have been discussed across many topics, but the most important one, is regarding conditions in wartime and peacetime, and how critical the peacetime storyline, is in the role played by bridges in time. Bridges are fundamentally important and are critical in wartime as well as peacetime. They are important for enhancing the national economy and fostering social interaction. The construction demand for highway bridges is in direct proportion with economic development and social network expansion. However, in reality, there are cases of such bridges being built that get damaged because they are overloaded or because of climatic conditions. Such instances of damage are a concern for the general safety of the public and reduce its service life. Hence, it becomes necessary that structural assessment, performance evaluation, and behavior of any highway bridge are carried out before the structure is established so that the dimensional accuracy and endurance of the bridge are spotted [1, 2].
Bridges are vital adjustment nodal points for global communication networks forming part of road and railway systems, thanks to the evolution in structural engineering construction of large-span bridges with large span-to-depth ratios has become the norm, and with the use of structural steel or prestressed concrete. This is owing to their quite some advantages, such as great riding characteristics, reduced traffic-induced oscillations, greater torsional stiffness, and greater strength. Therefore, these bridges are stable, dynamic, long-lasting, and nicely designed [3]. Bridges are human-made structures designed to allow the passage of people, vehicles, water, and other elements across obstacles such as waterways, valleys, and roads, without blocking these paths. The type of bridge selected depends on factors such as the geotechnical report for the site, the hydraulic conditions of the construction area, the site's profile, and the cost of construction. Additionally, the size of the bridge is determined by the geographical area it connects and the volume of traffic it accommodates [4-6].
A bridge is an important and complex structure consisting of several components. These components can be divided into two sets. The first set includes bearings, girders or beams, the deck, joints, pavement layers, security barriers, and the drainage system. This Set is known as the superstructure. The substructure–that is, the foundations, piers, and pier caps–is the second set. Bridge structures can be classified according to the use of materials and type supports. Bridge types by material used in construction concrete bridge pre-stressed concrete bridge wooden bridge steel bridge with respect to support type, bridge structures include simple-supported bridges and continuous bridges [7-10].
The pre-stressed concrete bridge system is a one in which the tensile loads namely the tendon loads are applied in advance of any service loads, i.e., traffic loads, dead loads, temperature loads, wind loads, or other live loads. First of all, the pre-stressed concrete system consists of two systems. Post-tensioning is a technique where high-strength steel strands or bars (tendons) are used for reinforcement in concrete structures [11-13].
The main aim of bridge component damage inspection is to ensure the bridge is safe and detect where maintenance repair or even some strengthening is needed. There is a need to examine each bridge as a source of evidence on the structure in question, its condition, and its sufficiency. This knowledge ought to be documented as an integral part of the permanent record of the bridge, for it serves useful and sound purposes. The record also contains the history of any repairs made in the past and allows other people easy access to relevant information. The focus of the bridge inspection is the overall assessment of all the components of the bridge whether there is a need for maintenance reinforcement or not Bridge examinations cover all parts of the bridge to determine its condition and whether maintenance covering worse findings or enhancement could further benefit its use. The necessary activities described in the inspection plan consist of the report review and site condition inspections, preparation of the appropriate tools and equipment, providing provision of traffic control where necessary, site inspection, and structural inspection including the deck, superstructure, and substructure along with the girders [14-18].
Bridge analysis is carried out with the aid of engineering software which takes into consideration the various load types, material properties, and boundary conditions. The main aim in such a case is to design the bridges so that they can withstand enormous forces such as their weight, prestressed weight, vehicular loading, climatic conditions, and the heat of the sun. Bridge analysis can mainly be done in two ways which are called static and dynamic methods. The choice of the appropriate analytical method is related to some factors such as the type and design of the bridge, the soil properties on-site, the analysis methods used in the significance of the overall structure of the bridge, and the analysis of the objectives of the bridge. Finite element methods are used to analyze data in most engineering software. In the current research on complicated structural engineering designs, finite element method is one of the methods which is famous and currently in use. The basis of this approach is in substituting the real framework with a conceptual picture of that frame composed of such minimum units as finite elements, which are further linked up at different junction points called nodes [19-21].
The first belief implicit in the definition is that finite element analysis has limitations as a methodology for describing a static condition of a bridge structure because three main reasons stand in its applicability and use. Saves time in the design process, reduces the cost of construction, and increases the safety of the structure. In the past, to get analysis for huge forms such as bridges, the geometric figures of the tallest buildings, etc., it was crucial to use intricate mathematical models. More often accuracy was placed in greater priority which means that more advanced and sophisticated approaches were employed. This naturally implied that a considerable amount of the designer's time was spent in carrying out math calculations. Finite element methods limit designers' focus on extensive and time-consuming calculations and enable them to focus more on the importance of accurately detailing the intended form and construction and examining the performance predicted to be achieved. Further, the other main output is the use of programs that possess interactive graphical tools which makes the generation of finite element models of structures of higher complexity and the generation of their results in a clear and understandable form seamless and straightforward [22, 23].
The dynamic interaction between moving vehicles and bridge structure is considered an important issue in the design and evaluation of bridges. The interaction between vehicle wheel and bridge deck composite surface is often overlooked in real designs due to its complexity which, however, is intrinsic to its importance. Sufficient evidence exists to warrant an increase of the static response through the application of an allowance dynamic factor, impact factor as it is commonly known. Several bridge codes design similar structures, even though this is not the most accurate of practice for reasons such as the relation between dynamic response and span length, and fundamental frequency of vibration, among others. While this practice of doing things speeds up the design process, it does many things the other way around that is, excessive simplification and misrepresentation of many other complicated processes, including the dynamics of the bridge [24-26].
When the speed of a vehicle nears certain thresholds, the vibrations generated by the vehicle's motion become pronounced. Such vibrations are detrimental to the safety of the bridge and the traveling passengers. They also threaten the supporting members of the structure. Therefore, it is necessary to limit, and if possible, eliminate these unwanted excessive vibrations caused by vehicular loads. Vertical vibrations are, however, of greatest concern as they cause large deflections at the bridge’s expansion joints and beam spans. Given the high rate of bridge failures due to natural aging and/or mechanical vibrations in Nigeria and other parts of the world, it becomes imperative to undertake more studies to understand how much damage is sustained structurally by the bridge when subjected to such continuous and occasional mechanical vibrations [27-29].
This study adopts an uncommon approach by integrating both static analysis (stresses, moments) and dynamic analysis (frequencies, accelerations) into a single model for evaluating prestressed concrete bridges. A time-history analysis is conducted to simulate the impact of a constant vehicle speed (100 km/h) on the bridge’s behavior. Based on numerical results and comparisons with standard specifications (such as AASHTO LRFD), enhanced field inspection criteria are developed.
2.1 Methodology
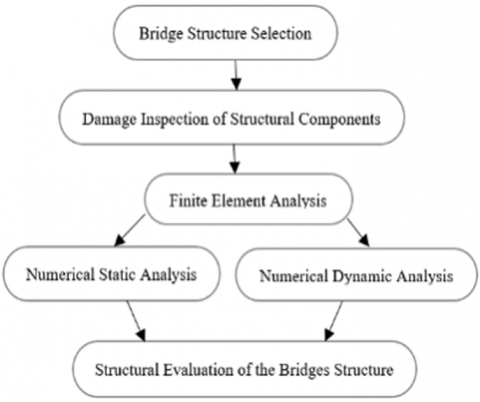
The study involves selecting a bridge structure, inspecting structural components for damage, conducting numerical static and dynamic analysis, and evaluating the structure's structural integrity. Figure 1 explains the flow chart of the methodology of the study.
Figure 1. Methodology of study
2.2 Objectives of research
This research has the following main aims:
a. To evaluate the structural elements of the bridge’s superstructure and find out whether damage has taken place in any of these elements.
b. To evaluate the static effects as a result of vehicle and service loads applied to the structure through numerical static analysis (the load combinations are taken into consideration).
c. To determine the natural frequency of the bridge system based on the self-weight of the structure using the modal analysis technique.
d. To model the dynamic response of the bridge system due to vehicle traffic live loads through a numerical dynamic time-history analysis.
e. To interpret the global efficiency of the bridge superstructure.
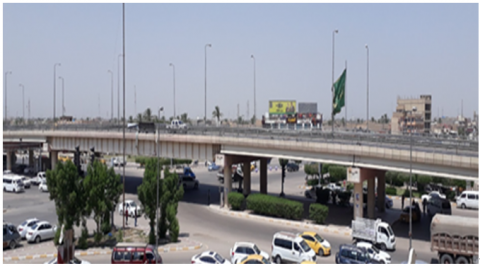
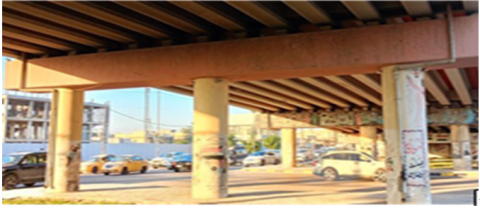
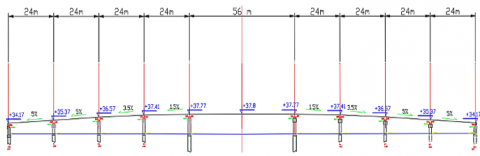
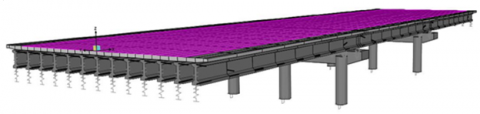
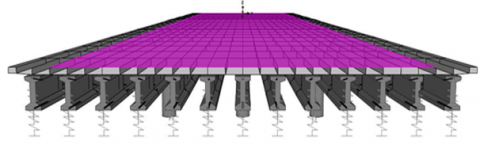
This research selected an important bridge that is located in Babylon City in the middle of Iraq. The name of the bridge is Al-Thawra Bridge. It is a composite bridge {I-(Steel & concrete girders)}. Abdullah Owiz General Contracting Company was responsible for the design and construction. Construction began in 2010 as part of a strategic plan to connect Baghdad with the southern governorates and reduce traffic at the city's entrance. The bridge's entire dimensions were 488 by 18.25 meters, and its intermediate span was the biggest in Iraq at 56 meters. The bridge was constructed in just 17 months instead of the original 20 months due to favorable weather and thorough engineering efforts. The bridge's overall measurements were 488 by 18.25 meters, and at 56 meters, it had Iraq's largest intermediate span. Thanks to excellent weather and diligent engineering efforts, the bridge was completed in just 17 months, compared to the original 20-month completion schedule. There are nine spans in all. One of them is a 56-meter-long steel I-girder span, while the other eight are precast prestressed concrete I-girder sections, each measuring 24 meters. The damage inspection's findings showed that the expansion joints needed to be replaced or repaired, but the bridge's structural elements were not significantly harmed. Figure 2 depicts the bridge's appearance. Figure 3 shows the layout of the bridge. Table 1 lists the geometric designs of bridge sections.
(a) View of bridge structure
(b) Precast prestressed concrete I-girder
Figure 2. Al-Thawra Bridge
Figure 3. The longitudinal layout of the bridge
Table 1. Bridge parts details
|
Bridge Parts |
Details |
|
Bridge |
Length without abutments: 248 m, With abutments: 488 m, Number of Spans: 9, Length of central span: 56 m, Length of one Span: 24 m, Width of bridge: 18.25 m, Lane width:7.88 m (two lanes), Sidewalk: 1 m, Median: 0.5 m |
|
Steel Girders |
Length: 55.9 m, Width: 0.7 m up & 0.8 m down, Number of steel girders in central span: 7, Height: 2.25 m, Type: Steel, Fy=52 MPa |
|
Precast Concrete Girders |
Length: 24 m, Width: 0.6 m, Number of concrete girders in one span: 13, Height: 1.2 m, C=45 MPa, Prestress load: 1800 KN |
|
Piers |
Diameter: 1.2 m top & 1.5 m bottom, Hight: 5 m & 20 m under N.G.L, Number of piers: 3×8=24. |
|
Piers cap |
Length: 18.1 m, Width:1.8m, Hight:1.2 m, Number of Piers cap:8 |
|
Abutments |
Length: 120 m × 2, Width: 18.25m, Hight: 4.75 m, Number of abutments: 2 |
|
Piles |
Diameter: 1.5 m, Height: 20 m, Number of piles in one span: 4×2=8 |
|
Piles cap |
Length: 18.3 m, Width:2.5 m, Height: 1.4 m, Number of piles cap: 2 |
|
Bearing pad & R.C. pad |
Length: 0.2 m, Width: 0.3 m, Height: 0.07 m Length: 0.4 m, Width: 0.4 m, Height: 0.128 m |
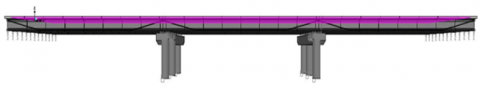
The span type that was evaluated in terms of its structural performance is a three-span precast prestressed concrete bridge. The static and dynamic analyses were performed with the aid of CSI Bridge version 25, which was selected for its capability to simulate the complex interaction between the vehicle and the bridge, as well as its support for time-history loading. The bridge span models analyzed in the study are shown in Figure 4. Two load cases were considered: vehicle load and load combinations. The load combinations include the combination of dead load, prestress, live load, temperature, wearing surface, and wind.
Figure 4. Numerical model of bridge spans
In this study, vehicle static load effects were analyzed using CSI Bridge version 25 to assess the static responses of the bridge. The performed responses include positive and negative bending moments, tensile and compressive stresses, positive and negative vertical shear forces, and vertical deflection.
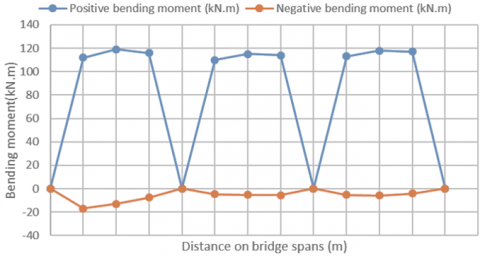
5.1 Positive and negative bending moment
Every girder is arranged across the two supports so that as each of them in turn is loaded toward the center of the span positive bending moments are developed. This can be seen particularly around the center of the span where the maximum positive bending moment is formed. Such is the case for span No. 1, which is determined from its 119 kN maximum span center, this is shown in Figure 5. The static analysis also shows that these maximum negative moments are of small magnitude and are located in the region of the end supports, so at invariant span No-1, the highest negative moment is -17 kN.
Figure 5. Positive and negative bending moment due to vehicle live load case along bridge spans length
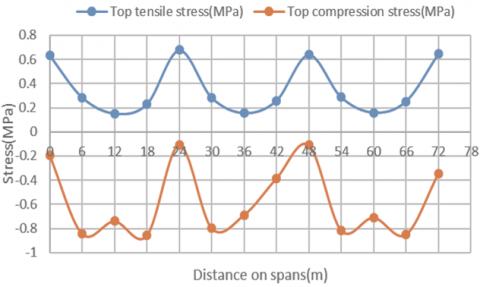
5.2 Tensile and compression stresses
Figure 6 and Figure 7 illustrate the results of tensile and compression stresses due to static analysis under the effect of vehicles' live load for the top and bottom of precast prestressed I-girders. From Figure 6, the higher value of tensile stress at the top of the girder is 0.677 MPa which is less than the allowable value of tensile stresses in equation No.1 from (AASHTO LRFD BRIDG which is equal to 3.35 MPa, indicating that the structural cracks will not appear in the top of girders. For compression stress, the maximum value at the top of the girders is -0.859 MPa, which is lower than allowable compression stress (20.25 MPa). Figure 7 shows that the maximum tensile stresses are located in the girders top of the bridge spans center which is 1.6 MPa and higher top compression stress is -0.71 MPa, lowering than allowable values for tensile stress (3.35 MPa) and compression stress (20.25 MPa). Also, structural cracks will not appear in the bottom of the girders.
$f \leq 0.5 \sqrt{ } f^{\prime} c=0.5 \times \sqrt{ } 45=3.35 \mathrm{MPa}~\mathrm{(for~ tensile~stress)}$
$f \leq 0.45 f^{\prime} c=0.45 \times 45=20.25 \mathrm{MPa}~\mathrm{(for~compression)}$
Figure 6. Tensile and compression stresses on top of girders due to vehicle live load case along bridge spans length
Figure 7. Tensile and compression stresses on the bottom of girders due to vehicle live load case along bridge spans length
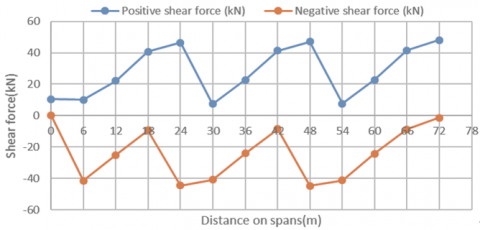
5.3 Positive and negative shear force
The maximum value of positive vertical shear force is 48kN in support between span No. 2 and span No. 3, whereas the minimum value is 7.5 kN within a distance of 30 m of the bridge. However, the higher value of negative vertical shear force is -44 kN in support between span No. 2 and span No. 3, and the lower value is -1.3 kN within end support of span No.3. Figure 8 shows the positive and negative vertical shear force.
Figure 8. The positive and negative shear force of girders due to vehicle live load case along bridge spans length
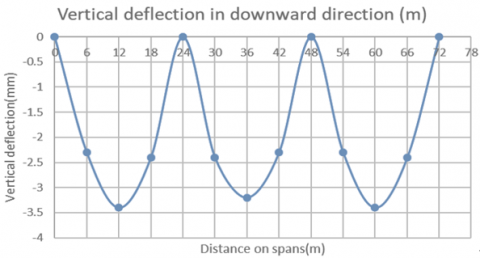
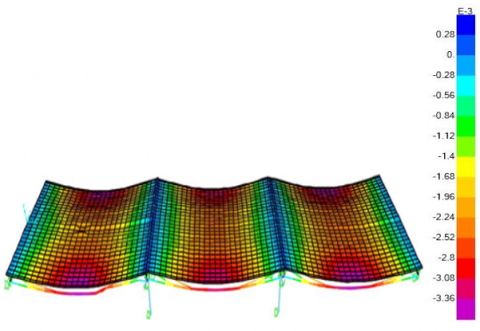
5.4 Vertical deflection
Spans No. 1 and No. 2 give the higher value of vertical deflection in the downward direction, which is equal to -3.4 mm, which is less than the allowable limit value, which is equal to 30 mm. Therefore, this value meets the requirement in AASHTO LRFD. Figure 9 shows the values of vertical deflection along the bridge spans. Figure 10 shows the view of vertical deflection along the bridge spans. The equation of the deflection from (AASHTO LRFD BRIDGE) is:
Def=L/800; Def= 24/800 = 0.03 m= 30 mm
Figure 9. Vertical deflection in a downward direction due to vehicle live load case along bridge spans length
Figure 10. Viewing of vertical deflection in a downward direction due to vehicle live load case along bridge spans length
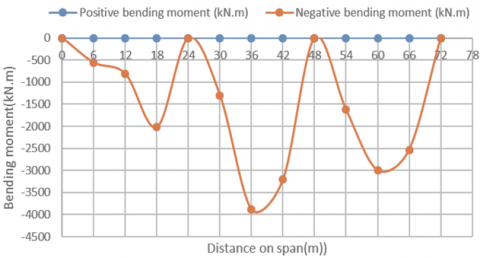
6.1 Positive and negative bending moment
Figure 11 shows both the maximum positive and maximum negative bending moment values that were found in the case of a load combination. It is apparent that positive bending moments are nowhere to be found, but there are negative bending moments across the bridge spans. This goes to show the importance of the prestressed loads in taking up external loads and the dead weight of the structure. The greatest negative bending moment of-3822 kN·m was once in the center of span No. 2. This stops the generation of tensile stresses in the top, and bottom fiber of the girders, and indicates the effectiveness of prestressing in balancing vehicle loads and preventing cracks.
Figure 11. Positive and negative bending moment due to loads combination case along bridge spans length
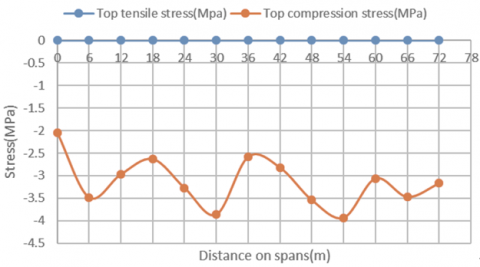
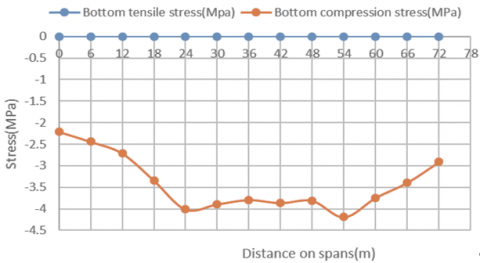
6.2 Tensile and compression stresses
According to the observations carried out by static analysis for the load combination case, there are no tensile stresses present at the top or bottom of the precast prestressed concrete I-girder bridge. This inhibits the formation of any crack in the bridge structure. Compressive stresses do, however, occur in the superstructure of the span of the bridge and the maximum values of these stresses at the top and bottom of the girders are -3.93 MPa and -4.19 MPa respectively. These values are much lower than the limits set for compressive stress of 20.25 MPa. Which ensures the structural integrity of the bridge. Figure 12 shows the tensile and compressive stresses developed concerning the top girders due to the load combination case along the span of the bridge girders while Figure 13 depicts the corresponding stresses at the bottom of the girders.
Figure 12. Tensile and compression stresses on top of girders due to loads combination case along bridge spans length
Figure 13. Tensile and compression stresses on the bottom of girders due to loads combination case along bridge spans length
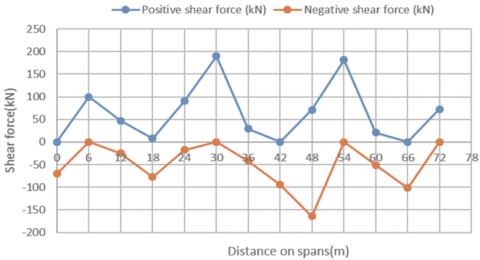
6.3 Positive and negative shear force
Figure 14 lists the magnitudes of positive and negative vertical shear force along the span length of the bridge. It can be seen that the higher value of positive value is 190.16 kN within a distance of 30 m of span No. 2 from the start of the bridge. Whereas, the highest negative vertical shear force is -163.8 kN, occurring at the support between span No. 2 and span No. 3.
Figure 14. The positive and negative shear force of girders due to loads combination case along bridge spans length
6.4 Vertical deflection
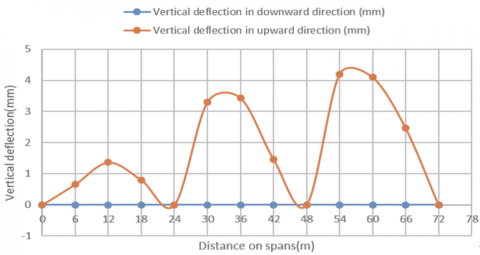
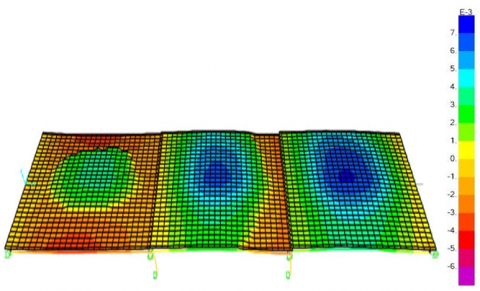
As shown in Figures 15 and 16, and due to the effect of the prestressed load, no downward vertical deflection is observed under the load combination case. All deflection values are directed upward, with the maximum vertical deflection reaching 5.31 mm in the upward direction confirming the efficiency of the design.
Figure 15. Vertical deflection in a downward direction due to loads combination case along bridge spans length
Figure 16. Viewing of vertical deflection in a downward direction due to loads combination case along bridge spans length
In this study, five dynamic responses are adopted under design loads to assess the dynamic structural responses of bridge structures under vehicle live loads with a constant speed of 100km/hr. These responses include natural vibration frequency, vehicle vibration frequency, vehicle dynamic displacement, vehicle dynamic acceleration, and vehicle dynamic velocity.
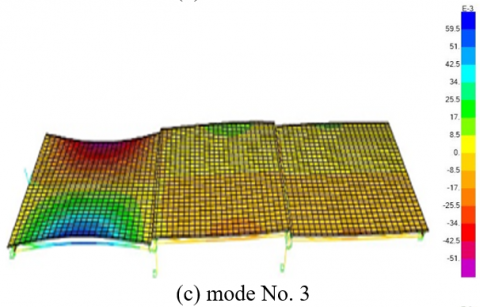
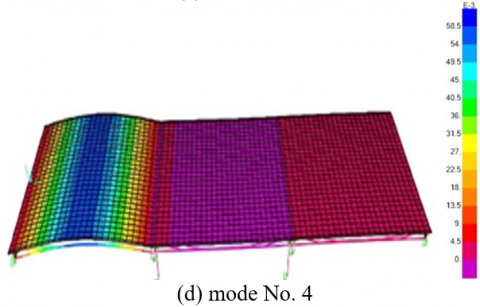
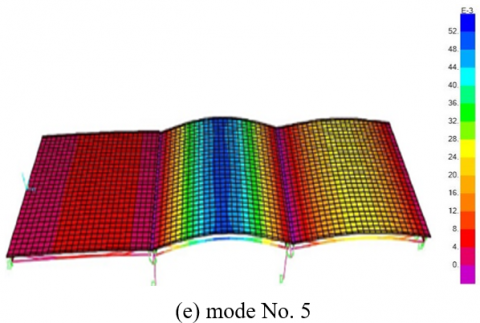
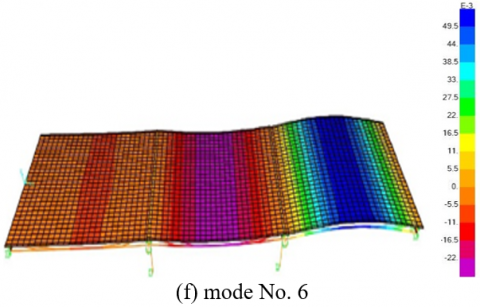
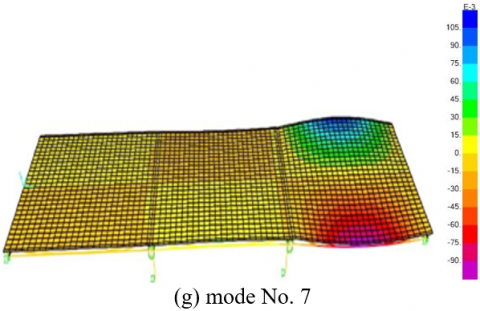
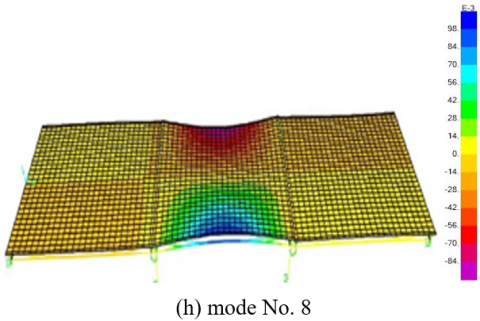
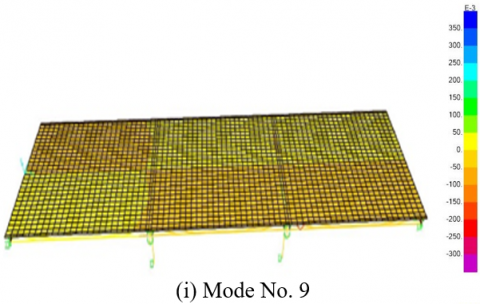
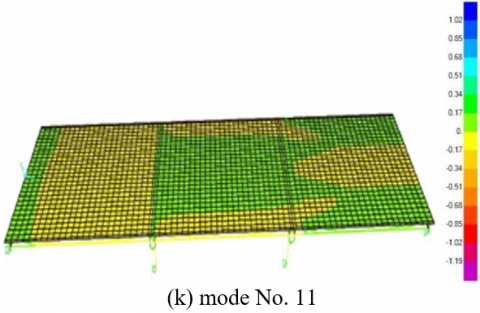
7.1 Modal analysis results of natural frequency
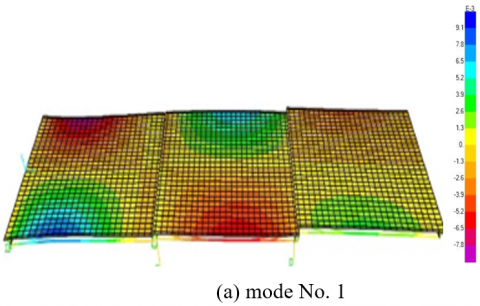
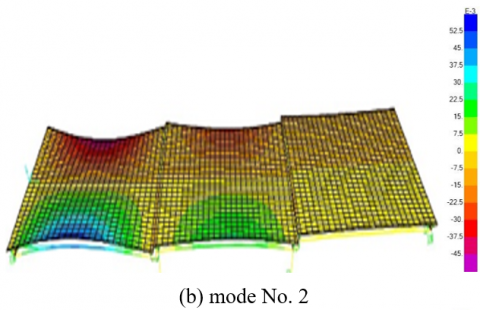
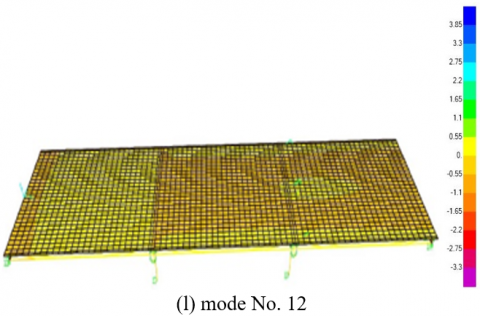
Table 2 lists the values of natural frequencies with time for each mode shape. The average natural frequency is 4.98 Hz. Figure 17 shows the mode's shape with displacement.
Table 2. Natural frequency values, time, and mode number for precast concrete I-girder bridge spans
|
Mode No. |
Natural Frequency (Hz) |
Time (sec) |
|
1 |
2.27 |
0.439 |
|
2 |
3.80 |
0.262 |
|
3 |
4.22 |
0.236 |
|
4 |
4.56 |
0.219 |
|
5 |
4.71 |
0.212 |
|
6 |
4.77 |
0.209 |
|
7 |
5.03 |
0.198 |
|
8 |
5.41 |
0.184 |
|
9 |
6.26 |
0.159 |
|
10 |
6.26 |
0.159 |
|
11 |
6.26 |
0.159 |
|
12 |
6.26 |
0.159 |
|
Average |
4.98 |
|
Figure 17. Modal analysis results for precast concrete I-girder spans under the effect of self-weight of the structure
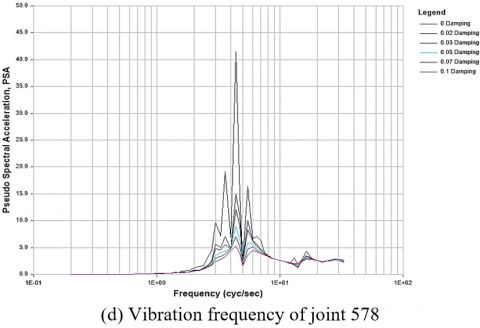
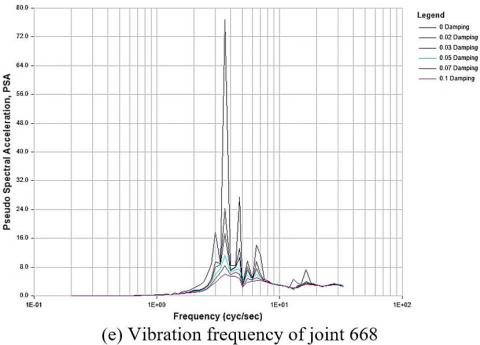
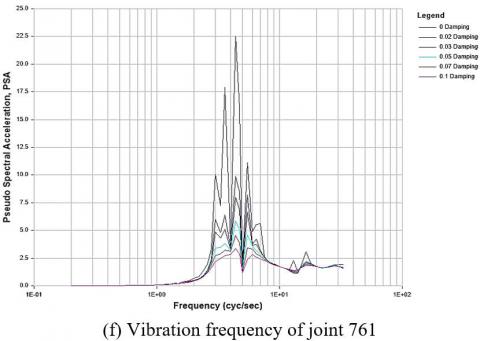
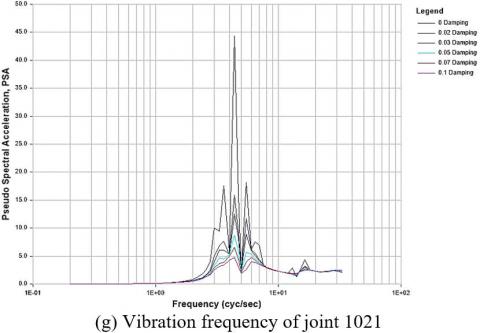
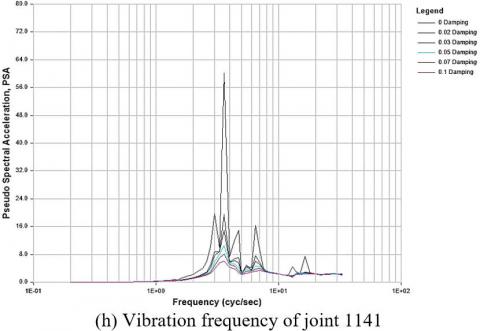
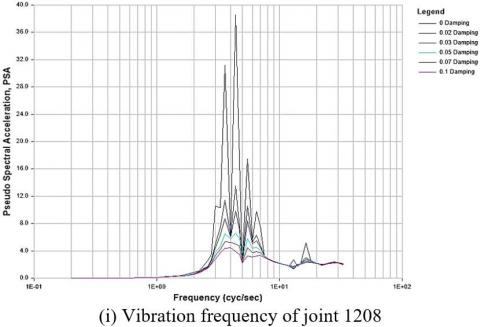
7.2 Dynamic vehicles vibration frequency
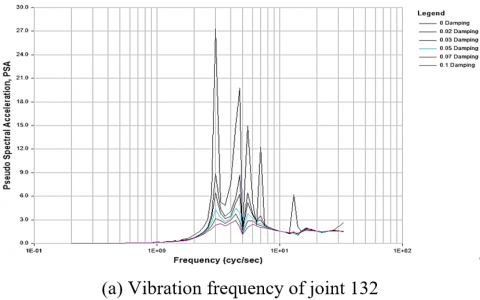
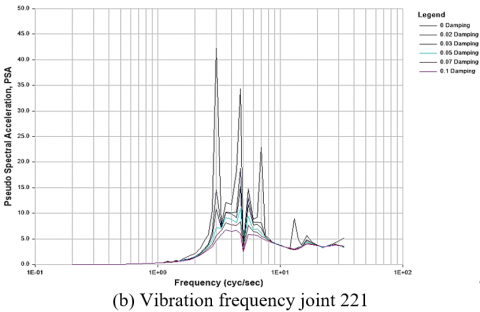
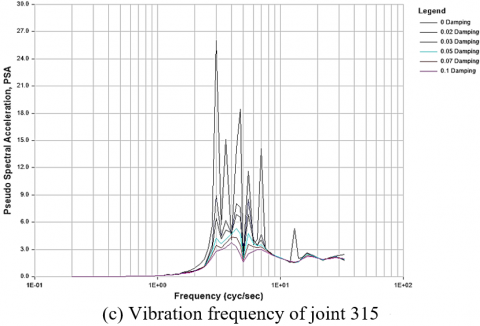
When vehicles cross the bridge spans, a vibration state will appear. Time history analysis results can be shown in Table 3. From this table, the average value of vibration frequency is 3.74 Hz. Compared with the natural frequency, it is lower than 4.98 Hz, indicating the stiffness and elasticity of the bridge span, which prevents resonance and protects the structure from cumulative damage. Figure 18 shows curves of vibration frequency and acceleration.
Table 3. The values of dynamic vibration frequency for precast concrete I-girder spans under the effect of vehicle live load
|
Longitudinal Distance on Spans (m) |
Transverse Distance of Spans (m) |
Joint No. |
Dynamic Vibration Frequency (Hz) |
|
6 |
+4.5 |
132 |
3 |
|
12 |
9 |
221 |
3 |
|
18 |
- 4.5 |
315 |
3 |
|
30 |
+4.5 |
578 |
4.4 |
|
36 |
9 |
668 |
3.6 |
|
42 |
- 4.5 |
761 |
4.4 |
|
54 |
+4.5 |
1021 |
4.4 |
|
60 |
9 |
1114 |
3.6 |
|
66 |
- 4.5 |
1208 |
4.4 |
|
Average |
|
|
3.75 |
Figure 18. The relationship between dynamic vibration frequency and PSA for precast concrete I-girder spans under the effect of vehicle live load
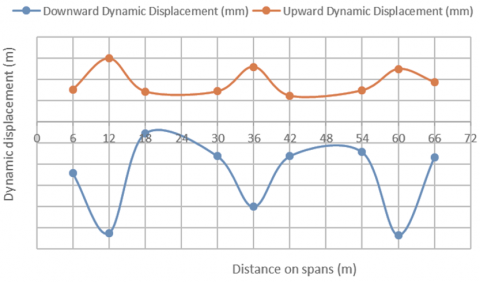
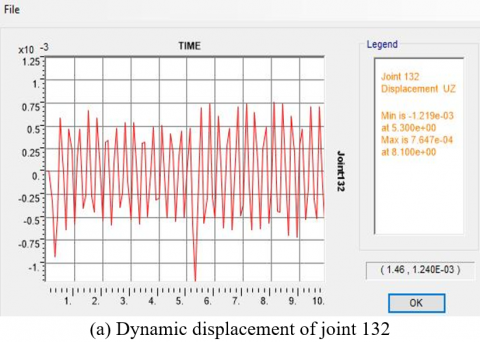
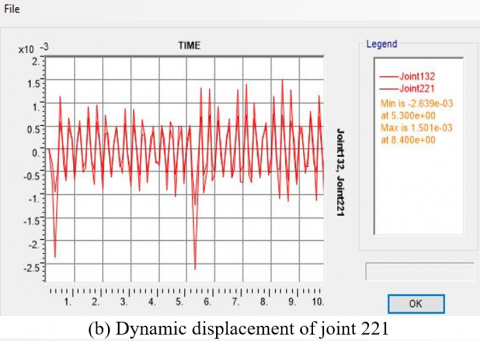
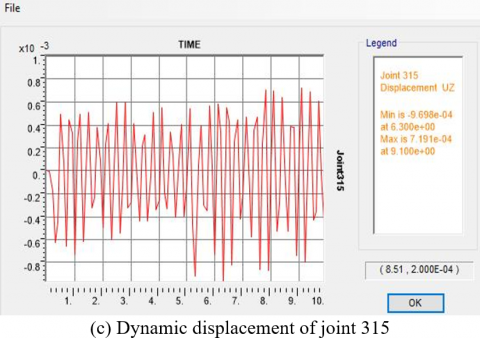
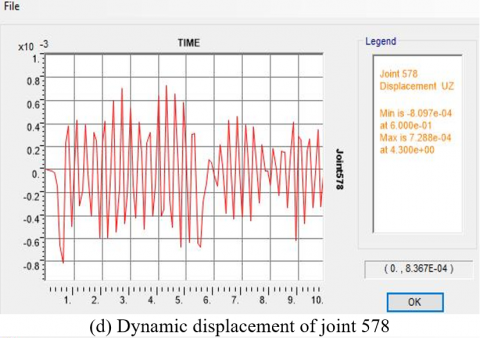
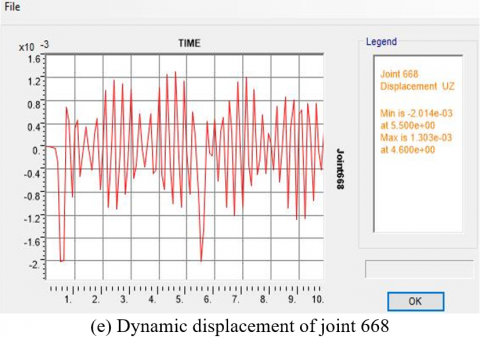
7.3 Dynamic displacement under vehicle load
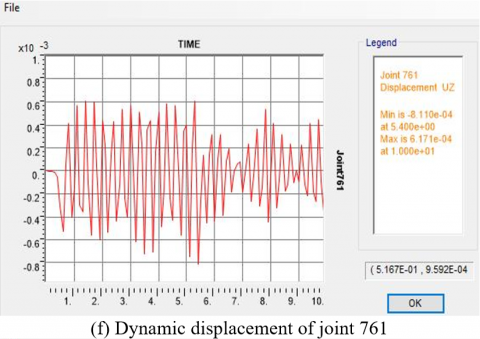
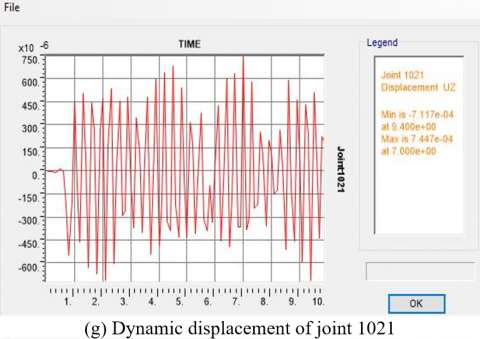
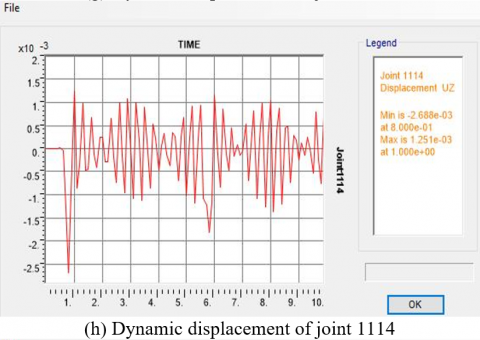
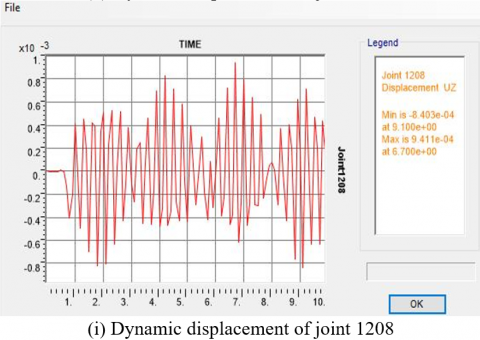
From Figures 19 and 20, it can be observed that the maximum upward vertical dynamic displacement is 1.5 mm in span No. 1, while the minimum value is 0.617 mm. For downward vertical deflection, the highest value occurs in span No. 3 at -2.68 mm, and the lowest value is -0.272 mm.
Figure 19. The values of dynamic displacement for precast concrete I-girder spans under the effect of vehicle live load
Figure 20. Curves of CSI-bridge for dynamic displacement for precast concrete I-girder spans under the effect of vehicle live load
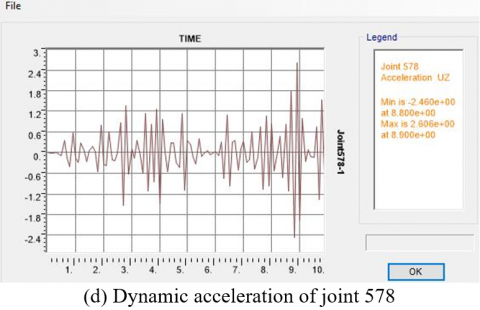
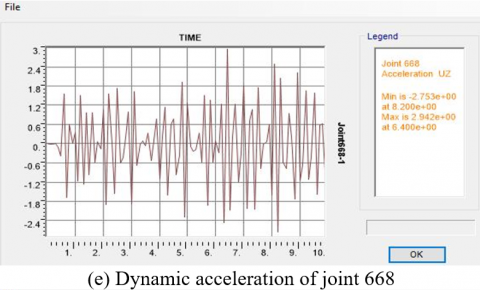
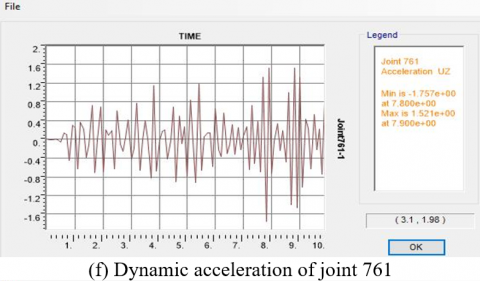
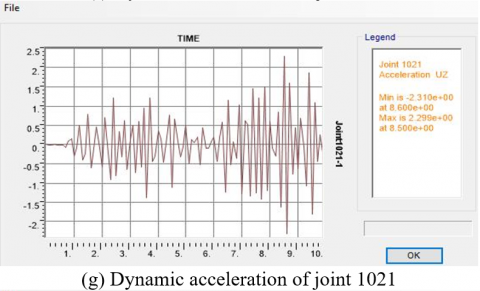
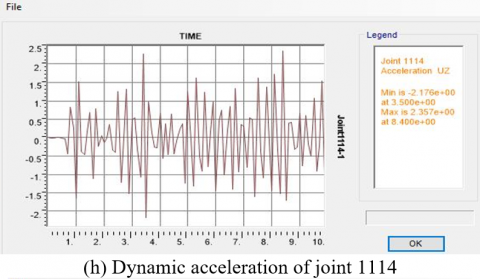
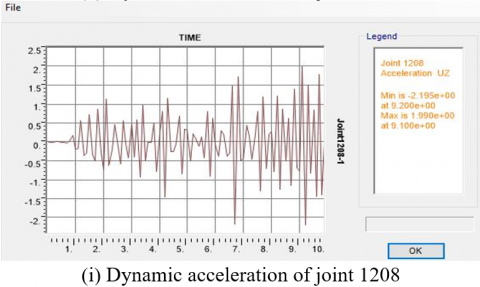
7.4 Dynamic acceleration under vehicle load
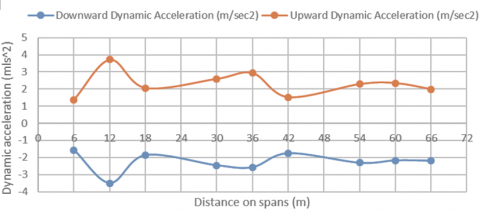
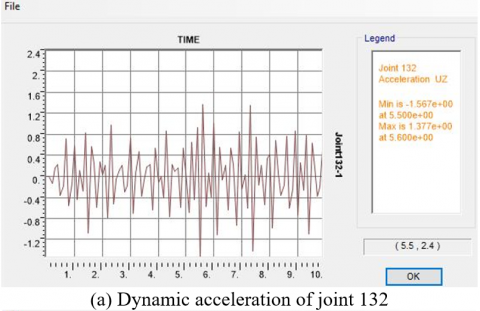
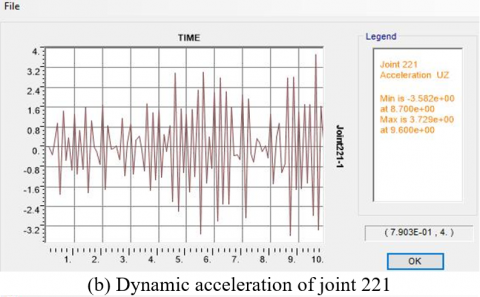
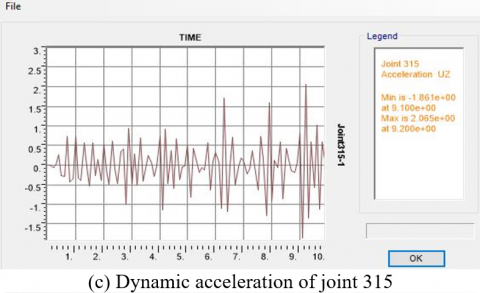
The maximum upward dynamic acceleration due to the vehicle is 3.72 m/s² within span No. 1 at a distance of 12 m from the start of the bridge, and the minimum value is 1.37 m/s², also in span No. 1. The higher value of downward dynamic acceleration is -3.50 m/s², and the minimum value is -1.56 m/s². These values fall within the acceptable limits for passenger comfort according to ISO 2631, as shown in Figure 21 and Figure 22.
Figure 21. Dynamic acceleration values for precast concrete I-girder spans under the effect of vehicle live load
Figure 22. Curves of CSI-bridge for dynamic acceleration for precast concrete I-girder spans under the effect of vehicle live load
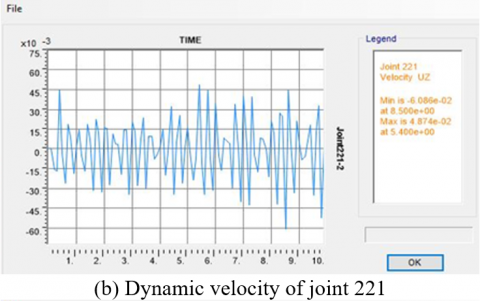
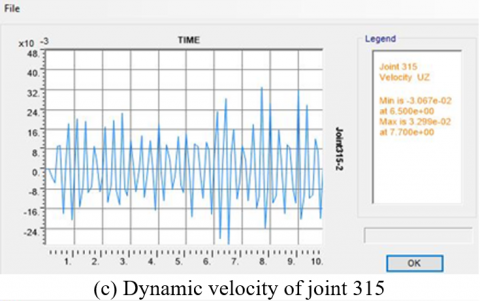
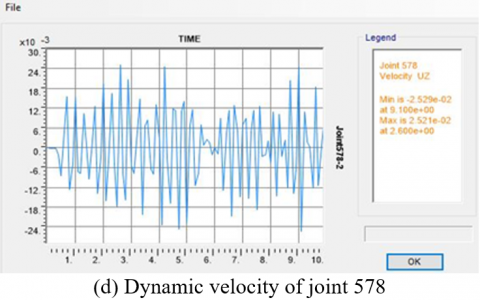
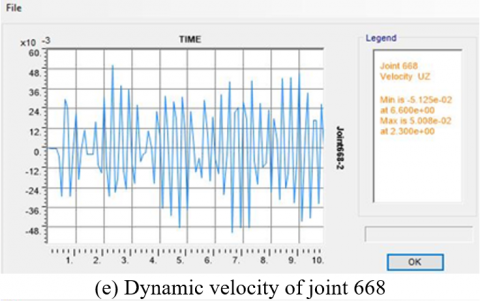
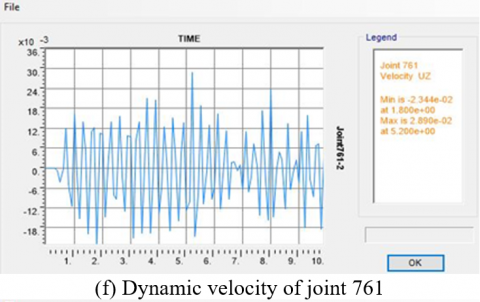
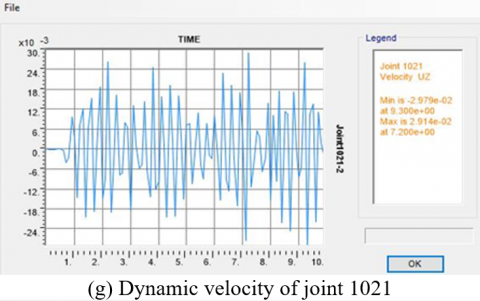
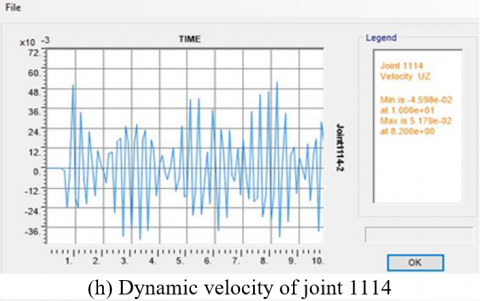
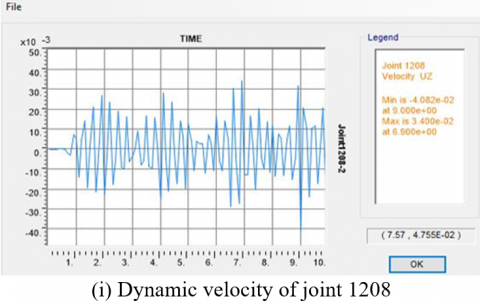
Figure 23. Dynamic velocity values for precast concrete I-girder spans under the effect of vehicle live load
Figure 24. Curves of CSI-bridge for dynamic velocity for precast concrete I-girder spans under the effect of vehicle live load
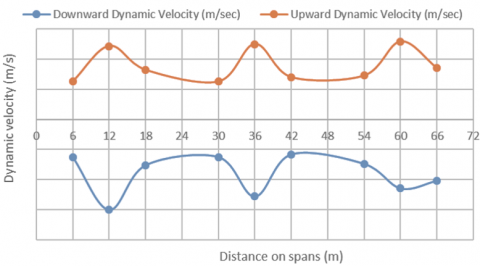
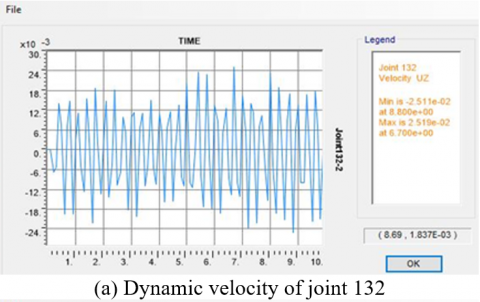
7.5 Dynamic velocity under vehicle load
Figure 23 and Figure 24 show the values of dynamic velocity values. It can be noted that the maximum upward and downward dynamic velocity values are 0.050 m/s and -0.06 m/s respectively. The minimum values are 0.0251 m/s for upward dynamic velocity and -0.0234 m/s for downward dynamic velocity.
Damage investigation and finite element analysis (FEA) of the static and dynamic responses of the prestressed concrete beam spans. The concrete beams, deck, and piers showed no signs of severe cracking, peeling, or corrosion. The expansion joints showed slight corrosion, but this did not affect the structural integrity. The highest negative bending moment (-3822 kNm) at span 2 effectively reduces the tensile stress and prevents crack formation. The maximum tensile and compressive stresses are well below the permissible limits (3.35 MPa and 20.25 MPa, according to AASHTO LRFD). The vertical deflection is within the permissible limits (30 mm), indicating acceptable stiffness. The bridge avoids resonance thanks to its natural frequency of 4.98 Hz, which keeps vehicle-induced vibrations (3.75 Hz) below the natural frequency. This gap is vital to prevent fatigue failure of the tendons. Acceleration within ISO 2631 limits for occupant comfort, the result: the concrete spans do not require repair or reinforcement.
The main conclusions of this research are:
The bridge is in good structural condition with no significant damage and the natural frequency (4.98 Hz) is sufficient to prevent resonance under dynamic loads.
Regularly monitor expansion joints every six months, apply the same methodology to longer-span bridges to generalize the findings, and conduct future studies to assess the impact of earthquakes on prestressed concrete bridges.
[1] Hu, J.H., Deng, Y.J., Jiao, W.J., Yao, Y., Chen, D.G. (2023). Dynamic response and damage assessment of a prestressed T-shaped simply supported girder bridge under contact explosion. Structures, 48: 40-52. https://doi.org/10.1016/j.istruc.2022.12.077
[2] Tu, K., Ye, Y.Y., Wu, D.Q., Zhou, Y.Y., Deng, W.M. (2023). Technical analysis of highway bridge static load test. Journal of Architectural Research and Development. 7(3): 58-63. https://doi.org/10.26689/jard.v7i3.4829
[3] Tiwari, N.P., Pawade, D.P., Dabhekar, K.R. (2017). Dynamic analysis and optimization of pre-stressed concrete t-beam and box girder bridge superstructure. International Journal of Science Technology & Engineering, 3(10): 30-314.
[4] Naser, A.F. (2021). Analysis the effect of super-elevation on static and dynamic properties of horizontal curved concrete bridge by finite element. Journal of Engineering Science and Technology, 16(5): 3669-3686.
[5] Meshrama, S., Ramtekeb, P. (2015). Effect of vehicle velocity on the dynamic amplification factor for a simply supported T-beam bridge. International Journal of Innovative and Emerging Research in Engineering, 2(5): 102-108.
[6] Bridge and Structure Inspection Program Manual. Bridge Type Selection, 2017. Department of Transportation, State of Minnesota.
[7] Agarwal, P., Pal, P., Mehta, P.K. (2022). Box girder bridges-modelling and analysis. Engineering Modelling, 35(1): 19-42. https://doi.org/10.31534/engmod.2022.1.ri.02m
[8] Naser, A.F., Mohammed, H.A., Mohammed, A.A. (2021). Mathematical modeling of linear static and dynamic analysis for pier height effect on the structural performance of bridges structures. Mathematical Modelling of Engineering Problems, 8(4): 617-625. https://doi.org/10.18280/mmep.080415
[9] Mohan, A. (2017). The structural behavior of horizontally curved pre-stressed concrete box girder bridges. Doctoral dissertation, PhD Thesis, School of Computing, Science and Engineering University of Salford, United Kingdom.
[10] Naser, A.F., Mohammed, H.A., Mohammed, A.A. (2022). Flexure and shear load rating evaluation of composite bridge superstructure under effect of different trucks load types. Materials Today: Proceedings, 57: 398-407. https://doi.org/10.1016/j.matpr.2021.12.268
[11] Ramdani, M.A., Widiya, N.P., Susanto, A., Astor, Y. (2020). Design of the prestressed concrete bridge structure on the leuwigajah bridge. Advances in Engineering Research, 198: 149-156. https://doi.org/10.2991/aer.k.201221.026
[12] Arthur, H. (1987). Design of Pre-Stressed Concrete. Wiley, New York, USA. p. 592.
[13] Surbakti, M.E.I., Hariandja, B., Bali, I. (2024). Construction cost reduction in design of prestressed concrete structural system. PRESUNIVE Civil Engineering Journal, 2(2): 59-72. https://doi.org/10.33021/pcej.v2i2.5483
[14] Ryan, T.W., Hartle, R.A., Mann, J.E., Danovich, L.J. (2006). Bridge inspector's reference manual (No. FHWA-NHI-03-001). National Highway Institute (US), pp. 1-6.
[15] Gupta, A.K., Harvesting-pub, R. (2006). Indian railways institute of civil engineering. Pune.
[16] Bianchi, E., Sakib, N., Woolsey, C., Hebdon, M. (2022). Bridge inspection component registration for damage evolution. Structural Health Monitoring, 22(1): 472-495. https://doi.org/10.1177/14759217221083647
[17] Ayad, M., Boumechra, N., Hamdaoui, K. (2023). Damage identification in RC bridges by confronting two approaches: Visual inspection and numerical analysis. Frattura ed Integrità Strutturale, 17(64): 77-92. https://doi.org/10.3221/IGF-ESIS.64.05
[18] Mansoor, Y.A., Awad, H.A. (2019). Improvement of inspection system for damages in reinforced concrete bridge by using knowledge-based system (KBS). In 2019 12th International Conference on Developments in eSystems Engineering (DeSE), Kazan, Russia, pp. 886-889. https://doi.org/10.1109/DeSE.2019.00164
[19] Tirpathi, M., Talawali, L. (2018). Static analysis of bridge structure using finite element analysis software. Mahendra Tirpathi Journal of Engineering Research and Application, 8(6): 70-73. https://doi.org/10.9790/9622-0806017073
[20] Aslam, K. (2010). Structural Analysis. Copyright 2010 Cengage Learning, USA.
[21] Khatri, V., Maiti, P.R., Singh, P.K., Kar, A. (2012). Analysis of skew bridges using computational methods. International Journal of Computational Engineering, 2(3): 628-636.
[22] Tirpathi, M., Talawali, L. (2018). Static analysis of bridge structure using finite element analysis software. Journal of Engineering Research and Application, 8(6): 70-73. https://doi.org/10.9790/9622-0806017073
[23] Subramani, T., Manivannan, R., Kavitha, M. (2014). Crack identification in reinforced concrete beams using ANSYS software. International Journal of Engineering Research and Applications, 4(6): 133-141. https://doi.org/10.1007/s11223-010-9212-6
[24] Qassim, H.J., Mohamad-Ali, A.A. (2020). Dynamic analysis of composite multi I-girders bridge using finite element method. IOP Conference Series: Materials Science and Engineering, 928(2): 022115. https://doi.org/10.1088/1757-899X/928/2/022115
[25] Yang, Y.B., Liao, S.S., Lin, B.H. (1995). Impact formulas for vehicles moving over simple and continuous beams. Journal of Structural Engineering, 121(11): 1644-1650. https://doi.org/10.1061/(ASCE)0733-9445(1995)121:11(1644)
[26] Liu, X., Tao, S.T., Zhao, X.Y., Liu, X., Lu, Z.M., Liu, F.Y. (2024). Dynamic response analysis for bridges subjected to moving vehicle loads by using the analytical dynamic stiffness method. Computers and Structures, 292: 107240. https://doi.org/10.1016/j.compstruc.2023.107240
[27] Muhammed, A., Akin, O.O., Kaura, J.M., Abejide, O.S. (2020). Finite element analysis of reinforced concrete bridge deck subject to vehicular vibrations. International Journal of Bridge Engineering, 8(3): 59-73.
[28] Pisal, A.Y., Jangid, R.S. (2016). Vibration control of bridge subjected to multi-axle vehicle using multiple tuned mass friction dampers. International Journal of Advanced Structural Engineering, 8: 213-227. https://doi.org/10.1007/s40091-016-0124-y
[29] Shao, Y.F., Brownjohn, J.M.W., Miao, C.Q., Wang, M.M. (2021). A precise time-integration linear vehicle-bridge interaction method and dynamic sensitivity analysis. Structures, 33: 4596-4603. https://doi.org/10.1016/j.istruc.2021.07.025