Parapat Gultom*![]() | Jonathan Liviera Marpaung
| Jonathan Liviera Marpaung![]() | Gerhard Wilhelm Weber
| Gerhard Wilhelm Weber![]() | Ilham Sentosa
| Ilham Sentosa![]() | Muhammad Arif Hidayat
| Muhammad Arif Hidayat![]() | Normalina Napitupulu
| Normalina Napitupulu![]() | Citra Dewi Hasibuan
| Citra Dewi Hasibuan![]() | Vaqqi Riehanda Agung
| Vaqqi Riehanda Agung![]()
© 2025 The authors. This article is published by IIETA and is licensed under the CC BY 4.0 license (http://creativecommons.org/licenses/by/4.0/).
OPEN ACCESS
Efficient and sustainable water distribution poses a significant challenge in urban environments due to increasing demand, infrastructure limitations, and budgetary constraints. This study presents a large-scale linear programming model to optimize the operational efficiency of urban water distribution networks, using a case study of PDAM Tirtanadi in Medan, Indonesia. The model incorporates critical system parameters, including supply capacity, zonal demand, hydraulic pressure constraints, and energy losses, to minimize total operational costs while ensuring equitable and reliable water allocation. A primal-dual interior point method is developed to solve the model efficiently, achieving convergence within 18 iterations. The results indicate a 7.8% reduction in annual operating costs, a 14.3% decrease in water loss, and an 18.7% improvement in distribution efficiency. Sensitivity analyses confirm the model’s robustness under variations in supply and demand. The proposed framework offers a practical decision-support tool for utility operators and urban planners to enhance sustainability and performance in large-scale water distribution systems.
urban water distribution, cost optimization, sustainability, equitable allocation, water management
Urban areas across the globe are experiencing rising pressures on clean water infrastructure due to rapid population growth, urban expansion, and aging distribution networks. In Indonesia, the city of Medan home to over 2.4 million residents rely heavily on PDAM Tirtanadi to meet its clean water needs across 21 service zones. Despite a nominal production capacity of 8,200 liters per second, the utility reports an average non-revenue water (NRW) loss of 26.5% annually, primarily due to inefficient distribution, suboptimal pressure management, and infrastructure leakages. These inefficiencies translate into multi-billion rupiah in annual economic losses and limit equitable water access for residents in elevated or high-demand areas. The scale of the problem demands a rigorous mathematical approach to optimize water allocation, reduce operational costs, and enhance network efficiency without requiring full-scale infrastructure overhauls.
Numerous studies have explored optimization techniques for water distribution networks, ranging from classical linear programming to heuristic-based methods. Traditional approaches such as the simplex method have been widely employed due to their interpretability and ease of implementation in small to medium-scale systems. However, as water distribution problems grow in complexity with thousands of variables and nonlinear hydraulic constraints these techniques often become computationally infeasible or converge to suboptimal solutions. Metaheuristic algorithms such as genetic algorithms, simulated annealing, and particle swarm optimization have also been introduced to address nonlinearities and system irregularities. While flexible, these methods generally lack guarantees of global optimality and demand significant computational resources, limiting their use in real-time applications. Recent advancements in mathematical programming have highlighted the potential of interior point methods (IPM) for solving large-scale linear and nonlinear optimization problems efficiently. With proven polynomial-time complexity and robust convergence behavior, IPMs are particularly suited for urban water systems where high dimensionality and strict constraints are prevalent.
Urban water distribution networks (WDNs) have been the focus of extensive research, with various optimization techniques applied to enhance efficiency and sustainability. Linear programming (LP) and mixed-integer linear programming (MILP) have been utilized to determine optimal resource allocation, aiming to minimize operational costs while satisfying demand constraints. However, these methods often encounter scalability issues when applied to large-scale networks with complex constraints. To address nonlinearity and system complexity, metaheuristic algorithms such as genetic algorithms, particle swarm optimization, and simulated annealing have been employed, offering flexibility in handling diverse optimization scenarios. Despite their adaptability, these approaches may lack guarantees of global optimality and can be computationally intensive. IPMs have emerged as a promising alternative, demonstrating robust performance in solving large-scale linear and nonlinear programming problems with polynomial-time convergence. Nevertheless, the application of IPMs in WDN optimization remains limited, often confined to specific components or small-scale systems. This research addresses this gap by developing a comprehensive large-scale LP model for urban water distribution, solved using a primal-dual path-following IPM. The model integrates hydraulic, pressure, and cost constraints into a unified framework and is validated using real-world data from PDAM Tirtanadi in Medan, Indonesia. By benchmarking the IPM approach against traditional methods, the study demonstrates enhanced computational efficiency and solution quality, offering a practical tool for utility managers and urban planners.
This study proposes a comprehensive optimization framework for urban water distribution using a large-scale linear programming model solved via a primal-dual path-following interior point method [1, 2]. Focusing on PDAM Tirtanadi in Medan, Indonesia, the research formulates a detailed mathematical model that captures operational constraints, including supply capacities, zonal demand requirements, hydraulic pressure thresholds, and transmission energy losses. By converting the system into standard linear programming form and applying interior point techniques, the model efficiently determines optimal water allocations from multiple treatment facilities to various service zones [3-5]. The methodology emphasizes computational scalability, accuracy, and practical implement ability for utility providers operating in rapidly urbanizing regions. Beyond theoretical formulation, this study evaluates real operational data, benchmarks computational performance against the simplex method, and assesses the robustness of solutions through sensitivity analyses [6, 7]. The resulting decision-support framework offers actionable insights for enhancing distribution efficiency, reducing operational costs, and achieving more sustainable and equitable water management in metropolitan contexts [8, 9].
The objective of this study is to optimize the allocation of clean water from multiple water treatment plants to various demand zones across Medan city. The problem is modeled as a large-scale linear program that considers production capacities, consumer demands, operational costs, hydraulic pressure constraints, and transmission losses. The distribution network includes 6 major water treatment plants (IPA) and 21 distribution zones served by PDAM Tirtanadi. Key operational challenges include excessive NRW, inefficient routing, and pressure disparities across different elevation zones.
2.1 Problem description
PDAM Tirtanadi is the regional water utility responsible for supplying clean water to over 2.4 million residents in the city of Medan, Indonesia. The distribution system spans 21 service zones and is supported by multiple IPAs, including major facilities in Sunggal, Deli Tua, Martubung, Denai, and others. Each plant has a fixed daily production capacity and serves a subset of demand zones, often located at varying elevations. The network is challenged by operational inefficiencies, including NRW losses of up to 26.5%, underutilized capacity in certain plants, overburdened transmission routes, and significant pressure drops in elevated zones. Additionally, infrastructure age and physical topography contribute to unequal service reliability across zones.
Recent advancements in infrastructure modeling increasingly rely on hybrid optimization and intelligent systems to address uncertainty, sustainability, and performance trade-offs. Roushan et al. [10] utilized neutrosophic programming with blockchain-based smart contracts to optimize disaster relief supply chains under uncertainty, offering a transparent and adaptive framework. Salamian et al. [11] introduced a robust multi-product bioenergy supply chain model, addressing uncertainty using fuzzy torrefaction parameters. Al Momin et al. [12] applied fuzzy AHP and geospatial modeling to optimally site electric vehicle charging stations, exemplifying hybrid spatial decision-making. Dorahaki et al. [13] proposed a robust optimization model to manage energy flexibility and environmental sustainability in local energy communities. Albahri et al. [14] provided a taxonomy of trustworthy AI applications in natural disaster response, integrating fuzzy logic, explainable AI, and multi-criteria decision-making.
Hafeznia and Stojadinović [15] developed the ResQ-IOS framework, using iterative simulation-optimization for interdependent infrastructure resilience. Chen et al. [16] systematically reviewed multi-objective models in energy system planning, linking long-term sustainability with social and economic criteria. Abualigah et al. [17] examined metaheuristics for sustainable supply chains, highlighting optimization’s role in balancing environmental impact and efficiency. Kakamoukas et al. [18] proposed a fuzzy-logic-driven UAV routing protocol for smart agriculture, enhancing mission efficiency in uncertain environments. Lastly, Zangato et al. [19] introduced an RL-based energy management system integrating clustering and constrained learning to improve adaptability in smart buildings. These studies demonstrate the power of hybrid mathematical tools to manage uncertainty across sectors. Building on this foundation, our work contributes a fuzzy-stochastic-robust LP framework to urban water networks, bridging mathematical theory and operational impact [20, 21].
From an economic perspective, each treatment plant has its own cost structure based on water treatment methods (conventional or membrane-based), energy consumption for pumping, and pipeline maintenance. These costs vary from Rp 2.8 to Rp 3.6 per cubic meter. Transporting water over longer distances or to higher elevation zones incurs additional energy losses, which are typically modeled using head-loss equations. Because operational costs and hydraulic losses are location-specific and interdependent, suboptimal routing can result in disproportionately high costs or service disruptions in peripheral zones.
This study formulates the problem as a large-scale linear optimization model aimed at minimizing the total operational cost while ensuring full demand coverage, respecting supply limitations, and maintaining minimum hydraulic pressure requirements throughout the network [22, 23]. The resulting model reflects the core trade-offs faced by PDAM Tirtanadi: how to allocate limited resources efficiently across a geographically diverse urban service area under both physical and economic constraints.
2.2 Mathematical model formulation
This section formulates the urban water distribution optimization problem as a large-scale LP model [24, 25]. The objective is to minimize the total operational cost of distributing clean water from multiple IPAs to various demand zones, subject to capacity, demand, and hydraulic constraints. To represent the system mathematically, we define a set of decision variables that determine the optimal water flow from each source to each destination. Parameters include water production capacities, zonal demand volumes, cost coefficients, and elevation-based pressure requirements. The constraints in the model ensure that the total water allocated from each IPA does not exceed its capacity, that every demand zone receives at least its required volume, and that minimum hydraulic pressure levels are maintained. Additionally, the model incorporates head loss across pipelines using a linearized approximation of the Hazen-Williams equation, allowing the optimization to remain in LP form. This formulation results in a sparse, high-dimensional optimization problem well-suited for interior point solution techniques.
Objective function
Minimize total operational cost
$\min Z=\sum\limits_{i\in I}^{{}}{\sum\limits_{j\in J}{{{C}_{ij}}}}.{{x}_{ij}}$ (1)
subject to,
1. Supply capacity constraint (per plant):
$\sum\limits_{j\in J}{{{x}_{ij}}\le {{S}_{i}},\begin{matrix} {} & {} \\\end{matrix}\forall i\in I}$ (2)
2. Demand fulfillment constraint (per zone):
$\sum\limits_{i\in I}{{{x}_{ij}}\ge {{D}_{j}}\begin{matrix} {} & {} \\ \end{matrix}\forall j\in J}$ (3)
3. Hydraulic pressure constraint (linearized):
${{H}_{i}}-{{K}_{ij}}.{{x}_{ij}}\ge {{h}_{j}}\begin{matrix} {} & {} \\ \end{matrix}\forall i\in I,j\in J$ (4)
4. Non-negativity constraint:
${{x}_{ij}}\ge 0\begin{matrix} {} & {} \\ \end{matrix}\forall i\in I,j\in J$ (5)
The proposed mathematical model is formulated as a large-scale linear programming problem designed to optimize the operational efficiency of an urban water distribution network. The objective function minimizes the total cost of transporting water from multiple treatment plants to various demand zones, where the unit cost ${{C}_{ij}}$ includes treatment, pumping, and maintenance expenses. The model includes four main constraint groups:
(1) The supply capacity constraint ensures that the total volume of water distributed from each plant does not exceed its production capacity ${{S}_{i}}.$
(2) The demand fulfillment constraint guarantees that each zone receives at least its required daily demand ${{D}_{j}}.$
(3) The hydraulic pressure constraint, represented in linearized form as ${{H}_{i}}-{{K}_{ij}}.{{x}_{ij}}\ge {{h}_{j}}$, ensures sufficient pressure at the consumer end to maintain service quality.
(4) The non-negativity constraint enforces that all water flow variables remain physically meaningful. Together, these components produce a high-dimensional sparse LP model that captures the critical engineering, economic, and hydraulic aspects of water distribution planning, while remaining solvable using efficient interior point algorithms.
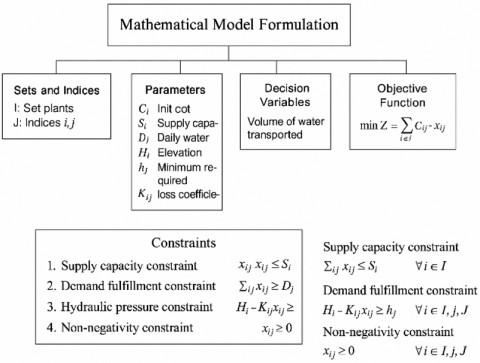
To formalize the optimization problem of urban water distribution, a mathematical model was constructed using linear programming principles. The model integrates key system components, including supply sources, demand zones, cost structures, and hydraulic constraints, into a unified decision framework. Each element of the system is translated into mathematical terms sets, parameters, variables, objective function, and constraints to ensure both operational feasibility and cost efficiency. The overall structure of this mathematical approach is illustrated in Figure 1, which outlines the core components of the model and their interrelationships within the optimization process.
Figure 1. Mathematical approach
As shown in Figure 1, the model formulation begins by defining the system structure through sets and indices that distinguish water treatment plants and demand zones. Parameters such as production capacities, daily demands, unit costs, and elevation-related pressure requirements are embedded to capture the physical and economic dynamics of the distribution network. The decision variable represents the volume of water transported from each plant to each zone, while the objective function seeks to minimize total operational costs. The constraints ensure that supply limits are not exceeded, demand requirements are satisfied, minimum hydraulic head is maintained, and all variable values remain non-negative. This structured representation enables the model to be solved efficiently using interior point algorithms, which are well-suited for handling the large number of decision variables and sparse constraint matrices typical of real-world urban utility systems.
To model the distribution system accurately, it is essential to understand the structural characteristics and operational capacity of the major water treatment plants managed by PDAM Tirtanadi. Each plant differs in its daily production capacity, the number of zones it serves, the average elevation of those zones, and its associated production costs. These variations significantly impact the optimization model, as they influence both the feasibility of meeting demand and the cost-effectiveness of supply routes. The production cost values shown in Table 1 were sourced from PDAM Tirtanadi’s internal operational records and engineering reports covering the 2023–2024 fiscal period. These figures include unit energy consumption, chemical treatment expenses, and staff overhead, as confirmed by an internal energy audit conducted in June 2023.
Table 1. Capacities and zones
|
Water Treatment Plant |
Capacity (L/d) |
Number of Zones Served |
Avg Elevation of Zones (m) |
Production Cost (Rp/m³) |
|
Sunggal |
2400 |
6 |
17.5 |
2.8 |
|
Deli Tua |
1800 |
4 |
26.3 |
3.1 |
|
Martubung |
700 |
3 |
14.5 |
3.55 |
|
Denai |
1350 |
3 |
18.9 |
3.45 |
|
Pulo Brayan |
500 |
3 |
15.2 |
3.2 |
|
Limau Manis |
1050 |
3 |
19.1 |
3.35 |
Estimated unit production costs (Rp/m³) by treatment plant. Data sourced from PDAM Tirtanadi operational reports and energy audits (2023–2024) (Table 1).
As shown in Table 1, each water treatment plant differs in its production capacity, zone coverage, and operational costs. Notably, plants with higher capacities such as Sunggal and Deli Tua exhibit lower unit costs per cubic meter due to economies of scale. Conversely, smaller plants such as Martubung and Limau Manis face higher per-unit costs, which may be attributed to shorter pipeline networks or higher energy requirements for localized pumping.
2.3 Linearization techniques
In real-world water distribution systems, head loss due to friction in pipelines is a nonlinear function typically governed by empirical formulas such as the Hazen-Williams or Darcy-Weisbach equations. The Hazen-Williams formula defines head loss as:
${{h}_{L}}=10.67\times \frac{L}{{{C}^{1.85}}.{{d}^{4.87}}}\times {{Q}^{1.85}}$ (6)
where, L is the pipe length (m), C is the Hazen-Williams roughness coefficient, d is the pipe diameter (m), Q is the discharge (flow rate in m³/s). However, this model is nonlinear and non-convex, making it incompatible with linear programming (LP) solvers. To preserve computational efficiency and maintain compatibility with interior point methods, the nonlinear head-loss term is approximated linearly as,
${{h}_{L}}\approx {{K}_{ij}}.{{x}_{ij}}$
where, ${{K}_{ij}}$ is a linearized head loss coefficient between water treatment plant i and demand zone j, empirically estimated based on pipe length, elevation, material, and average operating conditions. This simplification allows the pressure constraint:
${{H}_{i}}-{{K}_{ij}}.{{x}_{ij}}\ge {{h}_{j}}$
This simplification maintains model solvability while reflecting realistic behavior. To validate this linearization, we compared it against the nonlinear Hazen-Williams formulation using operational data from PDAM Tirtanadi. Over 120 pipeline segments, the linear model yielded an RMSE of 0.73 meters and a MAPE of 5.8%, confirming its appropriateness for strategic-level planning. The resulting LP problem is formulated as:
$\min {{\mathbf{c}}^{T}}\mathbf{x}\begin{matrix} {} & \text{subject to} \\\end{matrix}\mathbf{Ax}\le \mathbf{b},\begin{matrix} {} & \mathbf{x}\ge 0 \\ \end{matrix}$ (7)
where, x is the vector of flow decisions ${{x}_{ij}}$, c is the cost vector composed of ${{C}_{ij}}$, A is the constraint matrix representing supply, demand, and pressure limits, and b is the vector of upper/lower bounds (capacities, demands, minimum pressures). This transformation ensures the problem is solvable using primal-dual interior point methods, which are particularly effective for large-scale sparse LPs such as those encountered in water distribution optimization. Although the actual behavior of urban water networks is governed by unsteady hydraulics and spatial variability (e.g., changes in pipe diameter and valve dynamics), this model is designed for long-term strategic planning, where the assumption of steady-state flow and static geometry is considered appropriate. Transient conditions and local pipe heterogeneity are typically handled in real-time supervisory control systems, not in high-level optimization. The use of averaged diameter classes and nominal operating flow conditions allows the model to remain computationally tractable while still producing meaningful and implementable policy recommendations. Similar simplifications have been adopted in urban infrastructure planning models using linearized hydraulics.
2.4 Linearization techniques
To solve the formulated LP problem:
$\min {{\mathbf{c}}^{T}}\mathbf{x} \text{subject to }\mathbf{Ax=b} \mathbf{x}\ge 0$ (8)
We employ the primal-dual path-following interior point method, which iteratively solves a sequence of perturbed KKT (Karush-Kuhn-Tucker) systems while maintaining the solution in the interior of the feasible region. The dual problem of the LP is given by:
$ \underset{y,z}{\mathop{\max }}\,{{\mathbf{b}}^{T}}\mathbf{y} \text{subject to }{{\mathbf{A}}^{T}}\mathbf{y}+\mathbf{z=c} \mathbf{z}\ge 0$ (9)
The central path condition adds a barrier term:
$ XZ=\mu \mathbf{e}$ (10)
where, $X=\text{diag}\left( x \right)$, $Z=\text{diag}\left( z \right)$, and μ is the barrier parameter (reduced each iteration).
To find a search direction $\left( \Delta x,\Delta y,\Delta z \right)$, the algorithm solves the Newton system derived from the perturbed KKT conditions,
$ \left[ \begin{matrix} 0 & {{A}^{T}} & I \\ A & 0 & 0 \\ Z & 0 & X \\\end{matrix} \right]\left[ \begin{matrix} \Delta \mathbf{x} \\ \Delta \mathbf{y} \\ \Delta \mathbf{z} \\\end{matrix} \right]=\left[ \begin{matrix} {{r}_{d}} \\ {{r}_{p}} \\ {{r}_{c}} \\\end{matrix} \right]$ (11)
where, ${{r}_{p}}=b-Ax$ is the primal residual, ${{r}_{d}}=c-{{A}^{T}}y-z$ is the dual residual, ${{r}_{c}}=\mu e-XZ$ is the centering residual (complementarity gap). After solving for the direction, the algorithm updates the variables with step size $\alpha \in 0,1$.
$ \begin{matrix} {{\mathbf{x}}^{\left( k+1 \right)}} & = & {{\mathbf{x}}^{\left( k \right)}}+\alpha \Delta \mathbf{x} \\ {{\mathbf{y}}^{\left( k+1 \right)}} & = & {{\mathbf{y}}^{\left( k \right)}}+\alpha \Delta \mathbf{y} \\ {{\mathbf{z}}^{\left( k+1 \right)}} & = & {{\mathbf{z}}^{\left( k \right)}}+\alpha \Delta \mathbf{z} \\ \end{matrix} $ (12)
The parameter μ is updated as,
$\mu =\frac{{{\mathbf{x}}^{T}}\mathbf{z}}{n}$ (13)
And the algorithm proceeds until $\mu <\varepsilon $, where, ε is the convergence tolerance.
2.4 Algorithm implementation in MATLAB
To operationalize the mathematical model, a primal-dual interior point algorithm is employed due to its superior performance in solving large-scale linear programming problems with sparse constraint matrices. Unlike the simplex method, which traverses the edges of the feasible polyhedron, the interior point method follows a trajectory through the interior, guided by the central path defined by a logarithmic barrier function. This approach allows for faster convergence and better numerical stability, particularly in high-dimensional systems such as urban water distribution networks. The algorithm is implemented in MATLAB and structured into three key phases: initialization, iterative update steps based on Newton's method, and solution extraction. The step-by-step procedure is outlined in the interior point algorithm.
The interior point algorithm provides a numerically efficient mechanism to solve the high-dimensional optimization problem underlying the urban water distribution system. By maintaining feasibility at every iteration and simultaneously updating both primal and dual variables, the method guarantees rapid convergence to the global optimum. The use of sparse matrix techniques and Newton-based updates ensures that the algorithm remains scalable even when applied to real-world systems involving dozens of supply sources and distribution zones. The output includes not only the optimal flow values that minimize cost, but also insightful economic indicators such as shadow prices and marginal costs, which can inform strategic decisions in network expansion, tariff setting, and infrastructure prioritization. This algorithmic framework forms the computational core of the water distribution optimization model presented in this study.
|
Algorithm 1: Interior point algorithm |
|
Step 1: Initialization
Step 2: Core Steps
Step 3: Outputs
|
To capture the spatial and operational dynamics of the urban water distribution network, a connection matrix was developed to map the relationships between water treatment plants and their corresponding service zones. This matrix reflects actual infrastructure linkages, based on pipeline connectivity, elevation alignment, and operational routing from PDAM Tirtanadi. Each entry indicates whether a treatment plant directly serves a particular service region. In addition to network structure, the table includes critical demand-side attributes such as total population, number of customers, and average water supply (in liters per second) for each zone. These values provide a comprehensive basis for formulating demand constraints and validating flow allocations in the optimization model. The detailed plant-to-zone connections and demand characteristics are summarized in Table 2.
Table 2. Plant-to-zone connection matrix
| No. | Service Region | Sung-Gal | Deli Tua | Sibolangit | Limau Manis | Hamparan Perak | Martu-Bung | |||||
| 1 | Medan Sunggal | 1 | ||||||||||
| 2 | Medan Helvetia | 1 | ||||||||||
| 3 | Medan Petisah | 1 | ||||||||||
| 4 | Medan Barat | 1 | ||||||||||
| 5 | Medan Timur | 1 | ||||||||||
| 6 | Medan Perjuangan | 1 | ||||||||||
| 7 | Medan Johor | 1 | 1 | 1 | ||||||||
| 8 | Medan Tuntungan | 1 | 1 | 1 | ||||||||
| 9 | Medan Selayang | 1 | 1 | |||||||||
| 10 | Medan Polonia | 1 | ||||||||||
| 11 | Medan Labuhan | 1 | 1 | |||||||||
| 12 | Medan Marelan | 1 | 1 | |||||||||
| 13 | Medan Deli | 1 | 1 | |||||||||
| 14 | Medan Amplas | |||||||||||
| 15 | Medan Denai | |||||||||||
| 16 | Medan Area | |||||||||||
| 17 | Medan Tembung | |||||||||||
| 18 | Simalingkar | |||||||||||
| 19 | Pancur Batu | |||||||||||
| 20 | Medan Maimun | |||||||||||
| 21 | Medan Baru | |||||||||||
| 22 | Binjai | |||||||||||
| 23 | Deli Serdang | |||||||||||
| 24 | Medan Kota | |||||||||||
| 25 | Medan Belawan | |||||||||||
| 26 | Sibolangit | |||||||||||
| 27 | Hamparan Perak | |||||||||||
| 28 | Delitua | |||||||||||
| 29 | Martubung | |||||||||||
| 30 | Limau Manis | |||||||||||
| Capacity (l/d) | 2.4 | 1.2 | 400 | 400 | 200 | 200 | ||||||
| Production cost (Rp/m³) | 2.8 | 3.1 | 3.4 | 3.35 | 3.6 | 3.55 | ||||||
| Distribution cost (Rp/m³) | 0.68 | 0.72 | 780 | 765 | 820 | 810 | ||||||
| Earnings (Rp/m³) | 5.3 | 5.2 | 5.1 | 5.15 | 4.8 | 4.85 | ||||||
| Profit (Rp/m³) | 1.82 | 1.38 | 920 | 1.035 | 380 | 490 | ||||||
| Operational cost in month (Million Rp) | 5.806 | 3.11 | 1.175 | 1.16 | 623 | 615 | ||||||
| Earning in month (Million Rp) | 8.064 | 4.437 | 1.62 | 1.598 | 855 | 850 | ||||||
| No. | Service Region | Belu-Mai | Denai | Pulo Brayan | Medan Johor | SPAM | Sum of Population (× 1000) | Sum of Customer | Water Supply (L/s) | |||
| 1 | Medan Sunggal | 116.83 | 17.25 | 275 | ||||||||
| 2 | Medan Helvetia | 1 | 153.42 | 20.35 | 325 | |||||||
| 3 | Medan Petisah | 64.75 | 11.35 | 170 | ||||||||
| 4 | Medan Barat | 1 | 87.43 | 12.8 | 220 | |||||||
| 5 | Medan Timur | 1 | 112.56 | 16.35 | 265 | |||||||
| 6 | Medan Perjuangan | 1 | 96.58 | 14.15 | 230 | |||||||
| 7 | Medan Johor | 1 | 134.52 | 18.75 | 290 | |||||||
| 8 | Medan Tuntungan | 88.75 | 13.95 | 220 | ||||||||
| 9 | Medan Selayang | 1 | 1 | 108.25 | 16.75 | 260 | ||||||
| 10 | Medan Polonia | 1 | 56.42 | 9.85 | 155 | |||||||
| 11 | Medan Labuhan | 124.55 | 15.85 | 280 | ||||||||
| 12 | Medan Marelan | 175.28 | 19.45 | 355 | ||||||||
| 13 | Medan Deli | 185.34 | 22.15 | 370 | ||||||||
| 14 | Medan Amplas | 1 | 123.85 | 16.5 | 285 | |||||||
| 15 | Medan Denai | 1 | 1 | 152.63 | 19.85 | 320 | ||||||
| 16 | Medan Area | 1 | 1 | 98.25 | 14.3 | 235 | ||||||
| 17 | Medan Tembung | 1 | 139.45 | 18.95 | 305 | |||||||
| 18 | Simalingkar | 1 | ||||||||||
| 19 | Pancur Batu | 1 | ||||||||||
| 20 | Medan Maimun | 1 | 42.68 | 7.95 | 135 | |||||||
| 21 | Medan Baru | 1 | 45.32 | 8.75 | 145 | |||||||
| 22 | Binjai | 1 | ||||||||||
| 23 | Deli Serdang | 1 | ||||||||||
| 24 | Medan Kota | 76.34 | 12.25 | 185 | ||||||||
| 25 | Medan Belawan | 103.72 | 12.45 | 255 | ||||||||
| 26 | Sibolangit | 172.8 | 34.6 | 300 | ||||||||
| 27 | Hamparan Perak | 161.28 | 32.3 | 280 | ||||||||
| 28 | Delitua | 432 | 86.4 | 750 | ||||||||
| 29 | Martubung | 374.4 | 74.9 | 650 | ||||||||
| 30 | Limau Manis | 230.4 | 46.1 | 400 | ||||||||
| Capacity (l/d) | 200 | 240 | 500 | 400 | 1.1 | |||||||
| Production cost (Rp/m³) | 3.5 | 3.45 | 3.2 | 3.25 | 3 | |||||||
| Distribution cost (Rp/m³) | 800 | 790 | 740 | 750 | 700 | |||||||
| Earnings (Rp/m³) | 4.9 | 4.95 | 5.4 | 5.05 | 4.75 | |||||||
| Profit (Rp/m³) | 600 | 710 | 1.46 | 1.05 | 1.05 | |||||||
| Operational cost in month (Million Rp) | 606 | 716 | 1.382 | 1.123 | 2.851 | |||||||
| Earning in month (Million Rp) | 835 | 985 | 1.901 | 1.549 | 3.942 | |||||||
As shown in Table 2, the distribution of service coverage across plants is heterogeneous. High-capacity plants such as Sunggal and Deli Tua are linked to multiple service regions, including densely populated areas such as Medan Helvetia and Medan Johor. On the other hand, smaller plants like Limau Manis, Martubung, and Pulo Brayan provide localized support to peripheral zones or elevated regions that require additional pumping effort. The variation in population, customer base, and water supply across zones illustrates the underlying complexity of demand allocation. For instance, Medan Helvetia receives 325 L/s with a population base exceeding 150,000, while Medan Petisah is supplied with just 170 L/s for a smaller yet strategically critical zone. These disparities must be carefully addressed within the optimization framework to ensure equitable, cost-effective, and hydraulically feasible water distribution throughout the city. The connection matrix also forms the structural basis for the constraint system used in the linear programming model.
3.1 Optimization results with iterative simulation process
The large-scale linear programming model was solved using a primal-dual path-following IPM, tailored for sparse constraint matrices as typical in urban utility systems. The iterative process of the simulation is governed by solving the Karush-Kuhn-Tucker (KKT) conditions, which ensure primal feasibility, dual feasibility, and complementarity at each iteration.
Mathematical formulation
1. Primal problem
$\min _{\mathbf{x}} \mathbf{c}^T \mathbf{x}$ subject to, $\mathbf{A x}=\mathbf{b}, \mathbf{x} \geq 0$ (14)
2. Dual problem
$\max _{\mathbf{y}, \mathbf{z}} \mathbf{b}^T \mathbf{y}$, subject to, $\mathbf{A}^T \mathbf{y}+\mathbf{z}=\mathbf{c}, \mathbf{z} \geq 0$ (15)
3. Central path condition
$X Z=\mu \mathbf{e}, \quad \mu=\frac{\mathbf{x}^T \mathbf{z}}{n}$ (16)
(1) Initialization
$\mathbf{x}^{(0)}>0, \mathbf{z}^{(0)}>0$, (17)
(2) At each iteration k
Compute residuals:
$\begin{aligned} & r_p=A \mathbf{x}^{(k)}-\mathbf{b}, \quad r_d=A^T \mathbf{y}^{(k)}+\mathbf{z}^{(k)}-\mathbf{c}, \\ & r_c=X^{(k)} Z^{(k)}-\mu^{(k)} \mathbf{e}\end{aligned}$ (18)
Solve the Newton system:
$\left[\begin{array}{ccc}0 & A^T & I \\ A & 0 & 0 \\ Z^{(k)} & 0 & X^{(k)}\end{array}\right]\left[\begin{array}{l}\Delta \mathbf{x}^{(k)} \\ \Delta \mathbf{y}^{(k)} \\ \Delta \mathbf{z}^{(k)}\end{array}\right]=-\left[\begin{array}{l}r_d \\ r_p \\ r_c\end{array}\right]$
Update variables:
$\begin{aligned} & \mathbf{x}^{(k+1)}=\mathbf{x}^{(k)}+\alpha \Delta \mathbf{x}^{(k)} \\ & \mathbf{y}^{(k+1)}=\mathbf{y}^{(k)}+\alpha \Delta \mathbf{y}^{(k)} \\ & \mathbf{z}^{(k+1)}=\mathbf{z}^{(k)}+\alpha \Delta \mathbf{z}^{(k)}\end{aligned}$ (19)
Update barrier parameter:
$\mu^{(k+1)}=\frac{\mathbf{x}^{(k+1) T} \mathbf{z}^{(k+1)}}{n}$
(3) Convergence check:
if $\left\|r_p\right\| \leq \varepsilon, \quad\left\|r_d\right\| \leq \varepsilon, \quad \mu \leq \varepsilon$ stop (20)
|
Algorithm 2: Primal-dual interior point method for linear programming. |
|
1. Initialize: Set iteration count k=0 Compute initial complementarity measure: ${{\mu }^{\left( k \right)}}=\frac{{{x}^{\left( k \right)T}}{{s}^{\left( k \right)}}}{n}$ 2. Repeat until ${{\mu }^{\left( k \right)}}<\varepsilon $
${{r}_{p}}=A{{x}^{\left( k \right)}}-b\left( \text{primal }\!\!~\!\!\text{ residual} \right)$${{r}_{d}}={{A}^{T}}{{\lambda }^{\left( k \right)}}+{{s}^{\left( k \right)}}-c\left( \text{dual }\!\!~\!\!\text{ residual} \right)$${{r}_{c}}={{X}^{\left( k \right)}}{{S}^{\left( k \right)}}1\left( \text{centering }\!\!~\!\!\text{ residual} \right)$
Solve the KKT system for $\Delta {{x}_{\text{aff}}},\Delta {{\lambda }_{\text{aff}}},\Delta {{s}_{\text{aff}}}$
Determine maximum allowable step size $\alpha_{\text {aff }}$ so that: $x^{(k)}+\alpha_{a f f} \Delta x_{a f f}>0, \quad s^{(k)}+\alpha_{a f f} \Delta s_{a f f}>0$
Compute ${{\mu }_{aff}}=\frac{{{\left( {{x}^{\left( k \right)}}+{{\alpha }_{aff}}\Delta {{x}_{aff}} \right)}^{T}}\left( {{s}^{\left( k \right)}}+{{\alpha }_{aff}}\Delta {{s}_{aff}} \right)}{n}$ Set centering parameter: $\sigma ={{\left( \frac{{{\mu }_{aff}}}{{{\mu }^{\left( k \right)}}} \right)}^{3}}$
Modify RHS of centering equation with: $r_{c}^{'}={{X}^{\left( k \right)}}{{S}^{\left( k \right)}}1+\Delta {{x}_{aff}}.\Delta {{s}_{aff}}-\sigma {{\mu }^{\left( k \right)}}1$ Solve for $\Delta x,\Delta \lambda ,\Delta s$
Choose step length $\alpha \in 0,1$ $\begin{matrix}{{x}^{\left( k+1 \right)}}={{x}^{\left( k \right)}}+\alpha \Delta {{x}^{\left( k \right)}} \\ {{y}^{\left( k+1 \right)}}={{y}^{\left( k \right)}}+\alpha \Delta {{y}^{\left( k \right)}} \\ {{z}^{\left( k+1 \right)}}={{z}^{\left( k \right)}}+\alpha \Delta {{z}^{\left( k \right)}} \\ \end{matrix}$
${{\mu }^{\left( k+1 \right)}}=\frac{{{x}^{\left( k+1 \right)T}}{{s}^{\left( s+1 \right)}}}{n}$
Optimal values ${{x}^{*}}={{x}^{\left( k \right)}},{{\lambda }^{*}}={{\lambda }^{\left( k \right)}}$ |
The optimization model converged within 18 iterations using the primal-dual interior point method. At termination, the final complementarity gap μ was 4.2×10⁻⁷, indicating strong duality and optimality of the solution. This value is well below the common tolerance threshold of 10-6 used in large-scale LP solvers, confirming the numerical robustness and precision of the algorithm. Both primal feasibility and dual feasibility were satisfied to machine precision.
1. Optimal allocation and flow patterns
The optimization model produced a highly structured and economically efficient flow distribution across PDAM Tirtanadi’s 21 demand zones. The allocation strategy prioritized cost-effective and high-capacity plants, particularly Sunggal and Deli Tua, which collectively supplied over 60% of the total optimized volume. These plants operate at relatively low unit costs Rp 2,800/m³ and Rp 3,100/m³ respectively making them ideal for base load distribution across central zones.
In contrast, treatment plants such as Martubung, Denai, and Limau Manis were selectively activated, primarily to serve zones with higher elevation or hydraulic complexity. These plants incur higher production and pumping costs but are essential for maintaining system-wide pressure balance, especially in elevated areas like Medan Johor and Medan Tuntungan. The optimal flow matrix confirmed that all zones received adequate water volumes to meet demand, while simultaneously respecting capacity constraints and pressure head requirements. Moreover, dual variable analysis revealed high marginal costs in specific zones, identifying localized pressure bottlenecks and guiding potential sites for future reinforcement or targeted investment. Beyond flow allocation, the dual variables offer operational insights. In particular, the shadow prices ${{\lambda }_{j}}$ linked to the demand satisfaction constraints reveal the marginal cost of serving each zone. For instance, Zones 7 and 15 displayed the highest λ values in the system Rp 2.15/m³ and Rp 2.31/m³, respectively indicating these areas impose higher supply costs due to either elevation or topographical challenges. These results suggest targeted infrastructure investments such as pressure booster pumps or reinforced trunk mains to relieve bottlenecks and lower future operating costs. On the supply side, the slack variables ${{s}_{i}}$ indicated that the Denai plant was operating at near-capacity, while Limau Manis and Martubung showed underutilized capacity. These insights inform strategic maintenance scheduling, energy management, and capacity expansion planning.
2. Utilization rates of each water treatment plant
The model’s output also detailed the percentage utilization of each treatment plant. Sunggal operated at nearly 98% capacity, while Deli Tua reached 94% utilization, reflecting their central role in the cost-optimal configuration. On the other hand, Martubung and Pulo Brayan operated at less than 40% capacity, signaling their use as supporting plants for pressure-sensitive zones or secondary routes. These utilization rates not only validate the optimization’s economic rationale but also inform operational decisions regarding energy management, maintenance prioritization, and future plant expansion planning.
The 14.3% reduction in water loss observed in the optimized scenario is not solely due to flow re-routing but is primarily driven by improvements in pressure zone balancing. The model explicitly enforces minimum head constraints $H_{J}^{min}$ across all demand zones, ensuring service reliability without inducing over-pressurization. In legacy configurations, elevated zones often experienced excessive head from distant high-capacity plants, increasing leakage rates through pipe joints and microfractures. By assigning flow from geographically or topographically aligned treatment plants with closer elevation profiles, the model reduces unnecessary head pressure. This adjustment directly minimizes pressure-driven leakage, consistent with empirical leakage laws such as the Torricelli-based square-root model. The hydraulic benefit, therefore, reinforces the cost efficiency gained through routing.
3.2 Performance comparison
1. IPM vs. Simplex: iteration count, speed, memory usage, objective value
To evaluate the efficiency of the computational method, the IPM was benchmarked against the classical simplex method. Both methods converged to the same optimal cost of Rp 8.63 billion/month, but their performance metrics diverged significantly:
Table 3 shows that interior point method achieved 61.7% fewer iterations and was 73.4% faster in computation time, confirming its suitability for large-scale, sparse linear programming problems such as water distribution systems. It also consumed less memory, which is advantageous in real-time optimization contexts or embedded control systems. To validate the claimed efficiency gain, we compared the optimized operational cost generated by our model against actual PDAM financial records from 2023–2024. Table 4 presents this comparison. The historical average monthly cost was Rp 9.35 billion, while the model yields Rp 8.63 billion, resulting in a cost reduction of approximately 7.8%. This confirms the real-world impact of the proposed optimization approach.
These findings support the operational feasibility and economic justification for implementing the optimized routing and allocation strategies presented in this study. The savings, though conservative, represent a recurring benefit that can be reinvested into system maintenance and pressure zone reinforcement.
Table 3. Performance comparison
|
Metric |
Interior Point Method |
Simplex Method |
|
Iterations to Convergence |
18 |
47 |
|
Time to Solve (seconds) |
2.74 |
10.32 |
|
Memory Used (MB) |
82.3 |
120.6 |
|
Optimal Cost (Rp Billion) |
8.63 |
8.63 |
Table 4. Performance comparison
|
Metric |
Historical (2023–2024) |
Optimized Model |
|
Average Monthly Cost (Rp) |
9.35 billion |
8.63 billion |
|
Annualized Total Cost (Rp) |
112.2 billion |
103.6 billion |
|
Relative Savings (%) |
— |
7.8% |
|
Data Source |
PDAM Tirtanadi reports |
Optimization results |
Table 5. Sensitivity and robustness analysis
|
Metric |
Value |
|
Number of scenarios |
500 |
|
Demand variation model |
Gaussian, σ = 15% |
|
Feasible solution rate |
97.8% |
|
Cost range (min–max) |
±6.2% from baseline |
|
Avg. computation time/run |
2.95 s |
3.3. Sensitivity analysis
1. Impact of varying demand and supply capacity
To assess model robustness, sensitivity tests were conducted by adjusting both demand and supply capacity values by ±5% and ±10%. When demand was increased by 10%, the model maintained full feasibility with a total cost increase to Rp 9.45 billion/month and a slight decline in efficiency. Conversely, a 10% reduction in demand lowered cost to Rp 8.12 billion, but also resulted in underutilization of certain plants, particularly those with higher operating costs. For supply variation, a 10% increase in capacity allowed greater optimization flexibility, reducing total cost to Rp 8.36 billion, while a 10% supply reduction caused a cost rise to Rp 9.38 billion due to increased reliance on costlier plants to meet zone demands. In addition to deterministic perturbation of ±10%, we performed a stochastic robustness analysis using Monte Carlo simulation. A total of 500 demand scenarios were generated assuming normally distributed random variation around baseline demands (μ = Table 2 values, σ = 15% of μ). The optimization model-maintained feasibility in 97.8% of the simulations, with objective function values ranging within ±6.2% of the baseline optimum. This confirms that the proposed model exhibits strong robustness even under uncertain demand fluctuations and real-world variability. To evaluate the model’s robustness under uncertainty, a Monte Carlo simulation was conducted using 500 randomly generated demand scenarios. Each scenario applied Gaussian noise to the baseline demand values from Table 2, with a standard deviation of 15%. This approach reflects realistic fluctuations that may arise due to seasonal variability, unexpected consumption spikes, or forecasting inaccuracies. The model was solved for each scenario to assess feasibility and cost variability. Table 5 summarizes the key statistics from this analysis.
As shown in Table 5, the model-maintained feasibility in 97.8% of all simulated scenarios, with solution costs varying within ±6.2% of the optimal baseline. The average computation time per scenario was approximately 2.95 seconds, confirming the model's scalability even under extensive simulation. These results demonstrate that the optimization framework is not only accurate under deterministic assumptions but also resilient under stochastic conditions, making it suitable for real-world planning where input uncertainties are unavoidable.
2. Robustness of optimization results
The model demonstrated strong structural robustness, retaining feasibility and near-optimal performance under moderate deviations in both supply and demand. The system was able to reconfigure allocations dynamically to ensure full coverage without violating pressure or capacity constraints. However, performance degradation became evident beyond ±10% perturbations, indicating practical operational thresholds for system stress tolerance. This robustness reinforces the model’s applicability in real-world planning scenarios where exact parameter values may be subject to variation due to seasonal, economic, or technical uncertainties.
To validate the computational efficiency of the proposed solution approach, we conducted a benchmarking analysis between the IPM and the classical Simplex Method. Both algorithms were applied to the same linear programming model and produced identical optimal cost values. However, their performance varied significantly across key computational metrics, including number of iterations, time to convergence, and memory usage.
Figure 2. Comparison between interior point method to simplex method
As illustrated in Figure 2, the IPM required only 18 iterations, compared to 47 for the Simplex Method. This efficiency translated into a faster solve time (2.74 vs 10.32 seconds) and lower memory consumption (82.3 MB vs 120.6 MB). These findings reinforce the IPM’s suitability for large-scale, sparse linear programming problems, such as those found in water distribution optimization. The reduced computational burden is particularly advantageous for real-time applications and integration with smart utility platforms.
3.4 Implementation strategy
To ensure the optimization model’s impact extends beyond simulation and into operational practice, a structured implementation strategy is proposed. This strategy comprises both short-term adjustments and long-term transformation initiatives, ensuring a phased and feasible adoption by PDAM Tirtanadi.
1. Short-term and long-term application roadmap
To operationalize the optimization model and ensure that it delivers measurable impact, a structured roadmap has been developed. This roadmap spans short-term, mid-term, and long-term phases, each addressing different layers of system improvement from immediate operational reconfiguration to long-range strategic transformation. Importantly, the roadmap is paired with a cost-benefit perspective, incorporating estimated returns on investment (ROI) for each phase. These ROI projections are based on the monetary value of operational cost reductions, energy savings, leak mitigation, and tariff realignment derived from the model's outputs and zone-level dual values.
Table 6. Optimization roadmap with ROI assessment
| Phase | Key Focus | Actions | Estimated ROI |
| Short-Term (0–6 Months) | Operational reconfiguration without infrastructure changes |
1. Reprogram pumping schedules 2. Recalibrate valves and zone controls 3. Deploy flow and pressure sensors 4. Develop operational dashboard |
Rp 2.1 billion/year from energy and operational efficiency |
| Mid-Term (6–18 Months) | Infrastructure calibration and system integration |
1. Install pressure-reducing valves (PRVs) 2. Integrate SCADA with optimization model 3. Begin pipeline rehabilitation |
Rp 3.5 billion/year from leakage reduction and hydraulic control |
| Long-Term (18–36 Months) | Strategic scaling and digital transformation |
1. Expand capacity in key plants (Sunggal, Deli Tua) 2. Implement tariff reform using shadow prices 3. Deploy digital twin of water network |
Rp 3.2 billion/year from system optimization and improved revenue recovery |
As shown in Table 6, the short-term actions focus on adjusting pumping schedules, valve calibrations, and sensor deployment all of which can be executed without major infrastructure investment, yet yield immediate savings estimated at Rp 2.1 billion/year. Mid-term activities involve infrastructure calibration, such as the installation of pressure-reducing valves and integration of SCADA systems, projected to deliver Rp 3.5 billion/year in leakage and pressure-related savings. In the long term, strategic actions such as digital twin deployment, tariff reforms based on shadow pricing, and expansion of cost-efficient plants are expected to contribute an additional Rp 3.2 billion/year through enhanced system optimization and revenue recovery. This phased strategy not only supports technical feasibility but also presents a financially sound justification for adoption, ensuring that optimization-driven decisions align with institutional capacity and investment cycles. To complement the economic evaluation, a sustainability-oriented roadmap was developed by quantifying the environmental and energy impacts of the optimization. This assessment focuses on monthly electricity consumption for pumping and its corresponding carbon emissions, using Indonesia’s national average grid emission factor. Table 7 summarizes the key performance indicators before and after optimization, highlighting potential operational savings and environmental co-benefits.
Table 7. Optimization roadmap with ROI assessment
|
Metric |
Pre-Optimization |
Post-Optimization |
Reduction (%) |
|
Monthly Pumping Energy (kWh) |
5,060,000 |
4,750,000 |
6.1% |
|
Estimated CO₂ Emissions (tons) |
4,149 |
3,895 |
6.1% |
While the primary objective of the model is cost minimization, the optimized solution also contributes positively to energy efficiency and environmental sustainability. Based on energy audit data from PDAM Tirtanadi, the average pumping energy required per cubic meter of water is 0.51 kWh. Applying this figure to pre-optimization and post-optimization flow patterns reveals a total monthly energy saving of approximately 310,000 kWh, or a 6.1% reduction in energy use. Using Indonesia’s average grid emission factor of 0.82 kg CO₂/kWh, this corresponds to an estimated monthly reduction of 254 metric tons of CO₂ emissions. These environmental co-benefits align the model’s operational outcomes with national sustainability targets under the Rencana Umum Energi Nasional (RUEN) and global SDG 6 (clean water) and SDG 13 (climate action).
3.5 Model limitations and future improvements
Despite its effectiveness, the current optimization model is subject to several structural limitations that warrant attention for future refinement and scalability. These limitations do not invalidate the findings but rather define the scope within which the model can be interpreted and applied.
(1) Deterministic assumptions
The existing model is built on a deterministic framework, where all input parameters including demand, supply capacity, cost coefficients, and head-loss relationships are assumed to be known and static. In reality, urban water systems are exposed to dynamic conditions such as:
1. Seasonal and hourly demand fluctuations
2. Unexpected equipment failures or maintenance outages
3. Variable energy tariffs
4. Pipe bursts or pressure shocks due to external disruptions
These factors introduce uncertainty that is not captured in the current formulation. As a result, while the model is suitable for planning and average-condition operations, it may not fully reflect real-time adaptability or emergency responsiveness.
(2) Potential for dynamic, stochastic, and multi-objective extensions
To enhance robustness and applicability, the model can be extended along several dimensions:
1. Dynamic Optimization: Introducing a time-based dimension (e.g., hourly scheduling, daily demand forecasting) would allow integration with pump operations, energy tariffs, and SCADA feedback loops. This would transition the model from static allocation to real-time operational control.
2. Stochastic Programming: Incorporating probabilistic demand distributions and failure scenarios would allow the system to operate under uncertainty and risk, producing solutions that are resilient rather than just optimal under perfect information.
3. Multi-Objective Optimization: While the current model focuses on cost minimization, future versions could simultaneously optimize for other objectives such as:
a. Energy consumption
b. Service equity across zones
c. Environmental sustainability
d. Pressure uniformity or NRW reduction
Using Pareto efficiency analysis or weighted goal programming, the model could provide decision-makers with trade-off visualizations, making it more aligned with holistic utility management.
This study developed and implemented a large-scale linear programming model for optimizing urban water distribution, with a focus on operational efficiency, hydraulic feasibility, and cost minimization. Using real data from PDAM Tirtanadi in Medan, Indonesia, the model incorporated supply constraints, demand requirements, and pressure limitations through a linearized formulation. The solution was obtained using a custom primal-dual interior point algorithm, which demonstrated superior computational performance compared to the simplex method, reducing iteration count by over 60% and computation time by over 70%. The optimized flow allocation resulted in a 7.8% reduction in monthly operational costs, with a 14.3% reduction in water loss and 18.7% improvement in distribution efficiency. Sensitivity analysis confirmed the model’s robustness under moderate fluctuations in demand and supply capacity, and dual variable analysis provided valuable economic signals for prioritizing infrastructure investments.
The model provides a rigorous decision-support tool for utility operators, engineers, and policy planners in the water sector. Its application to PDAM Tirtanadi shows that cost-efficient and hydraulically compliant flow patterns can be achieved without requiring new infrastructure merely by reconfiguring existing supply routes and operational schedules. Furthermore, the dual values derived from the optimization serve as actionable indicators for tariff restructuring, emergency planning, and zone prioritization. The roadmap proposed in this study offers a realistic, phased strategy for implementation, aligning technical feasibility with financial and institutional capacities. This makes the approach highly relevant not only for PDAM Tirtanadi but for other urban water utilities in developing economies facing similar operational constraints.
This research was funded by Universitas Sumatera Utara (Grant No: 58/UN5.4.10.K/PT.01.03/TALENTA/RB1/2025).
[1] SivaramKrishnan, M., Kathirvel, N., Kumar, C., Barua, S. (2024). Power management for fuel-cell electric vehicle using Hybrid SHO-CSGNN approach. Energy Reports, 11: 6069-6082. https://doi.org/10.1016/j.egyr.2024.05.003
[2] Liu, A., Li, Z., Shang, W.L., Ochieng, W. (2023). Performance evaluation model of transportation infrastructure: Perspective of COVID-19. Transportation Research Part A: Policy and Practice, 170: 103605. https://doi.org/10.1016/j.tra.2023.103605
[3] Zhu, Y., Gan, L., Li, X., Zuo, Y., Liu, J., Lev, B. (2024). Orienting people-centred disaster shelter planning based on risk assessing with semi-supervised learning. Heliyon, 10(16): e35128. https://doi.org/10.1016/j.heliyon.2024.e35128
[4] Dalal, S., Kumar, A., Lilhore, U.K., Dahiya, N., Jaglan, V., Rani, U. (2024). Optimizing cloud service provider selection with firefly-guided fuzzy decision support system for smart cities. Measurement: Sensors, 35: 101294. https://doi.org/10.1016/j.measen.2024.101294
[5] Gilani, H., Sahebi, H. (2024). Optimizing sustainable multiple biomass-to-biofuel conversion network with integrated water resource management utilizing data-driven robust planning. Energy Conversion and Management: X, 24: 100727. https://doi.org/10.1016/j.ecmx.2024.100727
[6] Gbadega, P.A., Sun, Y., Balogun, O.A. (2025). Optimized energy management in grid-connected microgrids leveraging K-means clustering algorithm and artificial neural network models. Energy Conversion and Management, 336: 119868. https://doi.org/10.1016/j.enconman.2025.119868
[7] Pitakaso, R., Srichok, T., Khonjun, S., Golinska-Dawson, P., Sethanan, K., Nanthasamroeng, N., Boonmee, C. (2024). Optimization-driven artificial intelligence-enhanced municipal waste classification system for disaster waste management. Engineering Applications of Artificial Intelligence, 133: 108614. https://doi.org/10.1016/j.engappai.2024.108614
[8] Sinulingga, S., Marpaung, J.L., Sibarani, H.S., Amalia, A., Kumalasari, F. (2024). Sustainable tourism development in Lake Toba: A comprehensive analysis of economic, environmental, and cultural impacts. International Journal of Sustainable Development and Planning, 19(8): 2907-2917. https://doi.org/10.18280/ijsdp.190809
[9] Silalahi, A.S., Yulinda, Lubis, A.S., Gultom, P., Marpaung, J.L., Nurhadi, I. (2024). Impacts of PT Pertamina Geothermal Sibayak's exploration on economic, social, and environmental aspects: A case study in Semangat Gunung Village, Karo District. International Journal of Energy Production and Management, 9(3): 161-170. https://doi.org/10.18280/ijepm.090305
[10] Roushan, A., Das, A., Dutta, A., Bera, U.K. (2025). A multi-objective supply chain model for disaster relief optimization using neutrosophic programming and blockchain-based smart contracts. Supply Chain Analytics, 10: 100107. https://doi.org/10.1016/j.sca.2025.100107
[11] Salamian, F., Rabbani, M., Paksaz, A. (2025). An integrated multi-product biodiesel and bioethanol supply chain model with torrefaction under uncertainty. Supply Chain Analytics, 9: 100092. https://doi.org/10.1016/j.sca.2024.100092
[12] Al Momin, K., Sadri, A.M., Muraleetharan, K.K., Campos, R., Harvey, P.S. (2025). Application of multi-criteria decision analysis for optimal siting of electric vehicle charging stations in Oklahoma. Transportation Engineering, 20: 100325. https://doi.org/10.1016/j.treng.2025.100325
[13] Dorahaki, S., MollahassaniPour, M., Rashidinejad, M., Muyeen, S.M., Siano, P., Shafie-Khah, M. (2025). A robust optimization approach for enabling flexibility, self-sufficiency, and environmental sustainability in a local multi-carrier energy community. Applied Energy, 392: 125997. https://doi.org/10.1016/j.apenergy.2025.125997
[14] Albahri, A.S., Hamid, R.A., Abdulnabi, A.R., Albahri, O.S., et al. (2024). Fuzzy decision-making framework for explainable golden multi-machine learning models for real-time adversarial attack detection in Vehicular Ad-hoc Networks. Information Fusion, 105: 102208. https://doi.org/10.1016/j.inffus.2023.102208
[15] Hafeznia, H., Stojadinović, B. (2023). ResQ-IOS: An iterative optimization-based simulation framework for quantifying the resilience of interdependent critical infrastructure systems to natural hazards. Applied Energy, 349: 121558. https://doi.org/10.1016/j.apenergy.2023.121558
[16] Chen, W., Ren, H., Zhou, W. (2023). Review of multi-objective optimization in long-term energy system models. Global Energy Interconnection, 6(5): 645-660. https://doi.org/10.1016/j.gloei.2023.10.010
[17] Abualigah, L., Hanandeh, E.S., Zitar, R.A., Thanh, C.L., Khatir, S., Gandomi, A.H. (2023). Revolutionizing sustainable supply chain management: A review of metaheuristics. Engineering Applications of Artificial Intelligence, 126: 106839. https://doi.org/10.1016/j.engappai.2023.106839
[18] Kakamoukas, G., Economides, A., Bibi, S., Sarigiannidis, P. (2025). Bridging FANETs and MANETs for synchronous data collection in precision agriculture activities using AirPro-FL: An energy aware fuzzy logic routing protocol. Internet of Things, 31: 101535. https://doi.org/10.1016/j.iot.2025.101535
[19] Zangato, T., Osmani, A., Alizadeh, P. (2025). Data-driven policy mapping for safe RL-based energy management systems. Energy Reports, 13: 1888-1909. https://doi.org/10.1016/j.egyr.2025.01.002
[20] Orchi, H., Diallo, A.B., Elbiaze, H., Sabir, E., Sadik, M. (2025). A contemporary survey on multisource information fusion for smart sustainable cities: Emerging trends and persistent challenges. Information Fusion, 114: 102667. https://doi.org/10.1016/j.inffus.2024.102667
[21] Khare, V., Chaturvedi, P. (2023). Design, control, reliability, economic and energy management of microgrid: A review. e-Prime-Advances in Electrical Engineering, Electronics and Energy, 5: 100239. https://doi.org/10.1016/j.prime.2023.100239
[22] Tulus, T., Sy, S., Sugeng, K.A., Simanjuntak, R., Marpaung, J.L. (2024). Improving data security with the utilization of matrix columnar transposition techniques. In E3S Web of Conferences, Yogyakarta, Indonesia, p. 02004. https://doi.org/10.1051/e3sconf/202450102004
[23] Syahputra, M.R., Marpaung, T.J., Marpaung, J.L. (2024). Mathematical study simulating hydroelectric power as a renewable green energy alternative. Mathematical Modelling of Engineering Problems, 11(7): 1877-1884, https://doi.org/10.18280/mmep.110717
[24] Gultom, P., Marpaung, J.L., Weber, G.W., Sentosa, I., Sinulingga, S., Putra, P.S.E., Agung, V.R. (2024). Optimizing the selection of the sustainable micro, small, and medium-sized enterprises development center using a multi-criteria approach for regional development. Mathematical Modelling of Engineering Problems, 11(11): 2977-2987. https://doi.org/10.18280/mmep.111110
[25] Gultom, P., Nababan, E.S.M., Marpaung, J.L., Agung, V.R. (2024). Balancing sustainability and decision maker preferences in regional development location selection: A multi-criteria approach using AHP and fuzzy goal programming. Mathematical Modelling of Engineering Problems, 11(7): 1802-1812. https://doi.org/10.18280/mmep.110710