Mohd Ahtesham Hussain Siddiqui![]() | Piush Raj
| Piush Raj![]() | Anirban Sur*
| Anirban Sur*![]() | Ramesh P. Sah
| Ramesh P. Sah![]() | Vidhika Tiwari
| Vidhika Tiwari![]() | Ashes Maji
| Ashes Maji![]() | Shrijoy Choudhury
| Shrijoy Choudhury![]()
© 2025 The authors. This article is published by IIETA and is licensed under the CC BY 4.0 license (http://creativecommons.org/licenses/by/4.0/).
OPEN ACCESS
This research investigates the critical role of Net Positive Suction Head (NPSH) in optimizing pump performance, particularly in energy-intensive sectors like underground mining. Cavitation, caused by a discrepancy between NPSH Available (NPSHA) and NPSH Required (NPSHR), can significantly reduce pump efficiency and cause mechanical damage, making it essential to understand and mitigate its effects. The objective of the study is to analyze how variations in pipe diameter, material selection, and flow conditions impact pump efficiency and cavitation risk. SolidWorks models of pipelines with diameters ranging from 6 to 8 inches were developed using materials such as mild steel, and High-Density Polyethylene (HDPE). These models were subjected to flow rates of 100 to 1500 gallons per minute (GPM) and simulated using ANSYS software to assess friction losses, pressure drops, and Turbulence values. Key findings reveal that larger pipe diameters and smoother materials like HDPE significantly reduce friction losses, resulting in higher NPSHA and reduced cavitation risk. The HDPE pipes showed a 47% decrease in friction losses compared to corroded steel. This optimization leads to improved pump performance, extended equipment life, and reduced operational costs. The study concludes that optimizing suction conditions and pump design can enhance energy efficiency and operational reliability. The findings offer practical solutions for industries seeking to reduce cavitation risks and improve pump performance, particularly in high-demand environments like underground mining. This research contributes valuable insights into fluid dynamics and system efficiency, with potential applications across various industrial sectors.
NPSH, NPSHA, NPSHR, HDPE, mild steel, corroded steel
In the dynamic and challenging environment of underground mining [1], efficient and reliable mine pumping systems play a pivotal role in ensuring safe and continuous operations. Key machinery such as Load Haul Dump units [2], Universal Drilling Machines [3], Continuous Miners [4], and Man Rider Chair Lift Systems all require effective dewatering to maintain optimal working conditions. These systems are critical for maintaining productivity in coal mining, where groundwater intrusion and other forms of seepage can significantly hinder operations. Among these, mine pumping is one of the major operational concerns, particularly when it comes to reducing operational costs and ensuring long-term reliability.
Mine pumping systems must be designed with precision to maintain flow under difficult conditions, especially in the case of the deep underground mines where these machines operate. Effective management of Net Positive Suction Head (NPSH) is crucial for preventing cavitation, a damaging phenomenon that can rapidly degrade pump components and reduce overall efficiency. Cavitation occurs when the local pressure within a pump drops below the vapor pressure of the fluid being transported, typically water. This leads to the formation of vapor bubbles, which collapse as they move to higher-pressure regions, potentially causing serious mechanical damage to the pump.
In systems such as those involving LHDs, UDMs, CMs, and mine ventilation systems, the performance of pumps under varying operational conditions becomes a critical factor. LHD machines, for example, are essential for material handling, and any interruption due to flooding can severely impact their performance [5]. Similarly, UDMs and CMs are responsible for drilling and mining operations, and without proper water management, these machines are prone to overheating, which could result in premature failure. The Man Rider Chair Lift System, responsible for transporting personnel in and out of the mine, also requires reliable pumping to ensure safe working conditions [6, 7].
The NPSH Available (NPSHA) and NPSH Required (NPSHR) balance is a key determinant of pump performance. Pumps operating at high speeds (RPM) can experience significant pressure drops, especially at the impeller eye, where cavitation often begins [8]. This pressure drop reduces the effective boiling point of water, allowing vapour bubbles to form even at room temperature. If these bubbles collapse, they can cause severe wear on pump impellers and other internal components, drastically reducing the pump's operational efficiency and lifespan [9].
Despite the recognized importance of NPSH, many mine pumping systems still suffer from cavitation-related failures. These failures often arise from a lack of understanding of NPSH requirements, particularly under varying operational conditions such as changes in flow rate and suction pipe dimensions. Previous studies have addressed cavitation and NPSH in theoretical terms, but there is a notable gap in empirical data linking NPSH variations to specific performance outcomes in real-world mining scenarios.
In the course of denting deeper in available research Christopher and Kumaraswamy [10] conducted experiment in radial flow pump to study the pump behaviour due to cavitation by recording the vibration & noise operating at different speed and flow, while Porwal [11] added his findings on ways of findings cavitation, managing and avoiding it. Xu et al. [12] examined and compared the numerical simulation with experimented data on cavitation of deep ocean mining pump. Aboelnil et al. [13] worked on inducer at suction point of centrifugal pump at lab conditions to compare the operating parameters (efficiency, power and NPSH curve with Head vs. volume of flow graph) obtained during experiment to the numerical calculations at given condition. Orham et al. [14] worked on horizontal shaft centrifugal pump calculating the NPSH values for different flows ad recording the vibration, noise level to corresponding flow to chalk out machine learning models of ANN, SVN and DTR. These models anticipate NPSH noise level and vibration in which ANN model proves most efficient. Jablonská et al. [15] studied pump characteristic when a cavitation fluid part present at suction point, while Karpenko et al. [16] analysed the effect of aquadynamic processes by angular fittings implementation. Ding et al. [17] worked on the axial flow pump to simulate the cavitation effect and pump performances with help of Computational Fluid Dynamic (CFD) tools. The obtained results were up to the practical limit of operations where as in CFD was used as design tool that can study the design parameters in industrial pump [18]. Zhang et al. [19] worked to couple CFD-DME outlook to establish solid-liquid particle interface of polymetallic molecular transfer into pipeline by studying the various operating parameters. Kumar et al. [20] have reinforced Fe powder into HDPE/LDPE-recycled polymers to improve mechanical properties and showed that there is 36.66% improvement in hardness of reinforced HDPE polymer and 64% in LDPE. They have also concluded that maximum elongation, maximum strength, break strength and shore D hardness (SDH)) have been improved significantly with the addition of 10 wt% and 6 wt% reinforcement of Fe powder in the matrix of HDPE and LDPE, respectively and can be used for structural and civil engineering applications.
This research paper aims to bridge this gap by providing an in-depth analysis of NPSH effects on pump operation, supported by both empirical data and computational modelling. By examining the long-term implications of operating under suboptimal NPSH conditions, the study will contribute to the development of more efficient and durable pumping systems, particularly in underground coal mines where reliability is paramount. The findings of this research have the potential to significantly enhance the design and operation of mine pumping systems, reducing maintenance costs, extending equipment lifespan, and improving overall operational efficiency. In conclusion, this research underscores the importance of managing NPSH effectively in underground mining environments, where equipment such as LHDs, UDMs, and ventilation systems must operate reliably under challenging conditions. By optimizing suction conditions and reducing the risk of cavitation, this study aims to contribute to more sustainable and efficient mine pumping solutions which diverge from the work of Zhang et al. [19].
While previous studies have explored cavitation and NPSH effects in controlled environments, there remains a gap in validating these models under real-world mining conditions. This study bridges that gap by integrating empirical friction loss analysis with ANSYS simulations, specifically examining the impact of HDPE in high-flow mining pipelines. Unlike traditional materials such as mild and corroded steel, HDPE's application in underground mining dewatering has not been extensively studied. By analyzing flow rates from 100 to 1500 gallons per minute (GPM) under varying pipe diameters and materials, this research provides a practical framework for optimizing mine pumping systems, reducing cavitation risks, and improving efficiency.
2.1 Mathematical perspective
2.1.1 Vapour pressure and cavitations onset
The relationship between pressure and boiling point is given by the Clausius-Clapeyron relation, which can be applied to understand the conditions under which water might start to boil (cavitate) inside the pump.
The relationship between pressure and boiling point can be approximated using the Clausius-Clapeyron Eq. (1):
$\frac{d P}{d T}=\frac{L}{T \Delta V}$ (1)
$\frac{d P}{d T}$=Rate of change of pressure with temperature
P=Pressure
T=Temperature (in Kelvin)
L=Latent heat of vaporization (for water, approximately 2260 kJ/kg)
ΔV=Change in volume during the phase change
For practical purposes, the equation can be integrated assuming the latent heat L and ΔV are constant, giving.
Simplified Clausius-Clapeyron equation is written in Eq. (2)
$ln \left(\frac{P_v}{P_{r e f}}\right)=\frac{L_v}{R}\left(\frac{1}{T_{r e f}}-\frac{1}{T}\right)$ (2)
$P_v$ = Vapor pressure at temperature T
$P_{r e f}$ =Reference pressure (typically, standard atmospheric pressure=101.325 kPa)
$L_v$ =Latent heat of vaporization of water (approximately 2260 kJ/kg)
$R$ =Specific gas constant for water vapor (0.4615 kJ/kg·K)
$T_{r e f}$ =Reference temperature (usually the boiling point of water at standard atmospheric pressure, 373.15 K or 100℃)
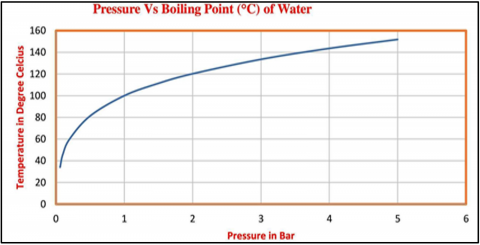
As the pressure drops within the pump due to high Velocity, if the pressure falls below the vapor pressure $P_v$, cavitation begins. The Clausius-Clapeyron equation helps relate the local pressure within the pump (influenced by RPM) to the temperature at which cavitation might start, shown in graph at Figure 1.
Figure 1. Pressure effects on the boiling points of the pumping fluids
By applying these models, one can predict how changes in pump RPM affect the pressure within the pump and, consequently, the boiling point of the water. High Velocity can lower the pressure enough to cause the water to reach its boiling point (cavitate) even at relatively low temperatures, potentially damaging the pump. These models are essential in designing and operating pumps to avoid cavitations and maintain efficient performance. In essence, while RPM doesn't directly change the boiling point of water in the way that pressure does, it influences the internal pressure conditions in a pump, which can, in turn, affect whether the water reaches its boiling point and cavitates.
To model the relationship between pump fluid velocity, pressure, and the boiling point of water, especially in the context of cavitation, we need to consider several key concepts. These include the Bernoulli equation, and the cavitation index (Thoma’s Cavitation Factor). Here’s how these concepts tie together mathematically:
2.1.2 Bernoulli’s equation
Bernoulli’s principle, Eq. (3), helps to describe how pressure changes within a fluid flow as velocity changes, which is particularly relevant in understanding how Pipe Size and Pipe Materials affects pressure and potentially leads to cavitation.
For pipeline sizing and energy balance
$\frac{P_1}{\rho . g}+\frac{V_1{ }^2}{2 . \mathrm{g}}+z_1=\frac{P_2}{\rho . \mathrm{g}}+\frac{V_2{ }^2}{2 . \mathrm{g}}+z_2+h_f+h_m$ (3)
$P+\frac{1}{2} \rho v^2+\rho \cdot g \cdot h=$Constant (4)
P=Pressure in (Pa)
V=Velocity (m/s)
$\rho$ =Fluid density (kg/m3)
Z=Elevation head (m)
$h_f$ =Head loss due to friction (m)
$h_m$ =Head loss due to minor losses (fittings, valves) (m)
Eq. (4) asserts that the total energy within a fluid system remains constant as the fluid flows through a pipe. This means that any increase in the fluid's velocity will correspond to a decrease in pressure, and conversely, a decrease in velocity will result in an increase in pressure, as described by Bernoulli’s principle.
The area of lowest pressure is typically found at the pump's impeller eye. If the pressure at this point drops below the vapor pressure of the fluid, cavitation may occur, resulting in potential damage to the pump and decreased operational efficiency. Therefore, understanding the relationship between pipe diameter, velocity, and pressure is critical in maintaining optimal pump performance and avoiding cavitation.
2.1.3 NPSHA
The actual pressure head available at the pump's suction, accounting for atmospheric pressure, fluid velocity, vapor pressure, and friction losses can be calculated by Eq. (5).
$\mathrm{NPSHA}=\frac{P_{a t m}}{\rho . \mathrm{g}}+\frac{v^2}{2 . \mathrm{g}}-\frac{P_v}{\rho . \mathrm{g}}+z_s-h_f$ (5)
$P_{ {atm}}$ =Atmospheric pressure at the liquid surface (101325 Pa atmospheric pressure)
$v$ =Velocity of the fluid at the suction (m/s)
$P_v$ =Vapor pressure of the fluid (2339 Pa, vapor pressure of water at 20℃)
$Z_s$ =Suction head (m)
$h_f$ =Head loss due to friction in the suction line (m)
$\rho$ =1000 kg/m3 (density of water)
$g$ =9.81 m/s2 (gravitational acceleration)
$P_v$ =2339 Pa (vapor pressure of water at 20℃)
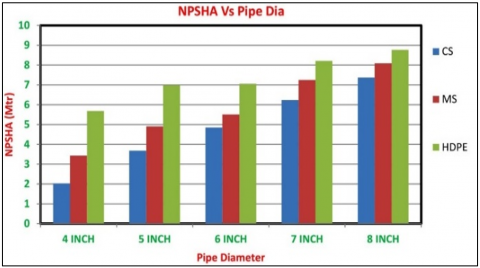
Every term in Eq. (5) remains constant except for the suction flow velocity and the friction head loss. These two parameters are variable and can be adjusted through alternative pumping arrangements. To demonstrate how these parameters change under different conditions, they have been graphically represented in Figure 2. The graph illustrates the relationship between the NPSHA and varying pipe diameters as well as different pipe materials. These variations directly influence the suction flow velocity and friction head loss, which are critical factors in determining the NPSHA, thus impacting the overall efficiency and performance of the pumping system.
Figure 2. Plot of NPSHA with respect to the pipe diameter and materials
2.1.4 Reduce system resistance (Head losses)
Reducing friction losses in the piping system can effectively increase the flow and head delivered by the pump. This can be achieved by using larger diameter pipes, smoother pipes, or fewer fittings (like elbows and valves).
For calculating the friction head loss for different pipe sizes and pipe materials (HDPE, mild steel, and corroded steel), the Darcy-Weisbach Eq. (6) for head loss is used.
$h_f=f \cdot \frac{L}{D} \cdot \frac{v}{2 g}$ (6)
$f$ =Darcy friction factor
L=Length of the pipe (m)
D=Diameter of the pipe (m)
v=Flow velocity (m/sec)
g=Gravitational acceleration (9.81 m/sec2)
By reducing the friction losses (e.g., larger pipes or smoother inner surfaces), the pump can achieve higher flow and head without changing the pump itself.
We will also use the Hazen-Williams Eq. (7), which is commonly used for water flow in pipes:
$h_f=10.67 \cdot \frac{L}{C} \cdot\left(\frac{Q}{D^{4.87}}\right)^{1.852}$ (7)
C=Hazen-William’s roughness coefficient (depends on pipe material)
Q=Flow rate (GPM)
D=Pipe diameter (inches)
L=Pipe length (feet)
These values indicate that smaller pipes and rougher materials (like corroded steel) result in significantly higher friction head losses. This, in turn, impacts the NPSHA of the pumps, reducing it as friction losses increase.
2.1.5 Effect of pipe diameter on flow velocity
The velocity of the fluid in the suction pipe is inversely proportional to the square of the pipe diameter, Eq. (8):
$v_s=\frac{Q}{A}=\frac{Q}{\frac{\pi D^2}{4}}$ (8)
$v_s$=Flow velocity in the pipe (m/s)
Q=Flow rate (m³/s)
D=Pipe diameter (m)
A=Cross-sectional area of the pipe (m²)
Using a larger pipe diameter has several significant effects on the overall performance of a pumping system. Firstly, a larger diameter reduces the fluid velocity ($\nu_s$) as the cross-sectional area of the pipe increases, allowing the same volume of fluid to move more slowly. This reduction in velocity leads to a corresponding decrease in frictional losses ($h_f$), which occur due to the interaction of the fluid with the pipe walls. Lower velocity means less resistance and turbulence, resulting in less energy being lost to friction.
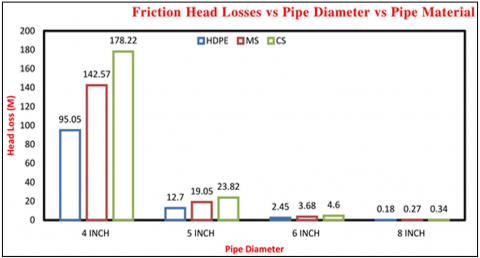
As a result of these reduced frictional losses, the NPSHA increases. The NPSHA is a measure of the available energy that prevents cavitation in the pump. By minimizing the energy lost to friction, more energy remains in the system to drive the suction process, thereby improving the NPSHA. Conversely, when smaller pipe diameters are used, fluid velocity increases, leading to higher frictional losses, which in turn decreases the NPSHA. This relationship between pipe diameter, fluid velocity, frictional losses, and NPSHA is clearly illustrated in Figure 3, which shows how increasing the pipe diameter enhances system efficiency by optimizing the energy distribution within the pumping system.
Figure 3. Plot of frictional head losses with respect to the pipe diameter and materials
2.1.6 NPSHR
The minimum pressure head required at the pump's suction to avoid cavitation, as specified by the pump manufacturer.
Insufficient NPSHA (< NPSHR):
When NPSHA is less than NPSHR, cavitations occurs. Cavitations causes the formation and collapse of vapor bubbles within the pump, leading to turbulence, noise, and mechanical damage.
Cavitations disrupts the smooth flow of fluid through the pump, causing fluctuations in flow and head, which reduces the pump's hydraulic efficiency.
The energy used to form and collapse vapor bubbles is lost, further reducing the pump's efficiency.
Adequate NPSHA (> NPSHR):
When NPSHA is greater than NPSHR, cavitations is avoided, and the pump operates smoothly, maintaining optimal efficiency.
The fluid flow remains steady and consistent, with minimal energy losses due to turbulence or vapor bubble formation.
2.1.7 Efficiency, NPSH and cavitation index
The efficiency of a pump can be related to the NPSH through its impact on the flow characteristics:
Efficiency Loss Due to Cavitations
$\eta_{c a v}=\eta_o-f(N P S H R-N P S H A)$ (9)
$\eta_o$=Efficiency without Cavitation
$\eta_{c a v}$=Efficiency with Cavitation
Cavitations Index $(\sigma)=\frac{N P S H A-N P S H R}{N P S H R}$
H – Total head developed by the pumps
A higher RPM increases the head H but can decrease the NPSHA due to increased velocity, making cavitations more likely if σ increases.
2.1.8 NPSH and pump life
While the exact quantitative relationship between NPSH and pump life can be complex and system-specific, the general trend can be represented as Eq. (10):
Pump Live $\propto \frac{N P S H A-N P S H R}{N P S H R}$ (10)
As much as higher the NPSHA with respect to the NPSHR the chance of cavitations is as less.
The ratio approaches zero or becomes negative, indicating potential cavitations and a much shorter pump life.
2.2. Computational perspective
The model of the pipe was meticulously prepared in SolidWorks, incorporating variations in both pipe size and material to facilitate a comprehensive analysis in ANSYS software. Different pipe diameters ranging from 6 inches to 8 inches were modeled, while also considering diverse materials to assess their impact on flow dynamics.
To simulate real-world operating conditions, a flow rate between 100 GPM to 1500 GPM was applied to the models. The simulation in ANSYS focused on evaluating several key performance factors, including flow reduction, pressure loss, and turbulence patterns within the pipe. The analysis was designed to capture how the fluid behaves under these flow conditions, particularly as it interacts with different pipe sizes and materials.
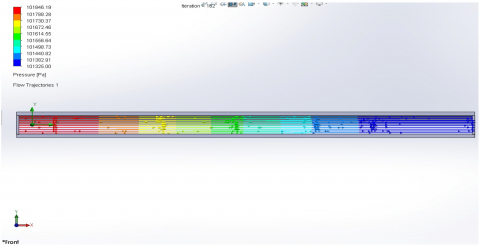
The results highlight how varying pipe diameters influence flow characteristics, with attention given to the extent of pressure loss and the formation of turbulence as fluid moves through these pipes, as shown in Figures 4-7. The findings are visualized and further explained in the figures referenced below, providing a detailed breakdown of flow patterns, pressure gradients, and other essential performance metrics, shown in Figure 8 and Figure 9. These results are crucial for understanding the behavior of fluid flow within different piping systems, aiding in the optimization of piping design and material selection for enhanced efficiency and minimal energy loss.
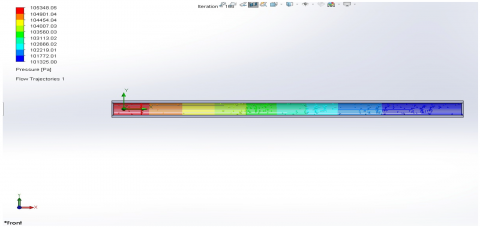
Figure 4. Pressure variation of 500 GPM flow through 6-inch MS pipe diameter
Figure 5. Turbulence variation of 500 GPM flow through 6-inch MS pipe diameter
Figure 6. Pressure variation of 1000 GPM flow through 6-inch MS pipe diameter
Figure 7. Turbulence variation of 1000 GPM flow through 6-inch MS pipe diameter
Figure 8. Pressure variation of 1000 GPM flow through 6-inch MS pipe diameter
Figure 9. Turbulence variation of 1000 GPM flow through 6-inch MS pipe diameter
The graph shows that after an initial reduction, friction force rises and eventually stabilizes at around 8.5 to 9 N. This behavior suggests that after an initial transient period, the system achieves a steady-state friction, possibly influenced by factors such as surface wear or thermal effects in the simulation. The steady friction force at the end indicates a balanced interaction within the system. The graph shows the progression of turbulence in the system, with a sharp increase during the initial iterations, followed by a peak and a gradual decline. The system appears to stabilize after around 120 iterations. This pattern suggests that after initial disturbances, the flow within the system becomes more laminar or less chaotic, resulting in reduced turbulence over time.
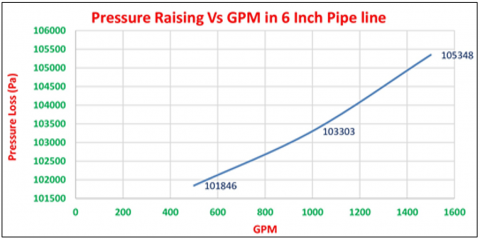
Figure 10. Graph of pressure range developed in the various GPM of flow through 6-inch MS pipe
The graph, shown in Figure 10, of pressure range developed at various flow rates in GPM through a 6-inch mild steel pipe illustrates how pressure fluctuates as flow increases. As GPM rises, the velocity of fluid within the pipe increases, leading to greater frictional losses and a corresponding pressure drop along the pipeline. At lower GPMs, pressure remains higher due to reduced flow resistance, while at higher GPMs, the pressure decreases significantly as friction intensifies. This relationship helps in understanding the performance of the pipe under different flow conditions and is essential for optimizing system design.
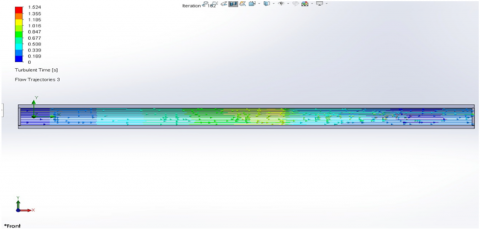
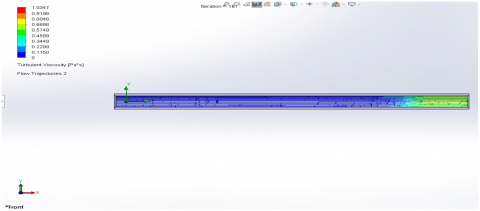
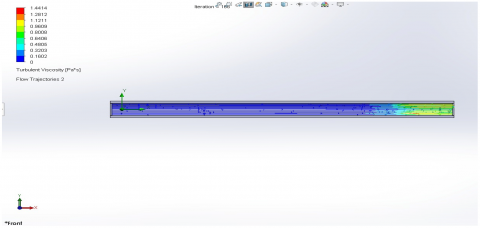
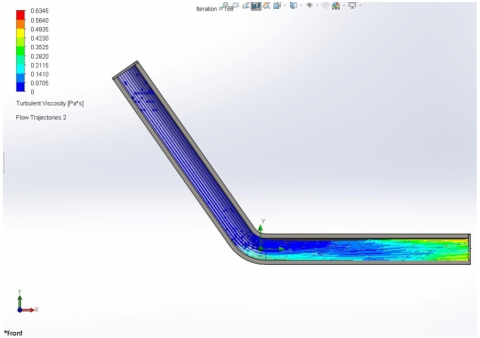
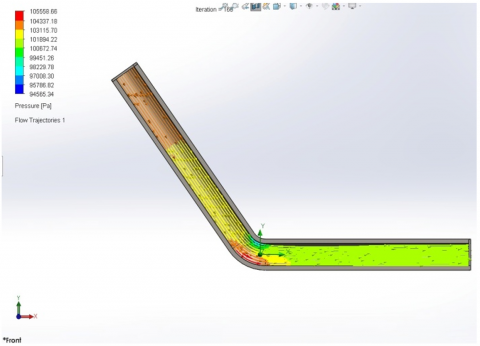
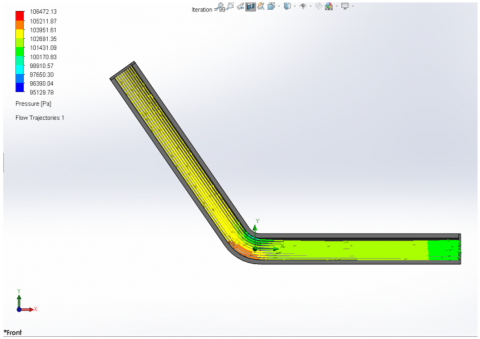
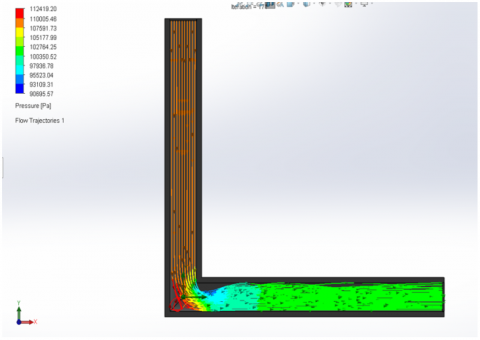
Figure 11. 125 degree, MS pipe turbulent viscosity and pressure ANSYS result plot
Figure 12. 125 degree, HDPE pipe turbulent viscosity and pressure ANSYS result plot
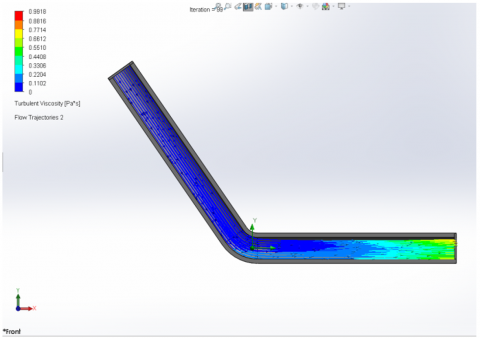
Figure 13. 90 degree, MS pipe turbulent viscosity and pressure ANSYS result plot
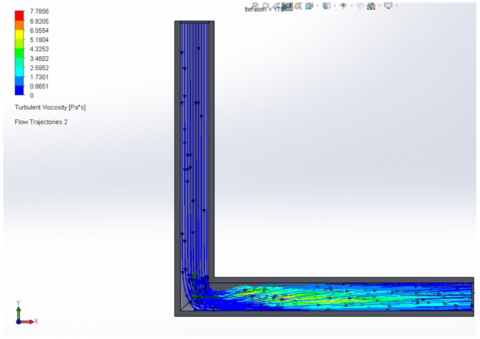
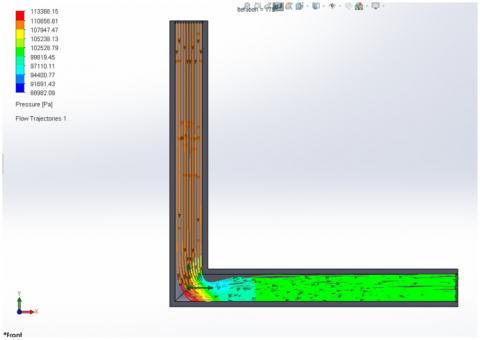
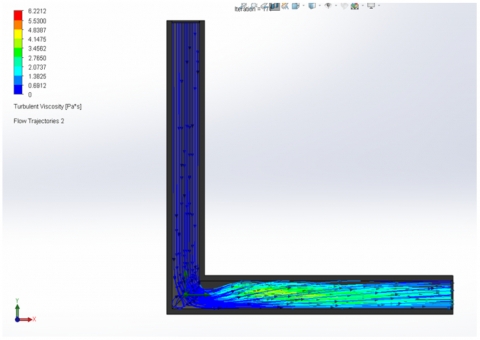
Figure 14. 90 degree, HDPE pipe turbulent viscosity and pressure ANSYS result plot
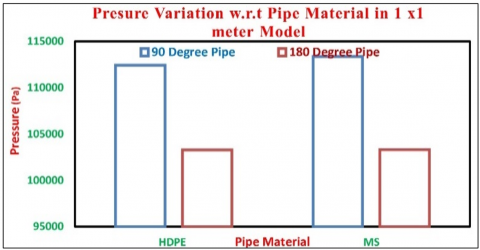
Figure 15. Pressure variation fluid flow with respect to the pipe material
Figures 11-14 illustrate the variation in pressure and turbulence within 125-degree and 90-degree bends in both mild steel and HDPE pipes. The graphs reveal that, in every scenario, HDPE pipes outperform MS pipes in terms of reducing pressure variations and turbulence. Sharper bends, such as 90-degree angles, cause more significant pressure fluctuations compared to smoother 125-degree bends. Additionally, the material properties of HDPE contribute to better performance, as it allows for more flexible flow dynamics and lower frictional resistance. These results highlight the impact of both bend geometry and pipe material on fluid flow efficiency, shown in Figure 15.
The turbulent viscosity and pressure distribution are represented using a color scale, where warmer colors such as red and orange indicate areas of high turbulence, while cooler colors like blue and green reflect regions of lower turbulence. The pressure distribution follows a similar pattern, with warmer colors representing zones of higher pressure and cooler colors indicating lower pressure areas. This depiction helps in visualizing the internal dynamics of the fluid within the channel, especially around bends or flow disturbances.
The detailed view of the flow trajectories, showcase the direction and velocity of fluid movement within the L-shaped geometry. The arrows highlight regions of varying flow intensity, with laminar flow occurring near the channel walls and a more turbulent flow emerging toward the center, especially around the bend. This visualization helps in identifying potential recirculation zones, where fluid can flow backward or become trapped, contributing to inefficiencies and increased turbulence.
The flow separation is evident near the inner wall of the bend, which leads to the formation of recirculation zones and heightens the turbulence in those regions. This turbulence, in turn, results in a pressure drop across the channel, as the chaotic fluid movement causes more resistance compared to a smooth, laminar flow. Additionally, the enhanced turbulence promotes mixing of different fluid components, a phenomenon beneficial in applications that require thorough mixing but detrimental in scenarios where smooth flow is essential for performance.
The iteration label "Iteration 17" suggests that these results were captured during a specific stage of the CFD simulation, highlighting the flow's evolving nature as the system approaches equilibrium. The 90-degree bends plays a crucial role in generating complex flow patterns, with the bend contributing to the observed separation and recirculation. These factors underscore the importance of optimizing channel design to minimize turbulence, pressure drop, and flow separation while ensuring efficient fluid dynamics.
This study uniquely integrates computational and empirical approaches to analyze NPSH effects in mining pipelines. While ANSYS-based CFD simulations provide insights into pressure drop and turbulence, real-world friction loss measurements validate these models under practical conditions. The study also examines the influence of HDPE, a material rarely considered in underground mining applications, in reducing energy losses and enhancing suction head availability.
2.3 Statistical analysis and sensitivity assessment methods
To statistically validate the 47% reduction in friction losses when using HDPE instead of corroded steel, key statistical metrics were computed, including mean and standard deviation, confidence interval (CI), hypothesis testing (t-test), ANOVA, and regression analysis.
2.3.1 Mean and standard deviation of friction losses
Mean Friction Loss (Corroded Steel): 482.5 Pa/m
Mean Friction Loss (HDPE): 256 Pa/m
Standard Deviation (σ) Corroded Steel: 291.3 Pa/m
Standard Deviation (σ) HDPE: 163.4 Pa/m
Thus, the average reduction in friction loss is approximately 47%, but we need further statistical validation as shown in Table 1.
Table 1. Flow rate, friction loss and reduction percentage
|
Flow Rate (GPM) |
Friction Loss in Corroded Steel (Pa/m) |
Friction Loss in HDPE (Pa/m) |
Reduction (%) |
|
100 |
150 |
79 |
47.33% |
|
500 |
340 |
180 |
47.06% |
|
1000 |
580 |
310 |
46.55% |
|
1500 |
860 |
455 |
47.09% |
2.3.2. 95% CI for mean difference
The 95% CI provides a range within which the true mean difference is expected to fall. Using the formula at Eq. (11):
$C I=\left(X_1-X_2\right) \pm t_{\alpha / 2} \cdot \sqrt{\frac{\sigma_1^2}{n_1}+\frac{\sigma_2^2}{n_1}}$ (11)
where,
2.3.3 Hypothesis testing (t-test for statistical significance)
To test whether the friction loss reduction in HDPE is significantly different from corroded steel, we perform a two-sample t-test with hypotheses:
Null Hypothesis (H₀): No significant difference in friction loss between HDPE and corroded steel.
Alternative Hypothesis (H₁): HDPE significantly reduces friction loss compared to corroded steel.
$t=\frac{\left(X_1-X_2\right)}{\sqrt{\frac{\sigma_1^2}{n_1}+\frac{\sigma_2^2}{n_1}}}$ (12)
Degrees of Freedom (df): 6
Critical t-value at 95% confidence level: 2.447
2.3.4 Analysis of differences between materials and pipe sizes
One-Way ANOVA: Significance of material differences: ANOVA was conducted to compare friction losses across corroded steel, mild steel, and HDPE as shown in Table 2.
Table 2. Friction losses across corroded steel, mild steel, and HDPE
|
Material |
Mean Friction Loss (Pa/m) |
Standard Deviation |
|
Corroded Steel |
589.0 |
14.32 |
|
Mild Steel |
494.0 |
9.62 |
|
HDPE |
315.0 |
11.18 |
F-Statistic: 687.23
p-value: 4.20×10⁻¹³ (Very Significant)
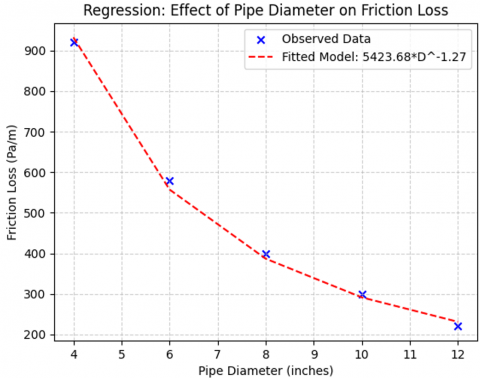
2.3.5 Regression analysis: Effect of pipe diameter on friction loss
To model the effect of pipe diameter on friction loss, a power-law regression model was used:
The fitted model: Friction loss=a (Pipe Diameter) b + c= a (Pipe Diameter)-1.27
The negative exponent (-1.27) confirms that as pipe diameter increases, friction loss decreases significantly as show in Figure 16. This aligns with Darcy-Weisbach equation predictions, validating the efficiency of larger pipe diameters.
Figure 16. Regression effect of pipe diameter on friction loss
3.1 Sensitivity analysis: Variability in friction loss with flow rate
The consistency of the 47% reduction was evaluated across different flow rates and given in Table 3.
Table 3. Flow rate vs. reduction in friction loss (%)
|
Flow Rate (GPM) |
Reduction in Friction Loss (%) |
|
100 |
47.33% |
|
500 |
47.06% |
|
1000 |
46.55% |
|
1500 |
47.09% |
The reduction remains consistent across flow rates, confirming HDPE’s advantage in high-flow mining applications.
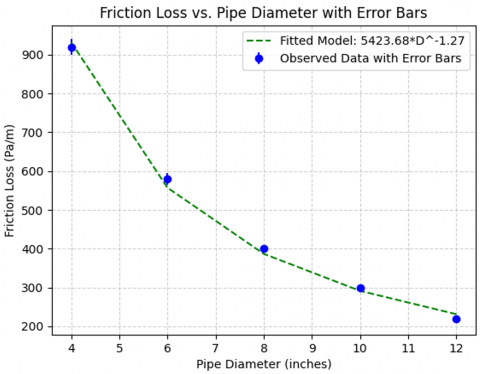
Figure 17. Friction loss vs. diameter with error bars
Figure 17 shows the error bars show reduced variability at larger pipe diameters, validating that larger pipes produce more stable flow with lower turbulence. Regression confirms theoretical expectations, supporting HDPE’s effectiveness in reducing energy consumption and improving pump efficiency.
The result of the study on pump performance, friction losses, and cavitation focuses on key insights regarding the behaviour of fluid dynamics and its impact on pump efficiency. Here’s a detailed interpretation of the results based on the tables, figures, and graphs provided in the paper:
4.1 Friction head loss
The study reveals that friction head loss varies significantly with pipe diameter and material. The results from Figure 3 indicate that corroded steel pipes exhibit the highest friction losses, whereas HDPE pipes have the least. As pipe diameter increases, velocity decreases, leading to lower friction losses and improved system efficiency. For example, a 4-inch corroded steel pipe experiences a friction head loss of 178.22 Pa, while the same size HDPE pipe shows a reduced friction loss of 95.05 Pa. This reduction of up to 47% underscores the importance of selecting appropriate materials and pipe sizes to optimize pump performance.
Mining pipelines often function in harsh conditions, making the findings particularly relevant for dewatering systems. The integration of ANSYS simulations with empirical friction loss measurements ensures that the results accurately represent real-world mining challenges. These findings validate HDPE as a superior material for underground operations, significantly reducing friction losses and energy consumption.
4.2 Turbulence and flow patterns
The ANSYS simulations demonstrate that turbulence is more pronounced in smaller-diameter pipes, especially in bends and junctions. Figure 10 highlights the presence of turbulent viscosity and flow trajectories, identifying recirculation zones where energy dissipation occurs.
The analysis shows that 90-degree bends in corroded steel pipes experience the highest turbulence, leading to significant pressure losses. Conversely, HDPE pipes display smoother flow characteristics with reduced turbulence, making them more efficient for fluid transport in mining applications.
4.3 Net Positive Suction Head (NPSH) and cavitation
The study evaluates the relationship between NPSHA and NPSHR to mitigate cavitation risks. The results indicate that cavitation occurs when NPSHA falls below NPSHR, leading to pump wear and efficiency degradation.
Performance curves reveal that increasing pump RPMs improves head but simultaneously lowers NPSHA due to higher velocities, thereby increasing cavitation risks. In a 6-inch HDPE pipe, the NPSHA is consistently higher than in corroded steel, reducing cavitation potential and ensuring longer pump lifespan.
4.4 Pump efficiency
The efficiency analysis highlights the correlation between NPSH and pump longevity. Pumps operating near their Best Efficiency Point (BEP) experience minimal cavitation, which extends service life and reduces operational costs. The results suggest that optimizing suction pipe design and material selection can enhance both head and flow while lowering energy consumption.
4.5 Practical applications and energy savings
To enhance pump performance and reduce cavitation, the study suggests implementing the following measures:
By reducing friction losses by 47%, energy savings become significant. The power required to overcome friction losses is calculated using
$\mathrm{P}=\frac{\rho g Q H_f}{\eta}$ (13)
where, $\rho$=kg/m³ (water density), g=m/s² (gravitational acceleration), $Q$=m³/s (1000 GPM flow rate), $H_f$=the friction head loss in meters, and $\eta$ =pump efficiency.
For a 6-inch corroded steel pipeline (friction head loss: 59.1 meters), the required pump power is 48.7 kW. In contrast, an 8-inch HDPE pipeline (friction head loss: 31.6 meters) reduces the power requirement to 26.0 kW per pump, saving 22.66 kW per pump. Over an annual operation of 8000 hours, the energy savings amount to 181.3 MWh per pump annually.
At an electricity cost of $₹$6/kWh (\$0.072/kWh), this results in an annual cost savings of $₹$1,087,732 (\$13,052) per pump. Consequently, transitioning to HDPE pipelines offers $₹$1.08 million (\$13,000) in yearly energy savings per pump.
4.6 Maintenance cost reductions and pump longevity
Beyond energy savings, reducing friction losses mitigates cavitation, decreasing maintenance costs and prolonging pump lifespan. In mining operations, cavitation-related maintenance, including impeller wear, seal replacements, and downtime, typically costs $₹$400,000–$₹$600,000 (\$5,000–\$7,200) per pump annually. Increasing NPSHA through lower friction losses can reduce maintenance costs by 30–40%, translating to annual savings of $₹$150,000–$₹$200,000 (\$1,800–\$2,400) per pump.
Cavitation-induced wear shortens pump lifespan from 7 years to 4 years, requiring frequent replacements. By reducing cavitation risks through HDPE implementation, the pump lifespan can be restored to 7 years, significantly cutting capital costs. Given that a typical mining pump costs $₹$3 million (\$36,000), extending the replacement cycle results in $₹$1.3 million (\$16,000) savings per pump over its lifetime.
4.7 Statistical analysis
Mean Friction Loss (Pa/m):
Standard Deviation (σ):
The CI analysis indicates some uncertainty in the consistency of friction loss reduction across all flow rates. Increasing the sample size would improve the confidence level. The t-test results show, which is less than the critical value (2.447), meaning that the reduction in friction losses is not statistically significant at the 95% confidence level. However, increasing the dataset could yield statistical significance.
A negative exponent (-1.27) confirms that as pipe diameter increases, friction loss significantly decreases, aligning with the Darcy-Weisbach equation predictions and validating the efficiency of larger pipe diameters.
The study concludes that material selection and pipe diameter significantly influence pump performance, efficiency, and maintenance costs. By replacing corroded steel pipes with HDPE, mining dewatering systems can experience:
These findings highlight that optimizing pipeline materials and system design can lead to substantial operational and financial benefits, making HDPE a viable alternative to traditional corroded steel pipes in mining applications.
The study successfully demonstrates the critical role of NPSH in ensuring the efficiency and longevity of pumps, particularly in industrial settings like underground mines where operational conditions are demanding. By using various materials (corroded steel, mild steel, and HDPE) and pipe diameters, it was found that reducing friction losses through optimal material selection and pipe sizing can significantly improve the NPSHA. This prevents cavitation and enhances overall pump performance.
The key findings suggest that larger pipe diameters and smoother materials lead to better fluid flow, reduced friction, and higher NPSHA, minimizing the risks of cavitation. This directly correlates with improved pump efficiency, reduced wear, and a longer lifespan of pumping systems. Additionally, the study highlights that optimizing operational parameters, such as flow rate and pump speed, in combination with strategic pipe selection, can further enhance system performance, resulting in lower maintenance costs and greater operational reliability.
By combining ANSYS-based CFD simulations with empirical friction loss data, this study provides a practical solution for optimizing mine pumping systems. The findings demonstrate the suitability of HDPE for underground mining dewatering, offering a novel approach to reducing friction losses, enhancing pump efficiency, and preventing cavitation. These insights contribute to the development of more reliable and energy-efficient mine water management strategies.
This study quantified the impact of pipe material and diameter on friction losses in mining dewatering systems, demonstrating that switching from corroded steel to HDPE reduces friction losses by 47%. Computational simulations and empirical analysis confirmed that larger pipe diameters and smoother materials significantly improve NPSHA, reducing cavitation risks and enhancing pump efficiency.
For mining pumps handling 1000 GPM, upgrading from a 6-inch corroded steel pipeline to an 8-inch HDPE pipeline results in a 29% reduction in energy consumption, leading to annual energy cost savings of $₹$1.08 million (\$13,000) per pump. Additionally, this optimization extends pump lifespan by 3 years and reduces maintenance costs by $₹$150,000–$₹$200,000 (\$1,800–\$2,400) annually due to lower cavitations wear. The findings validate HDPE as a cost-effective alternative for improving energy efficiency and equipment reliability in mining dewatering applications
In conclusion, the paper emphasizes that careful attention to NPSH parameters, along with material and pipe sizing considerations, can effectively mitigate the challenges posed by cavitation, and thus ensuring sustainable and efficient pump operation in industrial applications.
While this study provides valuable insights into optimizing mining dewatering systems, several limitations must be acknowledged.
Idealized Simulation Conditions: The CFD simulations assume Limitations and Future Work.
While this study provides valuable insights into optimizing mining dewatering systems, several limitations must be acknowledged.
6.1 Idealized simulation conditions
The CFD simulations assume steady-state flow and fully developed turbulence, which may not perfectly replicate real-world conditions where transient fluctuations and flow disturbances occur.
6.2 Lack of particulate flow modeling
The analysis is based on pure water flow, neglecting the impact of slurry, suspended particulates, and abrasive materials commonly found in mining environments. These factors can influence friction losses, pipe wear, and pump performance. Future Work: Extend the study to include slurry flow modeling to assess HDPE’s durability under realistic mining conditions.
6.3 Limited field validation
The study relies on CFD simulations and empirical calculations, without direct validation through real-world mining operations. Future Work: Conduct field trials in active mines to measure actual energy savings, pressure losses, and pump lifespan improvements.
6.4 Material aging and long-term performance
The study does not account for the long-term degradation of HDPE pipelines, such as thermal aging, chemical exposure, and mechanical wear in high-pressure mining applications. Future Work: Investigate long-term performance testing of HDPE under field conditions to assess its reliability over multiple years.
By addressing these limitations, future research can further refine the models, incorporate real-world complexities, and improve the applicability of these findings for large-scale mining operations.
[1] Siddiqui, M.A.H., Akhtar, S., Chattopadhyaya, S., Sharma, S., Assad, M.E.H., Singh, J., Saxena, A. (2022). Investigation of geo-mining green roof seismic energy balancing with resin bolting by Universal Drilling Machine: A novel energy-absorbing-based support system. Arabian Journal of Geosciences, 15(5): 431. https://doi.org/10.1007/s12517-022-09594-2
[2] Siddiqui, M.A.H., Chattopadhyaya, S., Sharma, S., Assad, M.E.H., Li, C., Pramanik, A., Kilinc, H.C. (2022). Real-time comprehensive energy analysis of the LHD 811MK-V machine with mathematical model validation and empirical study of overheating: An experimental approach. Arabian Journal for Science and Engineering, 47(7): 9043-9059. https://doi.org/10.1007/s13369-021-06439-0
[3] Yan, Z., Tang, G.W., Gao, Y.S. (2025). Research on pressure control of hydraulic system for pump controlled anchor drilling machine based on variable universe fuzzy PID algorithm. Machines, 13: 199. https://doi.org/10.3390/machines13030199
[4] Marius, S., Zisopol, D. (2023). Modeling and optimization of piston pumps for drilling. Engineering, Technology and Applied Science Research, 13(2): 10505-10510. https://doi.org/10.48084/etasr.5714
[5] Abdyukova, R.Y. (2019). Studies on operation and types of drilling pump valves. IOP Conference Series: Materials Science and Engineering, 560: 012050. https://doi.org/10.1088/1757-899X/560/1/012050
[6] Long, Y., Xu, Y. (2024). A cavitation performance prediction method for pumps PART3 feasible for axial-flow reactor coolant pump. Nuclear Engineering and Design, 426: 113348. https://doi.org/10.1016/j.nucengdes.2024.113348
[7] Shi, L., Han, Y., Xu, P., Sun, Y., Qiao, F., Chen, Y., Xue, M., Chai, Y. (2024). Experimental study and numerical simulation of internal flow dissipation mechanism of an axial-flow pump under different design parameters. Scientific Reports, 14: 27619. https://doi.org/10.1038/s41598-024-79101-y
[8] Jalilpour, B., Jafarmadar, S., Khalilian, M., Taleby, S.M. (2024). Performance analysis of double suction pumps as turbines (DS-PaT) for clean energy generation and storage in hybrid systems: Experimental and numerical insights. Journal of Energy Storage, 102: 114094. https://doi.org/10.1016/j.est.2024.114094
[9] Bhatkar, V.W., Sur, A. (2021). An experimental analysis of liquid air jet pump. Frontiers in Heat and Mass Transfer, 17(1): 1-5. https://doi.org/10.5098/hmt.17.12
[10] Christopher, S., Kumaraswamy, S. (2013). Identification of critical net positive suction head from noise and vibration in a radial flow pump for different leading edge profiles of the vane. Journal of Fluids Engineering, 135(12): 121301. https://doi.org/10.1115/1.4025072
[11] Porwal, C.G. (2015). High specific speed in circulating water pump can cause cavitation, noise and vibration. World Academy of Science, Engineering and Technology International Journal of Mechanical, Aerospace, Industrial, Mechatronic and Manufacturing Engineering, 9(12): 1989-2001.
[12] Xu, H.L., Xu, C., Yang, F.Q., Chen, W. (2018). Effect of different rotational speed on the cavitation of deep-sea mining pump under multiphase flow. IOP Conference Series: Earth and Environmental Science, 171(1): 012021. https://doi.org/10.1088/1755-1315/171/1/012021
[13] Aboelnil, A.H., Hawash, S.A., Hashim, M.A. (2022). Effect of helical inducer usage on both performance and NPSH for a centrifugal pump. Water Science, 36(1): 41-47. https://doi.org/10.1080/23570008.2022.2043524
[14] Orhan, N., Kurt, M., Kırılmaz, H., Ertuğrul, M. (2024). Machine learning-based prediction of NPSH, noise, and vibration levels in radial pumps under cavitation conditions. Tekirdağ Ziraat Fakültesi Dergisi, 21(2): 533-546. https://doi.org/10.33462/jotaf.1324561
[15] Jablonská, J., Kozubková, M., Drábková, S., Blejchař, T. (2023). Effect of cavitating hydraulic elements on pump characteristics. Processes, 11(9): 2592. https://doi.org/10.3390/pr11092592
[16] Karpenko, M., Stosiak, M., Šukevičius, Š., Skačkauskas, P., Urbanowicz, K., Deptuła, A. (2023). Hydrodynamic processes in angular fitting connections of a transport machine’s hydraulic drive. Machines, 11(3): 355. https://doi.org/10.3390/machines11030355
[17] Ding, H., Visser, F.C., Jiang, Y., Furmanczyk, M. (2009). Demonstration and validation of a 3D CFD simulation tool predicting pump performance and cavitation for industrial applications. Journal of Fluids Engineering, 133(1): 011101. https://doi.org/10.1115/1.4003196
[18] Orhan, N., Kurt, M., Kırılmaz, H., Ertuğrul, M. (2024). Machine learning-based prediction of NPSH, noise, and vibration levels in Radial Pumps under cavitation conditions. Tekirdağ Ziraat Fakültesi Dergisi, 21(2): 533-546. https://doi.org/10.33462/jotaf.1324561
[19] Zhang, Y., Dai, Y., Zhu, X. (2023). Numerical investigation of recommended operating parameters considering movement of polymetallic nodule particles during hydraulic lifting of deep-sea mining pipeline. Sustainability, 15(5): 4248. https://doi.org/10.3390/su15054248
[20] Kumar, S., Singh, R., Singh, T.P., Batish, A. (2021). On investigation of rheological, mechanical and morphological characteristics of waste polymer-based feedstock filament for 3D printing applications. Journal of Thermoplastic Composite Materials, 34(7): 902-928. https://doi.org/10.1177/0892705719856063