Parapat Gultom*![]() | Esther Sorta Mauli Nababan
| Esther Sorta Mauli Nababan![]() | Mardiningsih
| Mardiningsih![]() | Jonathan Liviera Marpaung
| Jonathan Liviera Marpaung![]() | Vaqqi Riehanda Agung
| Vaqqi Riehanda Agung
© 2024 The authors. This article is published by IIETA and is licensed under the CC BY 4.0 license (http://creativecommons.org/licenses/by/4.0/).
OPEN ACCESS
In this study, we address the challenge of balancing sustainability and decision-maker preferences in regional development location selections. We propose a multi-criteria decision-making framework combining the Analytical Hierarchy Process (AHP) and Fuzzy Goal Programming (FGP) to evaluate potential sites. AHP is utilized to prioritize criteria, incorporating both quantitative and qualitative factors, while FGP allows for the accommodation of uncertainty and conflicting goals. Our findings reveal that this integrated approach provides a robust, systematic method for identifying optimal locations that align with both sustainability goals and stakeholder priorities. The analysis revealed the following satisfaction levels: Price 61.11%, Quality 80.4%, Delivery Time 79.3%, Carbon Emission 91.76%, and Preference 51.18%. The findings emphasize the complex process of selecting vendors within the palm oil supply chain. The implications of this research suggest enhanced decision-making efficiency and effectiveness in regional planning, promoting sustainable development practices.
Fuzzy Goal Programming, Analytical Hierarchy Process, decision maker preferences, multi criteria selection, palm oil industry
In the current period of regional development, there is a strong need for sustainable growth, which has resulted in a growing focus on incorporating sustainability factors into decision-making processes. Although there has been a tremendous increase in research and methodology focused on improving the selection of locations for regional development, there are still notable gaps and limitations in present approaches. Conventional approaches frequently struggle to effectively reconcile the complex and different aspects of sustainability, which include environmental, social, and economic components, with the specific preferences and goals of various stakeholders. Furthermore, these approaches often do not possess the adaptability to handle the inherent uncertainties and ambiguities in decision-making situations, especially those that involve subjective assessments and qualitative standards [1-4]. The conventional Analytical Hierarchy Process (AHP) is commonly employed for its systematic approach to multi-criteria decision-making. It is particularly effective in prioritizing criteria and combining expert viewpoints. However, it has limitations when it comes to dealing with vagueness and lack of precision in human judgments [5, 6]. However, Goal Programming (GP) is not as successful in handling the qualitative parts of decision criteria and the subjective character of stakeholder preferences, despite its effectiveness in managing many, frequently conflicting objectives. In addition, current models often fail to consider the dynamic and linked characteristics of sustainability issues, resulting in less than ideal and perhaps unsustainable development results. This study aims to fill these existing gaps by introducing a comprehensive multi-criteria decision-making framework that integrates the advantages of Analytic Hierarchy Process (AHP) and Fuzzy Goal Programming (FGP) [7-9]. The AHP component of our methodology allows for the methodical assessment and ranking of a complete range of criteria, including both quantitative and qualitative elements, so assuring a fair and thorough analysis of all pertinent aspects of sustainability. Our technique incorporates FGP to effectively address the ambiguities and imprecision that are inherent in the decision-making process [10, 11]. FGP's ability to integrate fuzzy logic enables the accurate modeling of stakeholder preferences and goals, capturing the intricate and subjective character of these preferences in the actual world. This integration not only improves the adaptability and strength of the decision-making process but also guarantees that the chosen locations are more closely aligned with both sustainability goals and stakeholder preferences. In addition, our research presents a new use of this integrated strategy in the field of regional development. We provide a comprehensive case study that showcases its practical usefulness and efficiency [12, 13]. The results of our case study demonstrate that the suggested framework greatly enhances the quality and long-term viability of judgments about location selection. It provides a more thorough and nuanced comprehension of the compromises that are inherent in such selections. This work enhances the current knowledge by addressing a significant gap in the literature and offering a useful tool for decision-makers in regional planning. The findings of our research have broader ramifications beyond the specific field of regional development [14-18]. They provide valuable insights and approaches that may be applied to other areas where making decisions based on several criteria is essential. Our work facilitates the incorporation of sustainability into decision-making processes, thereby promoting well-informed, equitable, and environmentally responsible development practices [19]. To summarize, this study emphasizes the significance of creating advanced decision-making instruments that can tackle the intricate and interconnected obstacles of sustainability and stakeholder preferences. The integration of the Analytic Hierarchy Process (AHP) and the Fuzzy Goal Programming (FGP) framework is a significant advancement in addressing a critical problem in current regional development. This framework provides a strong, adaptable, and realistic solution [20].
The process of choosing the most suitable sites for regional development initiatives entails the careful consideration and weighing of different, frequently contradictory, factors. Multi-criteria decision-making (MCDM) methodologies, such as the Analytical Hierarchy Process (AHP) and Fuzzy Goal Programming (FGP), are useful methods for evaluating potential sites in this situation. The main factors considered in this assessment are Price, Quality, Delivery Time, Carbon Emission, and Preference. The AHP technique initiates by organizing these criteria into a hierarchical model, with the primary objective (best location selection) at the highest level, followed by several degrees of criterion and sub-criteria [21-23]. Decision-makers utilize pairwise comparisons to evaluate the relative significance of each criterion, thereby converting subjective judgments into measurable weights. The weights assigned to each criterion allow for a thorough assessment of potential locations, indicating their relative importance. When comparing Price and Quality, decision-makers assess the relative significance of cost vs the level of services or products provided. Similarly, an analysis is conducted to compare the Delivery Time and Carbon Emission, assessing the balance between timeliness and ecological consequences. The Preference criterion considers the subjective preferences of stakeholders, ensuring that the selected location is in line with their specific needs and objectives [24, 25].
After determining the criteria weights, the subsequent step is to utilize Fuzzy Goal Programming to handle the inherent ambiguities and vagueness in human judgments. FGP enhances classical Goal Programming by integrating fuzzy logic, enabling the representation of imprecise and ambiguous data. This is especially advantageous in practical situations when precise data may be lacking or where preferences are not rigidly limited to two options. Within the FGP framework, every objective (related to Price, Quality, Delivery Time, Carbon Emission, and Preference) is expressed using fuzzy phrases, indicating acceptable ranges and levels of satisfaction instead of specific targets. Instead of imposing a rigid cost limit, the Price objective could be defined as a fuzzy set, where lower prices are favored but slightly higher costs are permissible within a specific range. Similarly, the Quality criterion could be represented to encompass diverse levels of satisfaction with many quality standards, rather than a singular acceptable norm [26, 27]. This adaptability enables the decision-making process to more accurately capture the intricacies of real-life situations [28].
The process of integrating AHP and FGP starts with normalizing the criteria weights derived from AHP. These normalized weights are then utilized to develop the FGP model. The FGP model utilizes these weights as coefficients in the objective function, which symbolize the level of accomplishment for each fuzzy goal [29]. The main goal is to maximize the total level of goal accomplishment, while adhering to the limitations set by the fuzzy goals. In this concept, the requirements are not regarded as inflexible limits but rather as adaptable objectives that can be partially fulfilled to different degrees. When analyzing potential locations, each site is examined based on the fuzzy criteria of Price, Quality, Delivery Time, Carbon Emission, and Preference. The website that has the highest overall level of goal satisfaction is considered the most optimal choice. This approach guarantees that the chosen location achieves the optimal equilibrium among the conflicting requirements, taking into account both quantitative and qualitative considerations [30-32].
For example, let's suppose a situation where three possible locations are being assessed. Every location is evaluated based on the following criteria: Price (development cost), Quality (infrastructure and service standards), Delivery Time (time needed to make the location functional), Carbon Emission (environmental impact of development and operations), and Preference (conformity with stakeholder objectives). The Analytic Hierarchy Process (AHP) is utilized to determine the respective weights of these criteria through pairwise comparisons [33]. This process yields weights of 0.25 for Price, 0.20 for Quality, 0.15 for Delivery Time, 0.30 for Carbon Emission, and 0.10 for Preference. The weights provided represent the level of importance assigned to each criterion by the decision-makers. Subsequently, the FGP model is constructed utilizing the specified weights and the fuzzy goals assigned to each criterion [34]. For example, the Price aim can be described as a fuzzy set with a membership function that gradually diminishes as expenses rise, indicating a preference for lower prices but still allowing for greater costs within an acceptable range. Similarly, the Quality aim could be represented by a membership function that exhibits an upward trend as the standards of infrastructure and services improve, but with diminishing marginal rewards at the greatest levels of quality. The delivery time can be represented to account for the urgency of establishing the location, prioritizing shorter durations while allowing for some flexibility for longer periods. The carbon emission targets prioritize fewer emissions, employing a membership function that diminishes as emissions rise, indicating a significant inclination towards ecologically sound choices. Preference criteria would encompass stakeholder-specific requirements, such as the proximity to important markets or the alignment with corporate goals, using a membership function customized to meet these specific demands.
Subsequently, every possible location is assessed based on these ambiguous objectives, leading to a collection of satisfaction levels for each criterion. The FGP model combines these satisfaction levels to determine the overall level of goal attainment for each location. The best site is determined by selecting the place with the highest overall satisfaction level. This ensures a well-rounded solution that takes into consideration the various aspects of sustainability and the preferences of stakeholders.
The utilization of both Analytic Hierarchy Process (AHP) and Fuzzy Goal Programming (FGP) in the process of selecting a location for regional development has numerous benefits. It facilitates a methodical and organized assessment of various criteria, guaranteeing the inclusion of all pertinent aspects. Utilizing fuzzy logic in FGP improves the adaptability and resilience of the decision-making procedure, tolerating uncertainties and imprecisions in data and preferences. This approach also guarantees that the chosen site is in line with both sustainability targets and stakeholder interests, fostering equitable and sustainable regional growth. This technique combines both quantitative and qualitative assessments to create a comprehensive framework for making well-informed and balanced judgments in complicated and unpredictable situations. The utilization of both Analytic Hierarchy Process (AHP) and Fuzzy Goal Programming (FGP) offers a potent method for optimizing the selection of locations in regional growth. This strategy ensures that the selected location achieves the optimal overall balance among conflicting objectives by systematically prioritizing criteria and taking into account uncertainties and stakeholder preferences. It promotes sustainable and informed decision-making.
The supplier selection and evaluation process are very flexible, it depends on the situation and industry, so there is no single way. However, there are several methods that can be used in supplier selection and evaluation, each method has its own advantages depending on the needs of the company [35]. Some of these studies use heuristic methods: using Genetic Algorithm with the objective function of price and reliability, reliability is related to the supplier's ability to meet the company's needs precisely, using two heuristic methods namely Particle Swarm Optimization (PSO) and Differential Equation (DE) to determine the best supplier and order allocation with the objective function of minimizing fixed costs and purchasing costs, storage and transportation costs. used the best-worst method to determine the weight of the criteria, while a combination of Genetic Algorithm and AHP methods was used to determine the best order and supplier.
Some researches use a combination of MCDM and MILP select suppliers in a composite company using the Best Worst Method for weighting criteria and using MILP with the objective function of maximizing supplier weights for order allocation. Islam et al. [36] weighted the suppliers by integrating DEA with AHP and TOPSIS and used MILP with the objective function of minimizing the emergency order price for order allocation used AHP method for supplier weights and combined Weighted Sum method and ε-constraint method to determine order allocation with six objective functions of cost, economic value, environment, social, risk and inflation [37-39].
Unfortunately, previous studies were deterministic and did not consider uncertainty. Some studies that accommodate uncertainty are as follows: conducted supplier selection using weighted Fuzzy Goal Programming with the objective function of minimizing price, quality and delivery time using the objective functions of price, delivery delay, quality of goods and carbon emissions on rice, wheat, and rye suppliers, this study uses machine learning to forecast the needs of food companies, the model that used is a SMILP stochastic model uses Weighted Additive Function to transform a multi objective function into a single objective with Fuzzy parameters which is further solved by the Resolution Method. Gidiagba et al. [40] Using Fuzzy AHP and Interval TOPSIS methods to determine supplier weighting and Simulation-Optimization to determine order allocation with the objective function of maximizing supplier ranking and minimizing price. Rahman et al. [41] used the Fuzzy ANP method to select the best criteria and sub-criteria, then the Fuzzy Decision-Making Trial and Evaluation (DEMATEL) method was used to see the relationship between the main criteria, then TOPSIS was used to weight suppliers. There are three objective functions used, which is minimizing the cost, maximizing the weight of the supplier and maximizing the reliability of the supply chain. Combined fuzzy sets with PROMETHEE II by considering three criteria, which are the basic, ordering, and sustainable criteria in Petrochemical Companies. The integration of Fuzzy AHP with three MCDM methods, namely MABAC (Multi Attribute Border Approximation Area Comparison), WASPAS (Weighted Aggregated Sum-Product Assessment) and TOPSIS (Technique for order preference by similarity to ideal solution) to determine the best supplier in the automotive industry where there are 6 environmental criteria and three conventional criteria namely price, quality and service. uses gray numbers in the DEMATEL method to determine the weight of criteria and the Gray Simple Additive Weighting Technique (GSAW) method to decide the weight of suppliers. This research uses Fuzzy Goal Programming because it can accommodate more than one objective function and there is uncertainty in the form of using fuzzy numbers, Chai et al. [42] using Fuzzy Goal Programming in the selection and allocation of shares in portfolios on the Indian stock exchange. Meanwhile, related to the problem of selecting FFB suppliers, Ho et al. [43] conducted the selection and allocation of FFB suppliers with the objective functions of operational costs, transportation costs, CPO production costs, and process costs and palm oil waste, the model was solved using the Generalized Reduced Gradient Method, selected palm oil suppliers with criteria such as quality, delivery, price, service etc. using the PROMETHEE supplier weighting method [44, 45]. We will then solve the supplier selection problem that involves environmental consideration, decision-maker preferences, and resource uncertainty in the palm oil industry based on research on the application of fuzzy multicriteria questions.
2.1 Mathematical model
Objective Function:
$\min P=\sum\limits_{s=1}^{S}{\sum\limits_{j=1}^{J}{\sum\limits_{t=1}^{T}{\left[ {{P}_{s}}.{{Q}_{sjt}}+{{O}_{sj}}.{{Z}_{sjt}}+PIv.I{{v}_{jt}} \right]}}}$ (1)
$\min Q=\sum\limits_{s=1}^{S}{\sum\limits_{j=1}^{J}{\sum\limits_{t=1}^{T}{\left[ \frac{\overline{q{{d}_{sj}}}}{{{q}_{sjt}}} \right]}}}.{{Z}_{sjt}}$ (2)
$\min T=\sum\limits_{s=1}^{S}{\sum\limits_{j=1}^{J}{\sum\limits_{t=1}^{T}{\left[ \frac{\lambda }{{{C}_{st}}}.{{Q}_{sjt}}+\sum\limits_{s=1}^{S}{\sum\limits_{j=1}^{J}{\sum\limits_{t=1}^{T}{\frac{{{h}_{sj}}}{Vt}.{{Z}_{sjt}}}}} \right]}}}$ (3)
$\begin{align} & \min C=\sum\limits_{s=1}^{S}{\sum\limits_{j=1}^{J}{\sum\limits_{t=1}^{T}{\left[ TE.{{h}_{sj}} \right]}}}.{{Z}_{sjt}} \\ & +\left( P{{E}_{jt}}.{{Q}_{sjt}}+I{{v}_{e}}.I{{v}_{jt}} \right) \\\end{align}$ (4)
$\max S=\sum\limits_{s=1}^{S}{\sum\limits_{j=1}^{J}{\sum\limits_{t=1}^{T}{{{W}_{s}}}}}.{{Q}_{sjt}}$ (5)
Subject to:
$\begin{matrix} \sum\limits_{s=1}^{S}{{{Q}_{jst}}}={{D}_{jt}}-I{{v}_{jt}}; & \forall j,t \\\end{matrix}$ (6)
$\begin{matrix} {{Q}_{jst}}\le {{C}_{st}}.{{Z}_{sjt}}; & \forall s,j,t \\\end{matrix}$ (7)
$\sum\limits_{s=1}^{S}{{{W}_{s}}}=1$ (8)
$\begin{matrix} {{Q}_{jst}}\ge 0, & {{Z}_{sjt}}\in \left\{ 0,1 \right\}; & \forall s,j,t \\\end{matrix}$ (9)
Eq. (1) shows that the objective function of minimizing costs is the sum of FFB costs, ordering costs and CPO inventory storage costs. Eq. (2) shows the quality objective function, which is to minimize the rejection of FFB. Eq. (3) shows the time objective function, which is the sum of FFB production time and delivery time. Eq. (4) shows the carbon emission objective function, which is the sum total of carbon emissions for vehicles, FFB processing and CPO inventory storage. Eq. (5) shows the expert's preference for the selected supplier which was determined using AHP. Eq. (6) defines the FFB requirement of POM and CPO inventory by POM, constraint (7) ensures that suppliers do not supply FFB beyond their capacity, Eq. (8) defines supplier weights, constraint (9) is a positive value constraint for order allocation and binary variables.
2.2 Analytical Hierarchy Process
The Analytical Hierarchy Process (AHP) is a systematic method for arranging and evaluating intricate decisions using principles from mathematics and psychology. It aids decision - makers in establishing priorities and making optimal judgments by simplifying intricate choices into a sequence of pairwise comparisons, then subsequently combining the outcomes.
|
AHP Algorithm in Selection |
|
Step 1: Define the Problem and Goal Goal: Optimal location selection for regional development. Step 2: Structure the Hierarchy Level 1: Goal Level 2: Criteria (Price, Quality, Delivery Time, Carbon Emission, Preference) Level 3: Sub-criteria (if any; in this case, we assume the main criteria are sufficient) Step 3: Construct Pairwise Comparison Matrices Compare each pair of criteria with respect to their importance towards achieving the goal. Use a scale of 1 to 9, where 1 indicates equal importance and 9 indicates extreme importance of one criterion over the other. Step 4: Calculate Criteria Weights Normalize the pairwise comparison matrices. Compute the eigenvector (priority vector) for each matrix, representing the relative weights of the criteria. Ensure consistency by calculating the Consistency Ratio (CR). A CR less than 0.1 is generally acceptable. |
1. The weight for each row in a column will be summed up (si).
${{s}_{i}}=\sum\limits_{i=1}^{n}{{{a}_{ij}}}$
2. Each entry will be normalized, thus normalized entries are obtained bij.
${{b}_{ij}}=\frac{{{a}_{ij}}}{{{s}_{i}}}$
3. The weight for the attribute will be obtained by dividing it by the number of columns.
${{b}_{ij}}=\frac{1}{m}\left( \sum\limits_{j=1}^{m}{{{b}_{ij}}} \right)$
4. Weight of criteria as follow:
${{p}_{i}}=\sum\limits_{k=1}^{K}{b_{k}^{(0)}}.b_{i}^{k}$
where, pi=Weight criteria; $b_k^{(0)}$=Weight provided by pairwise comparison of criteria; $b_i^k$=Weight provided by pairwise comparison of alternative considering the criterion.
2.3 Fuzzy Goal Programming
Fuzzy Goal Programming (FGP) is an enhanced version of Goal Programming that integrates fuzzy logic to effectively manage the uncertainty and imprecision involved in decision-making.
|
Fuzzy Goal Programming Algorithm |
|
Step 1: Define Goals and Fuzzy Goals Goals are defined for each criterion with a desired target value and acceptable range. Price: Minimize cost Quality: Maximize quality score Delivery Time: Minimize time Carbon Emission: Minimize emissions Preference: Maximize alignment Step 2: Formulate Fuzzy Membership Functions Each criterion is represented by a fuzzy membership function to capture the degree of satisfaction. Step 3: Construct the FGP Model The objective function aims to maximize the overall degree of goal satisfaction, aggregated across all criteria. Incorporate the criteria weights from AHP into the FGP model. General Equation for FGP: \[\max Z=\sum\limits_{i=1}^{n}{{{w}_{i}}}{{\mu }_{i}}\left( {{x}_{i}} \right)\] where, wi is the weight of the i-th criterion from AHP, μi is membership function for the i-th criterion, xi is the decision variable for the i-th criterion, and n is the number of criteria. Step 4: Solve the FGP Model Using linear programming or other suitable optimization techniques, solve the model to find the values of decision variables xi that maximize Z. |
This detailed methodology ensures transparency and justifies the selection process by explicitly showing how criteria and sub-criteria are evaluated, weighted, and aggregated to make an informed decision. This approach provides a robust framework for balancing sustainability and stakeholder preferences in location selection for regional development.
a. Establish a fuzzy membership objective function as follows:
${{\theta }_{k}}=\left\{ \begin{matrix} \begin{matrix} 0, & if & {{F}_{k}}\ge F_{k}^{\alpha -aspire} \\\end{matrix} \\ \begin{matrix} \frac{F_{k}^{\alpha -acc}-{{F}_{k}}}{F_{k}^{\alpha -acc}-F_{k}^{\alpha -aspire}}, & if & F_{k}^{\alpha -aspire}<{{F}_{k}}<F_{k}^{\alpha -acc} \\\end{matrix} \\ \begin{matrix} 1, & if & {{F}_{k}}\le F_{k}^{\alpha -acc} \\\end{matrix} \\\end{matrix} \right.$
where, $F_k^{\alpha-a s p i r e}$ is lower bound of objective function and $F_k^{\alpha-a c c}$ is upper bound of objective function.
b. Determine the priority weights for each objective function NFWk to transform the multiobjective function to single objective:
$\max \sum\limits_{k=1}^{K}{NF{{W}_{k}}.{{\theta }_{k}}}$ (10)
Subject to:
$\begin{matrix} \sum\limits_{k=1}^{K}{NF{{W}_{k}}=1} & \forall k \\\end{matrix}$ (11)
${{\theta }_{k}}\le 1$ (12)
$\frac{F_{k}^{\alpha -acc}-{{F}_{k}}}{F_{k}^{\alpha -acc}-F_{k}^{\alpha -aspire}}={{\theta }_{k}}$ (13)
$\begin{matrix} \sum\limits_{S=1}^{S}{{{I}_{fsjt}}={{D}_{fjt}},} & \forall f;\forall j;\forall t \\\end{matrix}$ (14)
${{I}_{fsjt}}\le C{{S}_{fs}}.{{Z}_{fsjt}},\forall f;\forall s;\forall j;\forall t$ (15)
${{Z}_{fsjt}}\in \left\{ 0,1 \right\}\forall f;\forall s;\forall j;\forall t$ (16)
This study used a case example of 4 Palm Oil Mills (POM), 8 suppliers and 12 time periods. The model is solved using LINGO 19. With the following data in Tables 1-8.
The number of rejected FFBs is uncertain due to the fluctuating nature of the data and the possibility of miscalculation. Thus triangular fuzzy numbers are used where the upper limit is an addition for 15 percent of the rejected quantity, the lower limit is a reduction for 10 percent of the rejected quantity.
1. Vehicle speed is assumed to be (Vt) 50 Km/hour.
2. Carbon emission for truck type vehicle (TE) is 0.549 Ton CO2/Km, assuming the number of trucks passing in one period is 25, then the carbon emission for transportation becomes TE=0.549×25.
3. Carbon emission for FFB processing TBS (PEjt) is assumed to be 1.423 Ton CO2/Ton.
4. Carbon emission for CPO storage (IvE) assumed 0.95 Ton CO2/Ton.
Qualitative criteria are used to determine the weight of suppliers, the qualitative criteria used are: Reputation (C1) shows how good the supplier brand, Quality Management (C2) shows how good the supplier's governance. Communication Convenience (C3) shows how good the supplier response is if there is a complaint. Historical Relationship (C4) shows how good the relationship has been established in the past between POM and related suppliers. Quality (C5) shows how good the quality of FFB delivered by the supplier based on the assessment of the decision maker. The steps for solving the model are presented in the following.
Table 1. Ordering cost (Osj) (Rp) for each period (in units of hundreds of thousands of rupiah)
|
Supplier |
Palm Oil Mills (POM) |
|||
|
1 |
2 |
3 |
4 |
|
|
1 |
8.13 |
9.24 |
9.47 |
5.2 |
|
2 |
8.81 |
5.66 |
5.21 |
7.04 |
|
3 |
7.05 |
9.3 |
9.55 |
9.51 |
|
4 |
6.94 |
7.03 |
6.91 |
6.78 |
|
5 |
9.99 |
6.38 |
8.67 |
5.96 |
|
6 |
6.62 |
6.25 |
6.32 |
7.96 |
|
7 |
9.99 |
9.09 |
9.36 |
8.55 |
|
8 |
6.17 |
8.78 |
5 |
8.71 |
Table 2. Demand of FFB for each period (Ivjt) (Ton)
|
POM |
Period |
|||||||||||
|
1 |
2 |
3 |
4 |
5 |
6 |
7 |
8 |
9 |
10 |
11 |
12 |
|
|
1 |
568 |
622 |
447 |
687 |
684 |
546 |
543 |
815 |
466 |
535 |
576 |
710 |
|
2 |
551 |
580 |
692 |
693 |
529 |
663 |
583 |
575 |
591 |
499 |
618 |
449 |
|
3 |
497 |
669 |
626 |
653 |
649 |
594 |
728 |
664 |
578 |
589 |
674 |
522 |
|
4 |
540 |
602 |
547 |
549 |
493 |
660 |
498 |
640 |
765 |
491 |
596 |
607 |
Table 3. Demand of FFB for each POM (Djt) (Ton)
|
POM |
Period |
|||||||||||
|
1 |
2 |
3 |
4 |
5 |
6 |
7 |
8 |
9 |
10 |
11 |
12 |
|
|
1 |
5.148 |
5.192 |
5.324 |
4.950 |
4.961 |
5.104 |
4.983 |
5.225 |
4.873 |
4.940 |
5.412 |
4.000 |
|
2 |
4.554 |
4.961 |
5.038 |
4.080 |
4.230 |
5.258 |
5.390 |
5.071 |
5.005 |
4.520 |
5.093 |
4.884 |
|
3 |
5.357 |
4.741 |
4.220 |
4.030 |
4.330 |
5.324 |
5.324 |
4.873 |
4.873 |
4.470 |
4.510 |
5.269 |
|
4 |
4.796 |
5.236 |
4.774 |
4.830 |
4.300 |
4.600 |
4.970 |
4.796 |
5.137 |
5.049 |
4.939 |
4.220 |
Table 4. Accepted FFB from each supplier in previous period (qdsj) (Ton)
|
Supplier |
Palm Oil Mills (POM) |
|||
|
1 |
2 |
3 |
4 |
|
|
1 |
4.183 |
2.096 |
2.749 |
4.861 |
|
2 |
3.226 |
2.856 |
2.981 |
3.802 |
|
3 |
4.570 |
3.155 |
4.814 |
4.400 |
|
4 |
4.105 |
2.749 |
4.503 |
2.078 |
|
5 |
2.262 |
2.702 |
2.668 |
4.631 |
|
6 |
4.570 |
4.135 |
4.964 |
4.586 |
|
7 |
2.303 |
2.382 |
3.806 |
4.331 |
|
8 |
3.559 |
4.353 |
3.730 |
2.385 |
Table 5. Rejected FFB in previous period (qcsj) in previous period
|
Supplier |
Palm Oil Mills (POM) |
|||
|
1 |
2 |
3 |
4 |
|
|
1 |
453 |
258 |
356 |
400 |
|
2 |
272 |
453 |
435 |
495 |
|
3 |
380 |
495 |
220 |
401 |
|
4 |
437 |
469 |
367 |
330 |
|
5 |
243 |
222 |
299 |
490 |
|
6 |
491 |
386 |
327 |
396 |
|
7 |
427 |
343 |
352 |
437 |
|
8 |
243 |
325 |
324 |
325 |
Table 6. Total production off FFB for earch supplier (qcsj) (Ton)
|
Supplier |
Period (t) |
|||||||||||
|
1 |
2 |
3 |
4 |
5 |
6 |
7 |
8 |
9 |
10 |
11 |
12 |
|
|
1 |
19.28 |
16.77 |
18.43 |
16.14 |
17.74 |
16.01 |
16.52 |
18.06 |
17.34 |
16.16 |
16.24 |
19.25 |
|
2 |
18.8 |
17.46 |
18.51 |
17.36 |
18.5 |
17.56 |
19.28 |
17.1 |
19.36 |
19.54 |
19.14 |
18.02 |
|
3 |
18.54 |
19.76 |
18.98 |
19.43 |
19.28 |
17.44 |
17.79 |
18.8 |
18.21 |
17.94 |
16.44 |
19.75 |
|
4 |
19.4 |
16.4 |
16.43 |
17.67 |
16.54 |
16.43 |
19.1 |
18.74 |
16.4 |
16.21 |
18.58 |
19.06 |
|
5 |
19.06 |
19.52 |
18.62 |
17.21 |
17.2 |
17.9 |
17.02 |
19.85 |
17.72 |
17.95 |
17.57 |
16.23 |
|
6 |
19.99 |
19.89 |
18.37 |
16.06 |
16.79 |
18.78 |
17.08 |
19.82 |
18.33 |
18.06 |
19.01 |
19.09 |
|
7 |
17.73 |
17.05 |
19.46 |
17.39 |
18.11 |
16.14 |
17.87 |
18.45 |
19.55 |
18.3 |
17.38 |
16.11 |
|
8 |
19.12 |
16.17 |
16.89 |
16.06 |
17.88 |
19.31 |
17.03 |
18.4 |
16 |
18.23 |
18.66 |
19.33 |
Table 7. Distance from supplier to POM (hsj) (Km)
|
Supplier |
Palm Oil Mills (POM) |
|||
|
1 |
2 |
3 |
4 |
|
|
1 |
8 |
13 |
8 |
10 |
|
2 |
9 |
29 |
19 |
23 |
|
3 |
22 |
18 |
16 |
23 |
|
4 |
21 |
11 |
10 |
12 |
|
5 |
24 |
16 |
16 |
28 |
|
6 |
19 |
23 |
28 |
25 |
|
7 |
26 |
18 |
14 |
26 |
|
8 |
17 |
6 |
7 |
28 |
Table 8. Weight of Supplier which is provided by using AHP
|
Supplier |
|||||||
|
1 |
2 |
3 |
4 |
5 |
6 |
7 |
8 |
|
0.13 |
0.14 |
0.15 |
0.1 |
0.07 |
0.17 |
0.12 |
0.13 |
3.1 Determining supplier weight
1. Performing a comparison of each criterion to produce a pairwise comparison table as follows Table 9.
Table 9. Pairwise comparison
|
Criteria |
C1 |
C2 |
C3 |
C4 |
C5 |
|
C1 |
1 |
3 |
5 |
3 |
0.3 |
|
C2 |
0.3 |
1 |
0.3 |
0.3 |
0.2 |
|
C3 |
0.2 |
3 |
1 |
0.3 |
0.3 |
|
C4 |
0.3 |
3 |
3 |
1 |
0.3 |
|
C5 |
3 |
5 |
3 |
3 |
1 |
2. Determine the assessment for each alternative (supplier) based on the criteria used. Table 10 shows an example for assessment on reputation.
Table 10. Pairwise comparison for reputation
|
C1 |
P1 |
P2 |
P3 |
P4 |
P5 |
P6 |
P7 |
P8 |
|
P1 |
1 |
3 |
1 |
0.3 |
5 |
0.3 |
1 |
3 |
|
P2 |
0.3 |
1 |
5 |
3 |
1 |
0.2 |
3 |
1 |
|
P3 |
1 |
0.2 |
1 |
0.3 |
1 |
1 |
3 |
0.2 |
|
P4 |
3 |
0.3 |
3 |
1 |
0.3 |
1 |
0.3 |
1 |
|
P5 |
0.2 |
1 |
1 |
3 |
1 |
0.5 |
3 |
1 |
|
P6 |
3 |
5 |
1 |
1 |
2 |
1 |
0.3 |
0.3 |
|
P7 |
1 |
0.3 |
0.3 |
3 |
0.3 |
3 |
1 |
1 |
|
P8 |
0.3 |
1 |
5 |
1 |
1 |
3 |
1 |
1 |
3. Multiplying the weights on the criteria and the weights on the alternatives for each criterion to produce the supplier's weight as follows in Table 11.
Table 11. Supplier weight
|
Weight |
S1 |
S2 |
S3 |
S4 |
S5 |
S6 |
S7 |
S8 |
|
0.13 |
0.14 |
0.15 |
0.10 |
0.07 |
0.17 |
0.12 |
0.13 |
3.2 Fuzzy Goal Programming
Solve each objective function separately for minimum and maximum values, so that the results on the tab are obtained. The supplier weights that have been obtained from the AHP method are used for maximizing the preference of objective function (Table 12).
Table 12. Maximum and Minimum value for objective function
|
No. |
Objective Function |
Maximum |
Minimum |
|
1 |
Cost |
4,059.720 |
3,513.299 |
|
2 |
Quality |
44.70 |
7.95 |
|
3 |
Delivery Time |
3.460 |
2.266 |
|
4 |
Emission |
603.155 |
521.999 |
|
5 |
Preference |
32,777.59 |
17,686.92 |
Performed a comparison for each two objective functions, by making one of the objective functions a constraint. Results are shown in Table 13.
Table 13. Payoff table
|
|
Cost |
Quality |
Delivery Time |
Emission |
Preference |
|
Cost |
3,513.299 |
12.89 |
2,681.42 |
533.377 |
24,448.66 |
|
Quality |
3,513.299 |
7.95 |
2,265.79 |
521.999 |
32,777.59 |
|
Delivery Time |
3,858.873 |
11.49 |
2,265.79 |
530.975 |
32,777.59 |
|
Emission |
3,513.299 |
7.95 |
2,265.79 |
521.999 |
32,777.59 |
|
Preference |
3,513.299 |
7.95 |
2,265.79 |
521.999 |
32,535.90 |
This table provides a comparative analysis of five key factors such as cost, quality, delivery time, emissions, and preferences that are often considered in real-life decision-making scenarios, such as supply chain management or project planning. For instance, in choosing a supplier, a company must balance the cost of goods (cost), the quality of products received (quality), the time taken for delivery (delivery time), the environmental impact of the supply chain (emission), and the overall preference or priority given to these factors (preference). The data shows that while one supplier might offer lower costs, they may also have higher emissions or longer delivery times, necessitating a trade-off analysis to determine the best option that aligns with the company’s strategic goals and values. Hence, the following membership function is defined as follows:
${{\theta }_{\cos t}}=\left\{ \begin{matrix} \begin{matrix} 0, & if & {{F}_{\cos t}}\ge 3.858.873 \\\end{matrix} \\ \begin{matrix} \frac{3.858.873-{{F}_{\cos t}}}{3.858.873-3.513.299}, & if & 3.513.299<{{F}_{\cos t}}<3.858.873 \\\end{matrix} \\ \begin{matrix} 1, & if & {{F}_{\cos t}}\le 3.513.299 \\\end{matrix} \\\end{matrix} \right.$;
${{\theta }_{quality}}=\left\{ \begin{matrix} \begin{matrix} 0, & if & {{F}_{quality}}\ge 12,89 \\\end{matrix} \\ \begin{matrix} \frac{12,89-{{F}_{quality}}}{12,89-7,95}, & if & 7,95<{{F}_{quality}}<12,89 \\\end{matrix} \\ \begin{matrix} 1, & if & {{F}_{quality}}\le 7,95 \\\end{matrix} \\\end{matrix} \right.$;
${{\theta }_{time}}=\left\{ \begin{matrix} \begin{matrix} 0, & if & {{F}_{time}}\ge 2.681,42 \\\end{matrix} \\ \begin{matrix} \frac{2.681,42-{{F}_{time}}}{2.681,42-2.265,79}, & if & 2.265,79<{{F}_{time}}<2.681,42 \\\end{matrix} \\ \begin{matrix} 1, & if & {{F}_{time}}\le 2.265,79 \\\end{matrix} \\\end{matrix} \right.$;
${{\theta }_{emission}}=\left\{ \begin{matrix} \begin{matrix} 0, & if & {{F}_{emission}}\ge 533.277 \\\end{matrix} \\ \begin{matrix} \frac{533.277-{{F}_{emission}}}{533.277-521.999}, & if & 521.999<{{F}_{emission}}<533.277 \\\end{matrix} \\ \begin{matrix} 1, & if & {{F}_{emission}}\le 521.999 \\\end{matrix} \\\end{matrix} \right.$;
${{\theta }_{prefer}}=\left\{ \begin{matrix} \begin{matrix} 0, & if & {{F}_{prefer}}\ge 24.448,66 \\\end{matrix} \\ \begin{matrix} \frac{{{F}_{prefer}}-24.448,66}{32.777,59-24.448,66}, & if & 24.448,66<{{F}_{prefer}}<32.777,59 \\\end{matrix} \\ \begin{matrix} 1, & if & {{F}_{prefer}}\le 32.777,59 \\\end{matrix} \\\end{matrix} \right.$;
Thus the model will be as follows: \[\max \theta =\sum\limits_{k=1}^{S}{{{\theta }_{k}}}\]
Subject to:
$\frac{3.858.873-\sum\limits_{s=1}^{S}{\sum\limits_{j=1}^{J}{\sum\limits_{t=1}^{T}{\left[ {{P}_{s}}.{{Q}_{sjt}}+{{O}_{sj}}.{{Z}_{sjt}}+PIv.I{{v}_{jt}} \right]}}}}{3.858.873-3.513.299}={{\theta }_{1}}$
$\frac{12,89-\sum\limits_{s=1}^{S}{\sum\limits_{j=1}^{J}{\sum\limits_{t=1}^{T}{\left[ \frac{\overline{q{{d}_{sj}}}}{{{q}_{sjt}}} \right]}}}.{{Z}_{sjt}}}{12,89-7,95}={{\theta }_{2}}$
$\frac{2.681,42-\sum\limits_{s=1}^{S}{\sum\limits_{j=1}^{J}{\sum\limits_{t=1}^{T}{\left[ \frac{\lambda }{{{C}_{st}}}.{{Q}_{sjt}}+\sum\limits_{s=1}^{S}{\sum\limits_{j=1}^{J}{\sum\limits_{t=1}^{T}{\frac{{{h}_{sj}}}{Vt}.{{Z}_{sjt}}}}} \right]}}}}{2.681,42-2.265,79}={{\theta }_{3}}$
$\frac{533.377-\sum\limits_{s=1}^{S}{\sum\limits_{j=1}^{J}{\sum\limits_{t=1}^{T}{\left[ TE.{{h}_{sj}} \right]}}}.{{Z}_{sjt}}+\left( P{{E}_{jt}}.{{Q}_{sjt}}+I{{v}_{e}}.I{{v}_{jt}} \right)}{533.377-521.999}={{\theta }_{4}}$
$\frac{{{F}_{prefer}}-\sum\limits_{s=1}^{S}{\sum\limits_{j=1}^{J}{\sum\limits_{t=1}^{T}{{{W}_{s}}}}}.{{Q}_{sjt}}}{32.777,59-24.448,66}={{\theta }_{5}}$
$\sum\limits_{s=1}^{S}{{{Q}_{jst}}={{D}_{jt}}-I{{v}_{jt}}}$
$\begin{matrix} {{Q}_{jst}}\le {{C}_{st}}.{{Z}_{sjt}} & ;\forall s,j,t \\\end{matrix}$
$\sum\limits_{s=1}^{S}{{{W}_{s}}}=1$
$\begin{matrix} {{I}_{fsjt}}\ge 0, & \forall f,s,j,t \\\end{matrix}$
$\begin{matrix} {{Z}_{fsjt}}\in \left\{ 0,1 \right\}, & \forall f,s,j,t \\\end{matrix}$
3.3 Experimental simulation
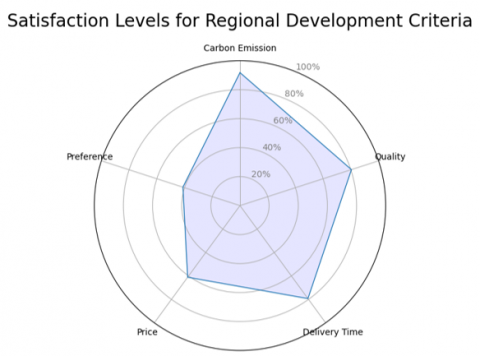
We use python to simulate the experimental result in the Figure 1.
Figure 1. Satisfaction levels for regional development
The radar chart effectively visualizes the trade-offs and priorities in regional development decision-making. It shows that while sustainability and operational efficiency are important, there is a need for better alignment of decision-makers' preferences with these goals. This analysis provides insights into the complexities of regional development and the importance of considering multiple criteria in decision-making processes. Carbon Emission has the highest satisfaction level at 91.76%, indicating that sustainability is highly prioritized in the decision-making process. Quality and Delivery Time also show high satisfaction levels (80.4% and 79.3%, respectively), emphasizing their importance in supplier selection. Price has a moderate satisfaction level of 61.11%, suggesting that while cost is important, it is not the primary driver in this context. Preference has the lowest satisfaction level at 41.18%, indicating a significant mismatch between decision-makers' priorities and the other criteria, or that it may be challenging to balance all criteria simultaneously.
Carbon emission had the highest satisfaction level (91.76%) in the survey. This shows that supply chain decision-making prioritizes sustainability. Quality and delivery time satisfaction were high (80.4% and 79.3%), showing their importance in supplier selection. However, price and preference satisfaction were lower at 61.11% and 41.18%. This means that cost is important, but not the key driver in this circumstance. The significant decline in preference satisfaction shows a mismatch between decision-makers' priorities and the other examined factors, or that it may be difficult to balance all the criteria. The results show that palm oil source selection is complicated. They illustrate that while sustainability and operational efficiency are important, decision-makers' preferences must be better aligned with these goals. This analysis illuminates the trade-offs and priorities needed for a sustainable supply chain. The proposed AHP and FGP integrated model has shown trade-offs across criteria, however its limitations and future research prospects must be severely examined. Pairwise comparisons are used to determine criteria weights in the AHP technique, which introduces subjectivity. Decision-makers may make inconsistent assessments, affecting findings robustness. Fuzzy membership functions and parameters might be subjective, but FGP uses fuzzy logic to handle uncertainty. Different definitions of acceptable ranges and satisfaction may yield different results. Delphi method or machine learning algorithms that learn from past decision-making patterns could be used in criteria weighting studies to reduce subjectivity. Real-time data analytics and supply chain management system integration can improve decision-making speed and accuracy. Integration allows continual supplier performance monitoring and appraisal.
The research was funded by the Research Institute of the Universitas Sumatera Utara (Grant No.: 75/UN5.4.10.S/PPM/KP-TALENTA/RB1/2024).
[1] Gupta, S., Chatterjee, P., Rastogi, R., Gonzalez, E.D.S. (2023). A Delphi fuzzy analytic hierarchy process framework for criteria classification and prioritization in food supply chains under uncertainty. Decision Analytics Journal, 7: 100217. https://doi.org/10.1016/j.dajour.2023.100217
[2] Ali, H., Zhang, J. (2023). A fuzzy multi-objective decision-making model for global green supplier selection and order allocation under quantity discounts. Expert Systems with Applications, 225: 120119. https://doi.org/10.1016/j.eswa.2023.120119
[3] Xu, L., Hu, X., Zhang, Y., Feng, J., Luo, S. (2024). A fuzzy multiobjective team decision model for CODP and supplier selection in customized logistics service supply chain. Expert Systems with Applications, 237: 121387. https://doi.org/10.1016/j.eswa.2023.121387
[4] Moslem, S., Gündoğdu, F.K., Saylam, S., Pilla, F. (2024). A hybrid decomposed fuzzy multi-criteria decision-making model for optimizing parcel lockers location in the last-mile delivery landscape. Applied Soft Computing, 154: 111321. https://doi.org/10.1016/j.asoc.2024.111321
[5] Tavana, M., Khosrojerdi, G., Mina, H., Rahman, A. (2019). A hybrid mathematical programming model for optimal project portfolio selection using fuzzy inference system and analytic hierarchy process. Evaluation and Program Planning, 77: 101703. https://doi.org/10.1016/j.evalprogplan.2019.101703
[6] Wang, Y.M., Chin, K.S. (2008). A linear goal programming priority method for fuzzy analytic hierarchy process and its applications in new product screening. International Journal of Approximate Reasoning, 49(2): 451-465. https://doi.org/10.1016/j.ijar.2008.04.004
[7] Sugapriya, C., Nagarajan, D., Gobinath, V.M., Kuppulakshmi, V. (2023). A multi-period optimization model for medicine supply chains using modified interactive multi-objective fuzzy programming. Supply Chain Analytics, 4: 100048. https://doi.org/10.1016/j.sca.2023.100048
[8] Hendiani, S., Mahmoudi, A., Liao, H. (2020). A multi-stage multi-criteria hierarchical decision-making approach for sustainable supplier selection. Applied Soft Computing, 94: 106456. https://doi.org/10.1016/j.asoc.2020.106456
[9] Deretarla, Ö., Erdebilli, B., Gündoğan, M. (2023). An integrated analytic hierarchy process and complex proportional assessment for vendor selection in supply chain management. Decision Analytics Journal, 6: 100155. https://doi.org/10.1016/j.dajour.2022.100155
[10] Lauron, H.J., Abellana, D.P.M. (2024). An integrated fuzzy multi-criteria decision-making model for determining the interdependencies among the African swine fever spread factors. Decision Analytics Journal, 11: 100454. https://doi.org/10.1016/j.dajour.2024.100454
[11] Sarkar, S., Pratihar, D.K., Sarkar, B. (2018). An integrated fuzzy multiple criteria supplier selection approach and its application in a welding company. Journal of Manufacturing Systems, 46: 163-178. https://doi.org/10.1016/j.jmsy.2017.12.004
[12] Dagistanli, H.A., Üstün, Ö. (2023). An integrated multi-criteria decision making and multi-choice conic goal programming approach for customer evaluation and manager assignment. Decision Analytics Journal, 8: 100270. https://doi.org/10.1016/j.dajour.2023.100270
[13] Tayyab, M., Sarkar, B. (2021). An interactive fuzzy programming approach for a sustainable supplier selection under textile supply chain management. Computers & Industrial Engineering, 155: 107164. https://doi.org/10.1016/j.cie.2021.107164
[14] Nasr, A.K., Tavana, M., Alavi, B., Mina, H. (2021). A novel fuzzy multi-objective circular supplier selection and order allocation model for sustainable closed-loop supply chains. Journal of Cleaner Production, 287: 124994. https://doi.org/10.1016/j.jclepro.2020.124994
[15] Singh, R.R., Zindani, D., Maity, S.R. (2024). A novel fuzzy-prospect theory approach for hydrogen fuel cell component supplier selection for automotive industry. Expert Systems with Applications, 246: 123142. https://doi.org/10.1016/j.eswa.2024.123142
[16] Tirkolaee, E.B., Mardani, A., Dashtian, Z., Soltani, M., Weber, G.W. (2020). A novel hybrid method using fuzzy decision making and multi-objective programming for sustainable-reliable supplier selection in two-echelon supply chain design. Journal of Cleaner Production, 250: 119517. https://doi.org/10.1016/j.jclepro.2019.119517
[17] Mirzaee, H., Naderi, B., Pasandideh, S.H.R. (2018). A preemptive fuzzy goal programming model for generalized supplier selection and order allocation with incremental discount. Computers & Industrial Engineering, 122: 292-302. https://doi.org/10.1016/j.cie.2018.05.042
[18] Nazari-Shirkouhi, S., Jalalat, S.M., Sangari, M.S., Sepehri, A., Vandchali, H.R. (2023). A robust-fuzzy multi-objective optimization approach for a supplier selection and order allocation problem: Improving sustainability under uncertainty. Computers & Industrial Engineering, 186: 109757. https://doi.org/10.1016/j.cie.2023.109757
[19] Sun, B., Song, X., Li, W., Liu, L., Gong, G., Zhao, Y. (2024). A user review data-driven supplier ranking model using aspect-based sentiment analysis and fuzzy theory. Engineering Applications of Artificial Intelligence, 127: 107224. https://doi.org/10.1016/j.engappai.2023.107224
[20] Vaezi, A., Rabbani, E., Yazdian, S.A. (2024). Blockchain-integrated sustainable supplier selection and order allocation: A hybrid BWM-MULTIMOORA and bi-objective programming approach. Journal of Cleaner Production, 444: 141216. https://doi.org/10.1016/j.jclepro.2024.141216
[21] Hashmi, N., Jalil, S.A., Javaid, S. (2021). Carbon footprint based multi-objective supplier selection problem with uncertain parameters and fuzzy linguistic preferences. Sustainable Operations and Computers, 2: 20-29. https://doi.org/10.1016/j.susoc.2021.03.001
[22] Mavi, R.K., Zarbakhshnia, N., Mavi, N.K., Kazemi, S. (2023). Clustering sustainable suppliers in the plastics industry: A fuzzy equivalence relation approach. Journal of Environmental Management, 345: 118811. https://doi.org/10.1016/j.jenvman.2023.118811
[23] Cebi, S., Gündoğdu, F.K., Kahraman, C. (2023). Consideration of reciprocal judgments through decomposed fuzzy analytical hierarchy process: A case study in the pharmaceutical industry. Applied Soft Computing, 134: 110000. https://doi.org/10.1016/j.asoc.2023.110000
[24] Sahoo, D., Parida, P.K., Pati, B. (2024). Efficient fuzzy multi-criteria decision-making for optimal college location selection: A comparative study of min–max fuzzy TOPSIS approach. Results in Control and Optimization, 15: 100422. https://doi.org/10.1016/j.rico.2024.100422
[25] Saputro, T.E., Rosiani, T.Y., Mubin, A., Dewi, S.K., Baroto, T. (2024). Green supplier selection under supply risks using novel integrated fuzzy multi-criteria decision making techniques. Journal of Cleaner Production, 449: 141788. https://doi.org/10.1016/j.jclepro.2024.141788
[26] Chen, Z., Hammad, A.W., Waller, S.T., Haddad, A.N. (2023). Modelling supplier selection and material purchasing for the construction supply chain in a fuzzy scenario-based environment. Automation in Construction, 150: 104847. https://doi.org/10.1016/j.autcon.2023.104847
[27] Kilic, H.S., Yalcin, A.S. (2020). Modified two-phase fuzzy goal programming integrated with IF-TOPSIS for green supplier selection. Applied Soft Computing, 93: 106371. https://doi.org/10.1016/j.asoc.2020.106371
[28] Sahin, G., Akkus, I., Koc, A., van Sark, W. (2024). Multi-criteria solar power plant siting problem solution using a GIS-Taguchi loss function based interval type-2 fuzzy approach: The case of Kars Province/Turkey. Heliyon, 10(10): e30993. https://doi.org/10.1016/j.heliyon.2024.e30993
[29] Firouzi, F., Jadidi, O. (2021). Multi-objective model for supplier selection and order allocation problem with fuzzy parameters. Expert Systems with Applications, 180: 115129. https://doi.org/10.1016/j.eswa.2021.115129
[30] Ransikarbum, K., Pitakaso, R. (2024). Multi-objective optimization design of sustainable biofuel network with integrated fuzzy analytic hierarchy process. Expert Systems with Applications, 240: 122586. https://doi.org/10.1016/j.eswa.2023.122586
[31] Wichapa, N., Khokhajaikiat, P. (2017). Solving multi-objective facility location problem using the fuzzy analytical hierarchy process and goal programming: A case study on infectious waste disposal centers. Operations Research Perspectives, 4: 39-48. https://doi.org/10.1016/j.orp.2017.03.002
[32] Rajput, L., Beg, I., Kumar, S. (2024). Spherical fuzzy analytic hierarchy process and linear assignment model based MCGDM method with its application in ranking of states for their business climate. Expert Systems with Applications, 238: 122247. https://doi.org/10.1016/j.eswa.2023.122247
[33] Masoomi, B., Sahebi, I.G., Fathi, M., Yıldırım, F., Ghorbani, S. (2022). Strategic supplier selection for renewable energy supply chain under green capabilities (fuzzy BWM-WASPAS-COPRAS approach). Energy Strategy Reviews, 40: 100815. https://doi.org/10.1016/j.esr.2022.100815
[34] Demiralay, E., Paksoy, T. (2022). Strategy development for supplier selection process with smart and sustainable criteria in fuzzy environment. Cleaner Logistics and Supply Chain, 5: 100076. https://doi.org/10.1016/j.clscn.2022.100076
[35] Nguyen, P.H., Tran, T.H., Nguyen, L.A.T., Pham, H.A., Pham, M.A.T. (2023). Streamlining apartment provider evaluation: A spherical fuzzy multi-criteria decision-making model. Heliyon, 9(12): e22353. https://doi.org/10.1016/j.heliyon.2023.e22353
[36] Islam, S., Amin, S.H., Wardley, L.J. (2022). Supplier selection and order allocation planning using predictive analytics and multi-objective programming. Computers & Industrial Engineering, 174: 108825. https://doi.org/10.1016/j.cie.2022.108825
[37] Sivakumar, K., Appasamy, S. (2024). Fuzzy Mathematical approach for solving multi-objective fuzzy linear fractional programming problem with trapezoidal fuzzy numbers. Mathematical Modelling of Engineering Problems, 11(1): 255-262. https://doi.org/10.18280/mmep.110128
[38] Gkountakou, F.I., Konguetsof, A., Souliotis, G., Papadopoulos, B.K. (2023). A novel approach to fuzzy implication through fuzzy linear regression. Mathematical Modelling of Engineering Problems, 10(6): 1927-1936. https://doi.org/10.18280/mmep.100602
[39] Serrat, A., Djebbar, B. (2022). Solving symmetrical drop suspended equilibrium equation by artificial bee colony programming. Mathematical Modelling of Engineering Problems, 9(2): 507-514. https://doi.org/10.18280/mmep.090229
[40] Gidiagba, J., Tartibu, L., Okwu, M. (2023). Sustainable supplier selection in the oil and gas industry: An integrated multi-criteria decision making approach. Procedia Computer Science, 217: 1243-1255. https://doi.org/10.1016/j.procs.2022.12.323
[41] Rahman, M.M., Bari, A.M., Ali, S.M., Taghipour, A. (2022). Sustainable supplier selection in the textile dyeing industry: An integrated multi-criteria decision analytics approach. Resources, Conservation & Recycling Advances, 15: 200117. https://doi.org/10.1016/j.rcradv.2022.200117
[42] Chai, N., Zhou, W., Jiang, Z. (2023). Sustainable supplier selection using an intuitionistic and interval-valued fuzzy MCDM approach based on cumulative prospect theory. Information Sciences, 626: 710-737. https://doi.org/10.1016/j.ins.2023.01.070
[43] Ho, J.Y., Ooi, J., Wan, Y.K., Andiappan, V. (2021). Synthesis of wastewater treatment process (WWTP) and supplier selection via Fuzzy Analytic Hierarchy Process (FAHP). Journal of Cleaner Production, 314: 128104. https://doi.org/10.1016/j.jclepro.2021.128104
[44] Mina, H., Kannan, D., Gholami-Zanjani, S.M., Biuki, M. (2021). Transition towards circular supplier selection in petrochemical industry: A hybrid approach to achieve sustainable development goals. Journal of Cleaner Production, 286: 125273. https://doi.org/10.1016/j.jclepro.2020.125273
[45] Rahman, M.M., Syahputra, M.R., Marpaung, T.J., Marpaung, J.L. (2023). Computational assessment of wave stability against submerged permeable breakwaters: A hybrid finite element method approach. Mathematical Modelling of Engineering Problems, 10(6): 1977-1986. https://doi.org/10.18280/mmep.100607