Rasha N. Ramadhan*![]() | Mahmood G. Jassam
| Mahmood G. Jassam![]() | Firas Jasim
| Firas Jasim![]()
© 2024 The authors. This article is published by IIETA and is licensed under the CC BY 4.0 license (http://creativecommons.org/licenses/by/4.0/).
OPEN ACCESS
The significant challenges facing geotechnical engineers concerning gypseous soils and their behavior under water flow require careful assessment of gypsum soil performance under wet conditions. Improving gypsum soils through the inclusion of enhanced additives is among the most widely employed methods. The major objective of the current study was to investigate the effect of fiber additives on the engineering properties of gypseous soils experimentally. Natural fiber has been mixed into sandy and clay soils in several studies, but gypseous soils have not been investigated. However, the study investigated the properties of gypseous soils with three gypsum content (19%, 36%, 62%) improved by an agricultural waste of sugarcane bagasse (SCF) used as natural fiber and polypropylene (PPF) as an industrial fiber, these materials are economic, renewable and eco-friendly. The effect of fibers on compaction characteristics, specific gravity, and shear strength parameters at both dry and soaked conditions (soaked in water for 1 day) is investigated. Fibers used by percentage (0- 0.8% by weight of dried soil). From the result of soil improved by polypropylene fibers (PPF), The significant increase was observed in cohesion under both dry and soaked conditions, surpassing the cohesion increment observed in soil treated with SCF. in dry conditions for soil treated by (PPF) the increment was recorded (20%-126%), and for soil treated by (SCF), the increment was recorded (19%-81%). But the angle of internal friction of the soil improved by SCF in dry and soaked conditions was higher than that soil treated by PPF, in dry condition for soil treated by PPF the increment was recorded (8%-33%) and (21%-54%) for soil treated by SCF. shear strength parameters in the dry condition are more than the increment in soaked condition for treated soil by (PPF and SCF), also from the results can be obtained the optimum fiber content was 0.6%, and 0.4% for SCF and PPF respectively. The max. dry unit weight and specific gravity for three types of soils decreased by increasing fiber content but optimum moisture content increased by increasing fiber content. Lastly can be concluded the PPF gave better results than SCF.
improved soil, gypseous soils, gypseous soil, natural fibers, agricultural waste, sugarcane bagasse, industrial fibers, polypropylene
Water flow through Gypseous soil causes serious issues such as leaching of soil particles and dissolving of gypsum salts, which lead to changes in physical and chemical properties [1]. Also, the water causes significant volumetric changes by dissolving the soluble sulfate and calcium causing cavities in soils under structures leading to sudden settlement and failure [2]. Furthermore, one of the most critical scenarios involves the elevation of groundwater levels, resulting in the submersion of semi-dry gypseous soil for varying durations. This typically has an impact on the engineering properties of the soils. The dissolution of gypsum has left numerous buildings vulnerable to extensive deformation, with the majority of these structures suffering severe damage [3]. The results indicate that the collapse potential of gypseous soil increased with higher gypsum concentration and void ratio, while it decreased with increased initial water content and dry density. The main purpose of soil reinforcement is to increase soil stability, and decrease deformation, so that leading to prevent erosion and settlements [4]. Generally, fibers can be categorized into three types, natural fibers (like coir and jute, bagsscan, etc.), synthetic fibers (like polypropylene and polyester, etc.) as well as waste fibers (like old/used tire fibers and used plastic fibers). Natural materials typically possess lower embodied energy and cause considerably less damage to the environment compared to synthetic materials. Consequently, these materials require less processing and can often be utilized in their raw form. The strength of reinforced soils is affected by the fiber content, fiber physical properties, and aspect ratio (length/Diameter) [5-9]. Geotextile increases the bearing capacity of the soil but reduces settlement [10].
The laboratory results of polypropylene fibers effect on gypseous soil showed that the shear strength increased by 450% after treatment with 1% PPF, in addition to the reduction of collapse potential by 12.0% [11]. Also, the bearing capacity increased by 80%. Also, the laboratory results [12] about used polypropylene to improve sandy soil showed that the angel of internal friction Ø, the soil cohesion C, CBR increased by 24%, 20%, and 182% respectively, while permeability decreased by 26%, and optimum percentage (0.6%) expected permeability was (0.1%). Consoli et al. 2003 studied the effect of polypropylene on sandy soils, their results showed that Ø and C increased by 3.3% and 430% respectively [13]. Soundara studied the effect of polypropylene and coir fibers in clay soil with three percentages (0.5, 1, and 1.5) from dry weight, the results show that maximum dry density decreases by 15% for coir and 13.6% for PPF, optimum moisture content increases by 190% for coir and 107% for PPF, and CBR increase approached 100% [14]. Paulin Pinky et al. [15] added sugarcane baggess in sand soil by different percentages and concluded that Ø and C increased by 30% and 212% respectively, and the Optimum percentage added to soil was 1.4%. In the end, the frictional and interlocking forces have a coupled to mobilize the tensile stress on the fiber material. The interaction of the flexible fibers acts as a structural mesh that keeps the soil together [16]. In this paper, eco-friendly materials (sugarcane fibers SCF) are used to improve the properties of gypseous soils and the results are also compared with the results of soils treated with (industrial fibers PPF). And the effect of gypsum content on the properties of natural and treated soil by choosing different soil with three gypsum content are also studied. So, using these fibers in gypseous soil will form a network to prevent the soil particles from drifting.
2.1 Soils
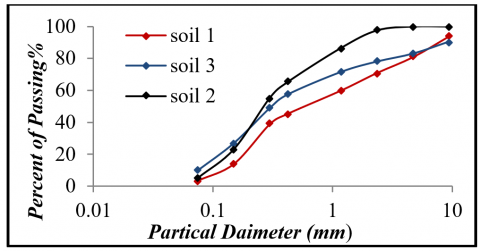
To conduct the experimental part, three types of gypseous soils with different gypsum content are used. These soils were collected at depths between 0.25 – 1 m from different places in the Salah-Aldeen governorate. The first soil (soil1), with low gypsum content (15%) is obtained from Baiji city, The second soil (soil 2) with medium gypsum content (36%) is obtained from Tikrit city. while the third soil (soil 3) is collected from Tikrit University with high gypsum content (62%). Table 1 and Table 2 present the properties of gypsum soils used in the study. Figure 1 shows the grain-size distribution for the soils used in the study.
Figure 1. The grain-size distribution curves for soils used
Table 1. Physical, chemical, and engineering properties of used soils
|
Properties |
Standards |
Soil 1 |
Soil 2 |
Soil 3 |
|||
|
Specific gravity (Gs) |
ASTM D854 [17] |
2.57 |
2.44 |
2.37 |
|||
|
Atterberg limits |
(L.L)% |
ASTM D4318 [18] |
28 |
26 |
25 |
||
|
(P.L)% |
N.P |
N.P |
N.P |
||||
|
Unified soil classification |
ASTM D422 [19] |
SP |
SP-SM |
SP-SM |
|||
|
Field unit weight, (γf) kN/m³ |
ASTM D1556 [20] |
14.3 |
13.8 |
13 |
|||
|
Field moisture content, (ω)% |
9.2 |
8.7 |
7.9 |
||||
|
Maximum dry density (γd max) kN/m³ |
ASTM D698-91 [21] |
17.6 |
17.4 |
16.5 |
|||
|
Optimum moisture content (O.M.C)% |
15.4 |
13.2 |
13 |
||||
|
Direct shear |
Dry case |
C (KN/m2) |
ASTMD3080, 2011 [22] |
15.3 |
17.3 |
20.1 |
|
|
(ϕ)˚ |
30.7 |
24.1 |
21.7 |
||||
|
Soaked case |
C (KN/m2) |
9.6 |
9.2 |
8.8 |
|||
|
(ϕ)˚ |
22.7 |
17.48 |
14.8 |
||||
|
Gypsum content % |
BS 1377-3 [23] |
19.37 |
40.12 |
65.66 |
|||
|
Total soluble salts % |
22.07 |
48.53 |
70.86 |
||||
|
Organic matters % |
0.003 |
0.002 |
0.001 |
||||
|
pH value |
7.89 |
7.91 |
7.98 |
||||
2.2 Fibers
2.2.1 Natural fiber
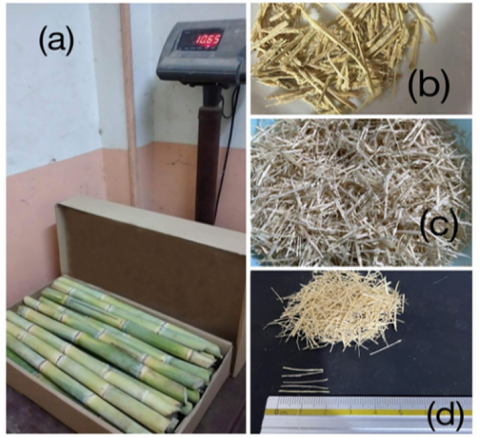
Sugar cane was purchased, and then extrusion juice, and the waste was cleansed with normal water to remove any remaining glucose, washing sugarcane waste would make the fiber more durable [24]. As shown in Figure 2, sugarcane was properly dried using air drying for three days at temperature between (30℃-35℃), [25] temperature should be less than 35 to prevent combustion and the decomposition of a cellulose arrangement. As can be seen in Table 2 of Sugarcane properties, fibers were cut into lengths ranging from 15 to 20 mm, with an average diameter of 0.3 mm.
Figure 2. Created fibers: (a) From the supplier; (b) Cutting the hard outer rind of the sugarcane; (c) After the process by washing and drying; (d) After cutting to a specific length
Table 2. The properties of sugarcane fiber [26]
|
Property |
Value |
|
Color |
Golden |
|
Density |
1.25(g/cm3)* |
|
Cut length |
15-20 mm |
|
Average diameter |
0.3 mm |
|
Aspect ratio (l/d) |
50-66 |
|
Water absorption |
291% |
|
Tensile strength |
222–290 (MPa)* |
|
Elongation |
1.1 (%)* |
|
Cellulose (wt. %) |
32–55.2* |
|
Hemicellulose (wt. %) |
16.8* |
|
Lignin (wt. %) |
19–25.3* |
2.2.2 Industrial fibers
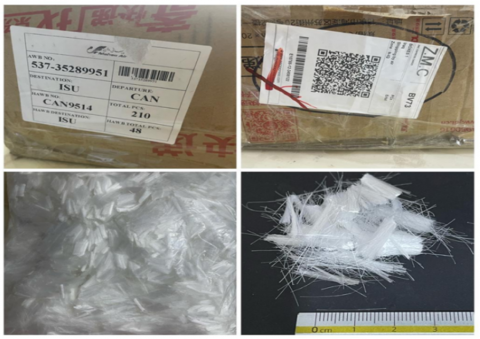
Polypropylene monofilament fiber is one of the most widely used industrial fibers in the strengthening of soils. polypropylene fiber made by Shandong JinHongyao Engineering Material and it has been used in the present study. The characteristics of polypropylene fiber are presented in Table 3 and Figure 3.
Table 3. The properties of polypropylene fiber according to the manufacturer
|
Property |
Value |
|
Color |
Transparent fibers |
|
Density |
1.29 g/cm3 |
|
Length |
18 mm |
|
Diameter |
13 µm |
|
Aspect ratio (l/d) |
1384 |
|
Tensile strength |
1650 Mpa |
|
Elongation |
18% |
|
Alkali resistance |
97% |
|
Acid resistance |
High |
|
Ignition point |
365℃ |
|
Melt point |
255℃ |
|
Absorption |
Nil |
Figure 3. Polypropylene fibers
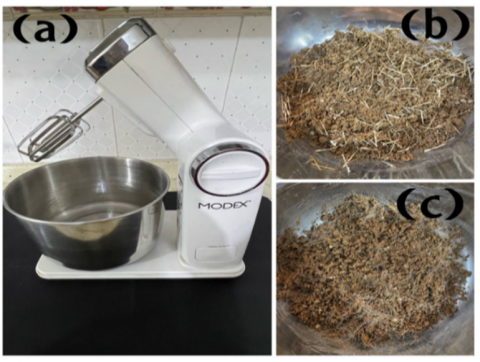
Figure 4. (a) An electric mixer; (b) Soil mixed with SCF; (c) Soil mixed with PPF
2.3 Sample preparation
To prepare the samples, collect the soils passed sieve No. 4 then dry them in an oven for 24 hours at 45℃. The batter is properly hand-mixed to get a homogeneous mixture, adding the water to the specimen to achieve the required moisture content. For samples reinforced with fibers, the fiber was added to the soil according to the required percentage, after subtracting the amount of soil to achieve the total weight (w =field unite weight *volume of mold) of the sample at dry conditions. Before mixing the fiber with soil, add the required water to achieve natural water content, because it was found that mixing the fibers into dry soil creates segregation issues in addition to floating issues of fibers. Afterward, it was mechanically mixed using a mechanical mixer. Figure 4 shows the details of the mixing process. For the three different types of gypseous soils, all specimens were prepared using the field unit weight and natural moisture content. In this research, we focused on specific gravity, compaction testing, and direct shear analysis due to the granular nature of the soil, which makes it well-suited for these tests. Additionally, this approach allowed us to determine the shear strength parameters of the soil under various moisture conditions, particularly when exposed to water. Fibers (SCF) and polypropylene fibers (PPF) were blended with gypseous soils at varying percentages (0.2%, 0.4%, 0.6%, and 0.8%) relative to the dry weight of the soil. These ratios were selected based on the findings of previous literature reviews, particularly those by Hejazi, and their optimized fiber percentages [27].
3.1 Specific gravity
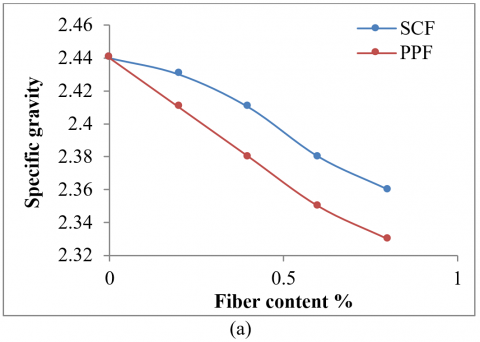
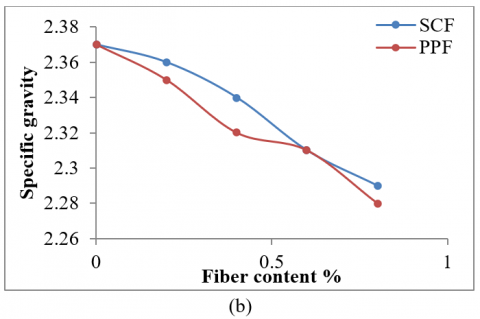
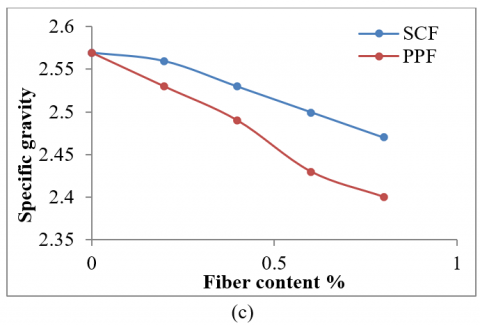
This test performed according to ASTM D854 [17], kerosene was used instead of water to avoid dissolution of gypsum [28]. Figure 5 presents the summary of specific gravity values for the fiber-treated soils. For fibers-treated soil by SCF and PPF, the specific gravity goes down gradually by increasing fiber content. Also, the declining percentage for SCF-treated soil was less than for PPF-treated soil because the specific gravity for PPF is less than SCF.
It can be concluded from previous studies that the specific gravity of sugarcane bagasse, Bahurudeen and Santhanam [29] found it was around 1.91, while Bhoi et al. [30] recorded values generally range from 2.1 to 2.34 after experimentation on sugarcane ash. Also, the specific gravity for PPF was 0.90 - 0.91 as reported.
Figure 5. Specific gravity versus fiber content (%) for various fibers contents (a) Soil 1; (b) Soil 2; (c) Soil 3
3.2 Compaction test
3.2.1 maximum dry unit weight
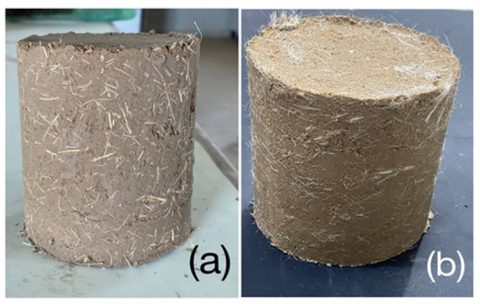
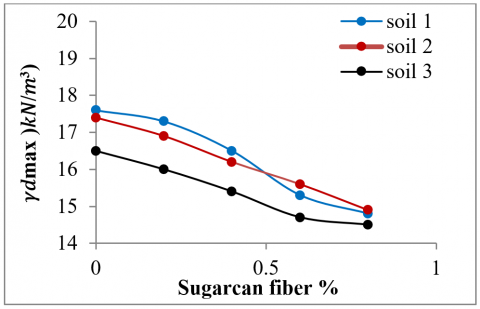
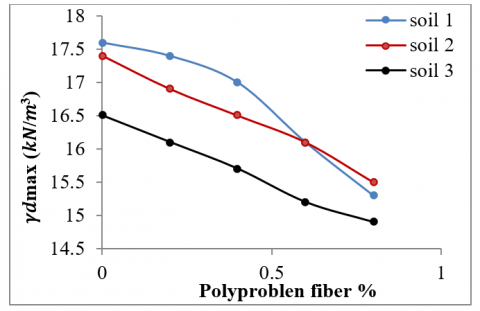
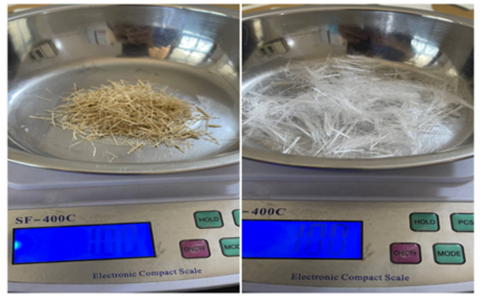
The test was performed using the Standard Proctor Compaction apparatus. Figure 6 presents soil samples improved by fibers. Figures 7 and 8 present the percentage of fibers vs. dry unit weight. Based on the results, it is evident that an increase in fiber content reduced the maximum dry unit weight, aligning with the trends observed in prior researches [11, 31]. The reduction in the unit weight of the soil-fiber mixture can be attributed to the lightweight nature of the fibers. This is evident in both figures mentioned. Specifically, the decrease in unit weight was more pronounced in the soil treated with SCF compared to the soil treated with PPF. This difference can be attributed to the higher density of PPF, which is 1.29 g/cm³, in contrast to the lower density of SCF at 1.25 g/cm³. Therefore, due to the higher density of PPF compared to SCF for the same weight, PPF is distributed more effectively within the soil, resulting in reduced voids. Figure 9 illustrates the varying densities of 1 gram of the two types of fibers.
Figure 6. Samples for compaction test: (a) Soil improved by SCF; (b) Soil improved by PPF
Figure 7. Variation of maximum dry unit weight with SCF for soils
Figure 8. Variation of maximum dry unit weight with PPF for soils
Figure 9. (a) 1 gr from SCF; (b) 1 gr from PPF
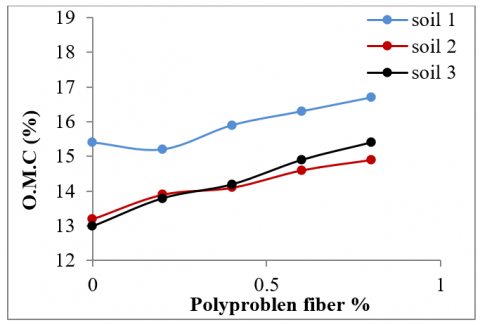
3.2.2 Optimum moisture content
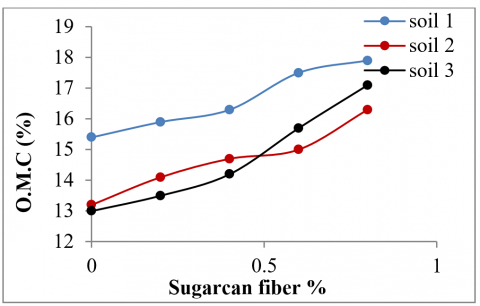
Figures 10 and 11 show the optimum moisture content versus SCF and PPF respectively. The results have shown that augmenting the addition of fibers increases the optimal moisture content. This rise in optimal moisture content can be ascribed to the gypseous soil's inherent limitation in water retention. As the percentage of gypsum content increases, the soil tends to experience greater moisture loss [32]. Furthermore, the results clearly illustrate that the increase in water content for soil treated with SCF is considerably higher compared to soil treated with PPF. This notable difference can be attributed to the significantly higher water absorption rate of SCF fibers, which stands at 291%. Furthermore, the compaction test results of the soils treated with fibers are consistent with the trends observed in previous research [14, 33].
Figure 10. Variation of optimum moisture content versus SCF for soils
Figure 11. Variation of optimum moisture content versus PPF for soils
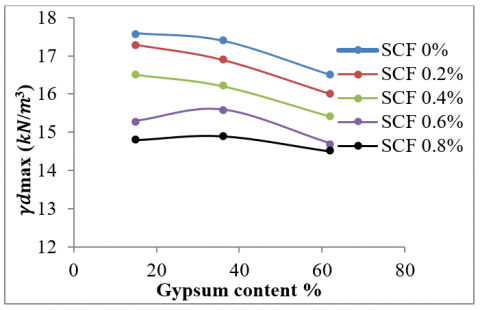
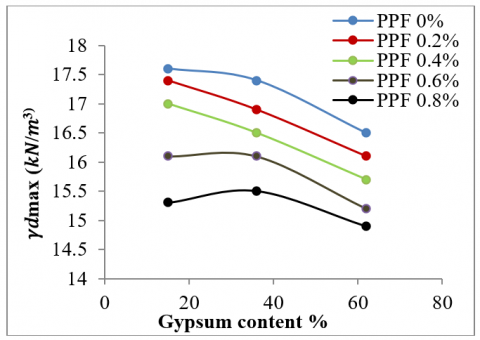
3.2.3 Relation between gypsum content and max. dry unite weight
Figures 12 and 13 show the influence of gypsum content on maximum dry density for fibers-treated soils. Based on the results, a relationship can be established between gypsum content and the maximum dry density for soils treated with fibers. Particularly noteworthy is soil 1, characterized by its low gypsum content, which displayed the most substantial reduction in dry density when 0% to 0.8% of both natural and industrial fibers were added. This phenomenon can be attributed to the size difference between soil particles and gypsum particles. Consequently, when fibers are introduced to the soil, the mineral gypsum effectively occupies the voids, surpassing the soil particles in this aspect.
Figure 12. Influence of gypsum content on maximum dry density for SCF-treated soils
Figure 13. Influence of gypsum content on maximum dry density for PPF-treated soils
3.3 Direct shear test
3.3.1 SCF-treated soils
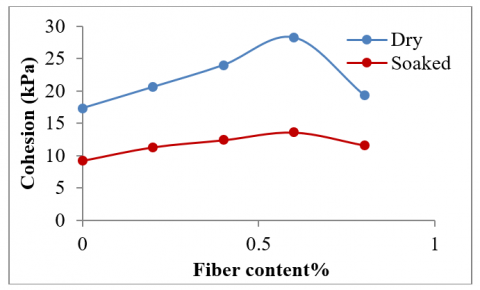
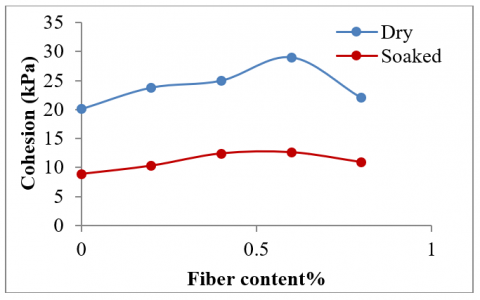
(1) Cohesion: From the results, it's evident that there's a positive relationship between cohesion and fiber content up to 0.6% of fibers. Beyond this point, cohesion starts to decline but remains greater than that of untreated soil. This decrease in cohesion with higher fiber content could be attributed to sugarcane fibers blocking the attraction between soil particles [24]. Figures 14 to 16 depict the impact of SCF content on cohesion for three gypseous soils under both dry and soaking conditions. Notably, a 0.6% fiber content consistently shows significant improvements in overall strength. Based on these findings, it can be inferred that the optimum value of SCF fibers to add to gypseous soils is 0.6%. For optimum fiber content in dry conditions, the increments were 81%, 63%, and 44% for soil 1, soil 2, and soil 3, respectively. In soaked conditions, the increments were 63%, 48%, and 42% for soil 1, soil 2, and soil 3, respectively.
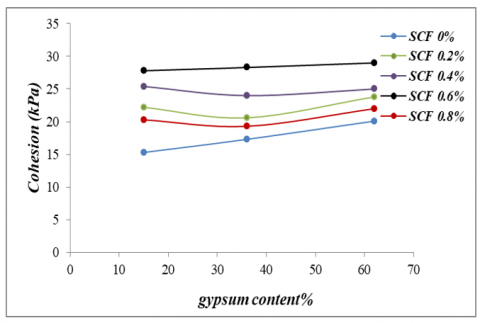
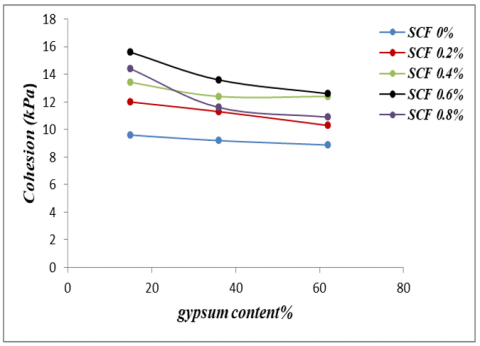
(2) As indicated by the direct shear tests results, all gypseous soils exhibit cohesion. This phenomenon can be attributed to the presence of gypsum in untreated gypseous soil, which acts as a binding agent to hold the soil particles together. Similarly, in treated gypseous soil, the fibers serve a cementing function, contributing to soil cohesion. Figures 17 and 18 illustrate the influence of gypsum content on cohesion in both dry and soaked conditions. The findings reveal that the shear strength of the dry soils treated with SCF is notably greater than that of the soaked soils treated with SCF. Moreover, soils treated with SCF is significantly higher than that of the soaked soils treated with SCF (for soaked condition the sample was soaked by water for 1 day, then loaded and tested).
Figure 14. Influence of SCF content on the cohesion of soil 1
Figure 15. Influence of SCF content on the cohesion of soil 2
Figure 16. Influence of SCF content on the cohesion of soil 3
Figure 17. Influence of gypsum content on cohesion for SCF (dry condition)
Figure 18. Influence of gypsum content on cohesion for SCF (sock condition)
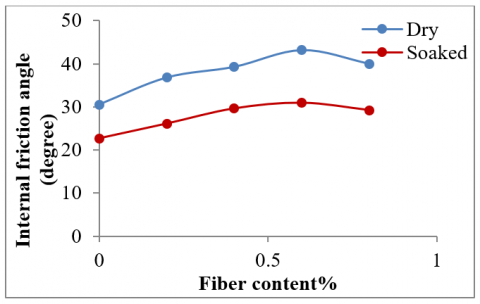
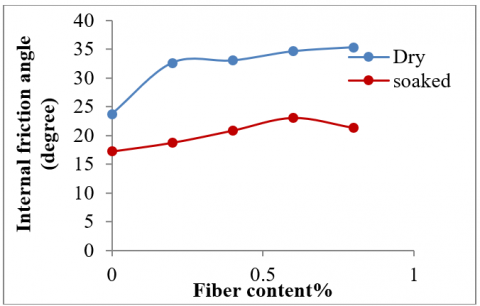
(3) Angle of internal friction: The angle of internal friction slightly an increase after treatment in both dry and soaked conditions. Figures 19 to 21 depict the impact of SCF content on the angle of internal friction for three gypseous soils. In dry conditions, there was an increment of 42%, 46%, and 50% for soil 1, soil 2, and soil 3 respectively. In soaked conditions for SCF-treated soil, the increment was 36%, 34%, and 26% for soil 1, soil 2, and soil 3 respectively. These results align with the trends observed in prior research [15].
Figure 19. Influence of SCF on friction angle of soil 1
Figure 20. Influence of SCF content on friction angle of soil 2
Figure 21. Influence of SCF content on friction angle of soil 3
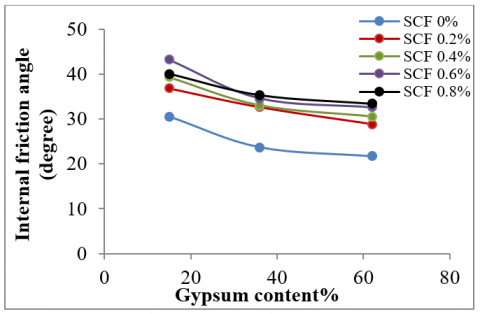
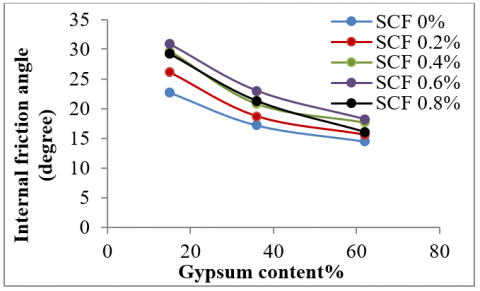
(4) Relation between gypsum content and Angle of internal friction: The results revealed that the angle of friction exhibits a slight increased with an increased in gypsum content. In dry conditions, this phenomenon may be attributed to the jagged and rough surface of the fibers, resulting in an overlap between gypsum particles and the fiber surface, consequently increasing friction. These findings are consistent with the results of a previous study [34]. Furthermore, it's noted that the internal friction increases in soaked conditions as gypsum content decreases. This increase in internal friction for soil 1 could be attributed to the presence of water, which leads to gypsum dissolution. It has also been observed that when fibers are placed in saltwater, their stiffness (ductility) decreases. This could be due to the fact that the fibers expand in volume, resulting in increased surface friction between the fiber and soil particles [35]. Figures 22 and 23 illustrate the effect of gypsum content on the friction angle under both dry and moist conditions.
Figure 22. Influence of gypsum content on friction angle for SCF (dry condition)
Figure 23. Influence of gypsum content on friction angle for SCF (soaked condition)
3.3.2 PPF-treated soils
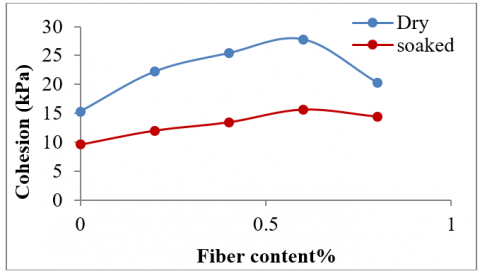
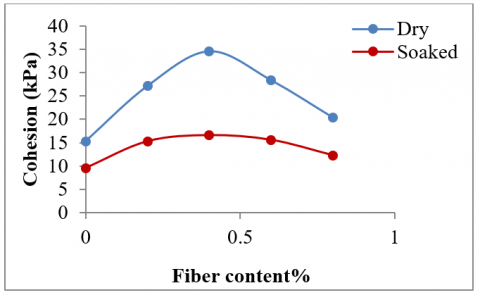
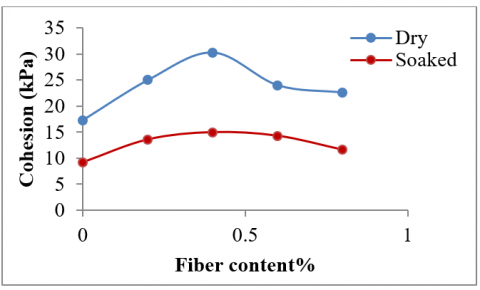
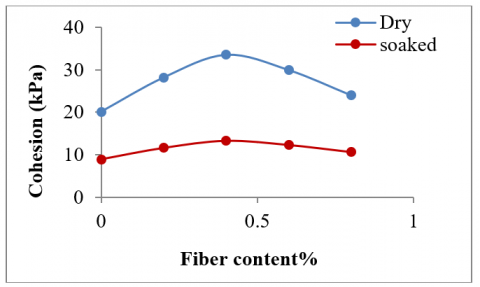
(1) Cohesion: The results highlight that dry soils treated with PPF exhibit significantly higher shear strength than their soaked counterparts. Shear strength in PPF-treated soils increases with the addition of fibers up to a certain threshold and then begins to decrease, aligning with observations made in prior research [7]. However, it consistently remains higher than that of untreated soils. The optimal PPF content is found to be 0.4%, as beyond this limit, further increases in PPF content result in less substantial improvements in cohesion, as depicted in Figures 24 to 26.
In dry conditions, the increment in shear strength for PPF-treated soil was 126%, 75%, and 67% for soil 1, soil 2, and soil 3, respectively. In soaked conditions, the increment was 73%, 63%, and 51% for soil 1, soil 2, and soil 3, respectively. These findings align with trends observed in previous research conducted by AbdulRahman et al. [11]. The enhanced shear strength behavior of gypseous soils can be attributed to the properties of PPF, particularly its flexural strength stemming from its semi-crystalline nature, and its superior shear resistance when combined with soils. PPF reinforces the soil by creating a fiber network and enhances friction at the interface [36].
Figure 24. Influence of PPF content on the cohesion of soil 1
Figure 25. Influence of PPF content on the cohesion of soil 2
Figure 26. Influence of PPF content on the cohesion of soil 3
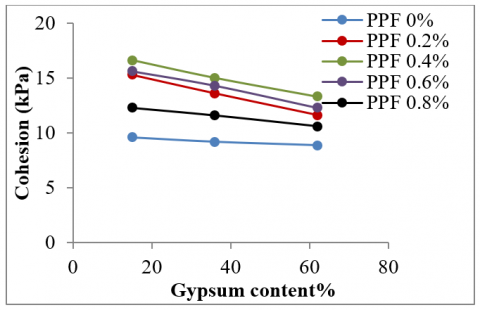
Figure 27. Influence of gypsum content on cohesion for PPF (dry condition)
Figure 28. Influence of gypsum content on cohesion for PPF (soaked condition)
Figure 29. Influence of PPF content on friction angle of soil 1
Figure 30. Influence of PPF content on friction angle of soil 2
Figure 31. Influence of PPF content on friction angle of soil 3
Figure 32. Influence of gypsum content on friction angle for PPF (dry condition)
Figure 33. Influence of gypsum content on friction angle for PPF (soaked condition)
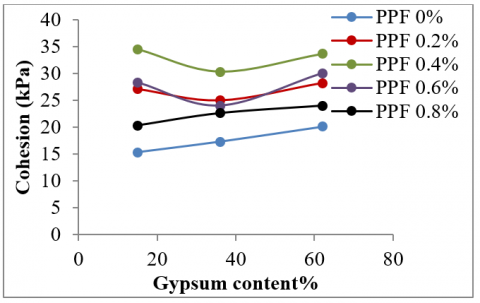
(2) Relation between gypsum content and cohesion: The impact of gypsum content on cohesion is visually represented in Figures 27 and 28. Soil 1, characterized by low gypsum concentration, demonstrates the most substantial increases in cohesion under both dry and soaked conditions.
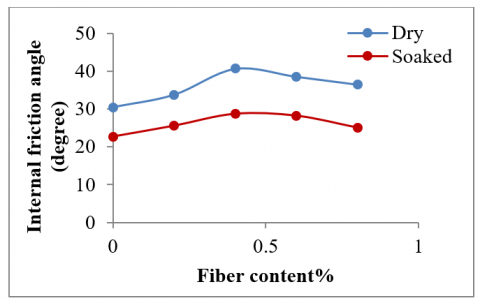
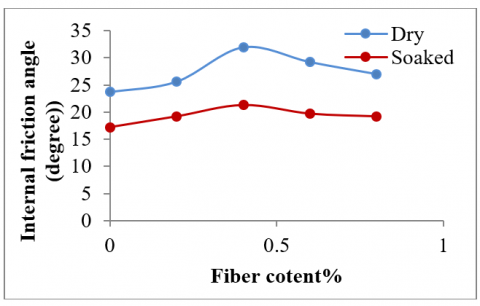
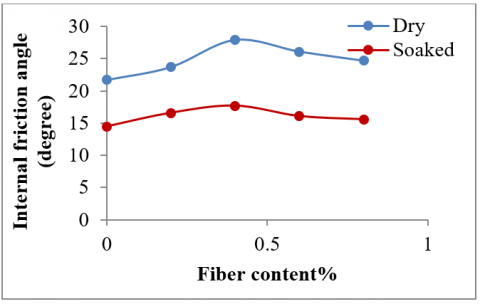
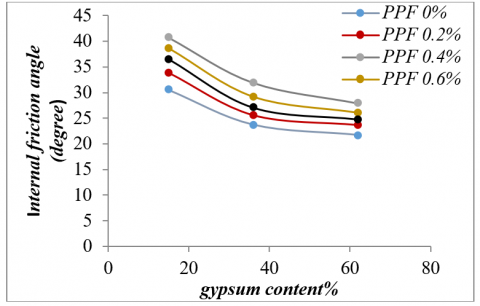
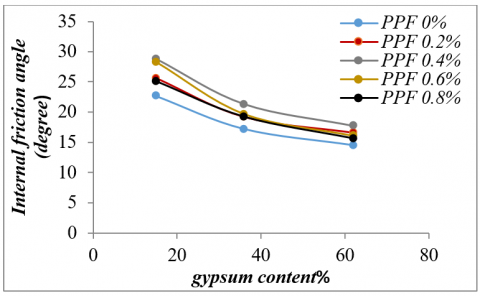
(3) Angle of internal friction: Based on the results, the angle of internal friction in soils treated with PPF initially increases up to a specific threshold and then starts to decrease. Figures 29 to 31 illustrate how the addition of PPF affects the angle of internal friction in three different gypseous soils under both dry and soaked conditions. It has been determined that the optimal PPF content is 0.4%, as it results in the highest friction angle values. In dry conditions, when the PPF content is optimized, there was an increase of 33%, 30%, and 31% in the angle of internal friction for soil 1, soil 2, and soil 3, respectively. Under soaked conditions, the angle of internal friction increased by 27%, 24%, and 22% for soil 1, soil 2, and soil 3, respectively. These findings align with the trends observed in previous research from AbdulRahman et al. [11]. The increase in soil strength can be attributed to the larger surface contact area between the PPF fibers and soil particles. However, adding excessive fibers can lead to a weakening effect because it causes the fibers to be closely packed together, hindering the development of interfacial strength [37, 38]. Figures 32 and 33 present the impact of gypsum content on the angle of internal friction.
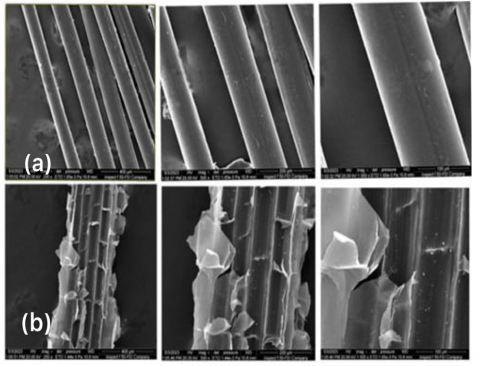
The angel of internal friction is greater for the soil treated with SCF compared to PPF due to the rough texture of SCF. Conversely, PPF features a smooth surface, which becomes apparent when examining both fiber surfaces using a Scanning Electron Microscope (SEM) with precision levels of 400 ƞm and 200 ƞm. Figure 34 illustrates SEM images depicting the contrasting surface characteristics of SCF and PPF.
Figure 34. SEM micrographs of the (a) PPF; (b) SCF
The main objective of this study was to investigate the impact of fibers on the performance of gypsum soils. So, framework has provided about improving gypsum soil by fibers. And the following key points conducted from results:
(1). The optimum fiber content for treating gypseous soils was 0.6% and 0.4% for SCF and PPF respectively.
(2). As the fiber content increases in both SCF and PPF treatments, the specific gravity decreases. However, the reduction in specific gravity is more pronounced in PPF-treated soil compared to SCF-treated soil.
(3). Increasing fiber content leads to a reduction in the maximum dry unit weight for both SCF and PPF treatments. Nevertheless, the reduction is more significant in SCF-treated soil compared to PPF-treated soil. Simultaneously, the optimum moisture content increases with increasing fiber content, with a more substantial increment observed in SCF-treated soil compared to PPF-treated soil.
(4). Increasing the shear strength parameter for soil treated by fibers both SCF and PPF but the value of cohesion for PPf-treated soil is more than the value of SCF-treated soil (in optimum fiber content) in both dry and soak conditions.
(5). The angle of internal friction for SCF-treated soil exceeded that of PPF-treated soil due to the rough surface texture of SCF.
(6). PPF is more efficient than SCF to improve the properties of gypseous soils.
(7). Both PPF and SCF offer cost-effective solutions for enhancing large areas economically. Furthermore, they are environmentally friendly as they contribute to the management of significant waste disposal challenges.
The following recommendations are proposed for future research, depends on existing work:
(1). Investigations on treated or coated natural fibers to determine the impact of continuous water absorption on the fibers in gypseous soil.
(2). As an important issue, under soaking and drying cycles, the durability of natural fibers must be studied.
(3). Using various types of fibers to improve gypseous soils.
[1] Al-Obaydi, Q.A.J. (2003). Studies in geotechnical and collapsible characteristics of gypseous soil. M. Sc. Thesis, Civil Engineering Department. College of Engineering. Al-Mustansyria University, Baghdad, Iraq. https://doi.org/10.13140/RG.2.2.33313.97124
[2] Azam, S., Abduljauwad, S.N., Al-Shayea, N.A., Al-Amoudi, O.S. (1998). Expansive characteristics of gypsiferous/anhydritic soil formations. Engineering Geology, 51(2): 89-107. https://doi.org/10.1016/S0013-7952(98)00044-1
[3] Al-Riahi, S.M.H., Pauzi, N.I.M., Fattah, M.Y. (2023). Compressibility characteristics of collapsible gypseous soil: A review. In IOP Conference Series: Earth and Environmental Science, 1205(1): 012068. https://doi.org/10.1088/1755-1315/1205/1/012068
[4] Shukla, S.K. (2017). Fundamentals of Fibre-Reinforced Soil Engineering. Singapore: Springer Singapore.
[5] Yetimoglu, T., Salbas, O. (2003). A study on shear strength of sands reinforced with randomly distributed discrete fibers. Geotextiles and Geomembranes, 21(2): 103-110. https://doi.org/10.1016/S0266-1144(03)00003-7
[6] Gray, D.H., Ohashi, H. (1983). Mechanics of fiber reinforcement in sand. Journal of Geotechnical Engineering, 109(3): 335-353. https://doi.org/10.1061/(ASCE)0733-9410(1983)109:3(335)
[7] Freitag, D.R. (1986). Soil randomly reinforced with fibers. Journal of Geotechnical Engineering, 112(8): 823-826. https://doi.org/10.1061/(ASCE)0733-9410(1986)112:8(823)
[8] Gray, D.H., Al-Refeai, T. (1986). Behavior of fabric-versus fiber-reinforced sand. Journal of Geotechnical Engineering, 112(8): 804-820. https://doi.org/10.1061/(ASCE)0733-9410(1986)112:8(804)
[9] Maher, M.H., Gray, D.H. (1990). Static response of sands reinforced with randomly distributed fibers. Journal of Geotechnical Engineering, 116(11): 1661-1677. https://doi.org/10.1061/(ASCE)0733-9410(1990)116:11(1661)
[10] Yalaoui, N., Trouzine, H., Meghachou, M., Miranda, T. (2023). Geotextile reinforced strip footing: Numerical modeling and analysis. Mathematical Modelling of Engineering Problems, 10(2): 398-404. https://doi.org/10.18280/mmep.100202
[11] AbdulRahman, S., Fattah, M.Y., Ihsan, E.A. (2021). Influence of plastic fiber on the geotechnical properties of gypseous soil. International Journal of Engineering, 34(2): 367-374. https://doi.org/10.5829/ije.2021.34.02b.08
[12] Al-Saray, N.A., Shafiqu, Q.S., Ibrahim, M.A. (2021). Improvement of strength characteristics for sandy soils by polypropylene fibers (PPF). In Journal of Physics: Conference Series, 1895(1): 012016. https://doi.org/10.1088/1742-6596/1895/1/012016
[13] Consoli, N.C., Casagrande, M.D., Prietto, P.D., Thomé, A.N. (2003). Plate load test on fiber-reinforced soil. Journal of Geotechnical and Geoenvironmental Engineering, 129(10): 951-955. https://doi.org/10.1061/(ASCE)1090-0241(2003)129:10(951)
[14] Soundara, B. (2015). Effect of fibers on properties of clay. International Journal of Engineering and Applied Sciences, 2(5): 257909. https://www.ijeas.org/download_data/IJEAS0205055.pdf.
[15] Paulin Pinky, P.J., Dumas, J.P., Jyothika, J., Thomas, A. (2016). Effect of sugarcane bagasse on soil properties. International Journal of Engineering Research & Technology, 4(13).
[16] Wang, H.L., Chen, R.P., Liu, Q.W., Kang, X., Wang, Y.W. (2019). Soil–geogrid interaction at various influencing factors by pullout tests with applications of FBG sensors. Journal of Materials in Civil Engineering, 31(1): 04018342. https://doi.org/10.1061/(ASCE)MT.1943-5533.0002537
[17] ASTM D854-14. (2014). Standard test methods for specific gravity of soil solids by water pycnometer. ASTM International, West Conshohocken, PA.
[18] ASTM D4318-17e1. (2017). Standard test methods for liquid limit, plastic limit, and plasticity index of soils. ASTM International, West Conshohocken, PA. https://doi.org/10.1520/D4318-17E01
[19] Astm, D. (2007). Standard test method for particle-size analysis of soils. https://doi.org/10.1520/D2487-17E01
[20] ASTM D1556/ D1556M-15e1. (2015). Standard test method for density and unit weight of soil in place by sand-cone method. ASTM International, West Conshohocken, PA. https://doi.org/10.1520/D1556_D1556M-15E01
[21] ASTM D698-12. (2021). Standard test methods for laboratory compaction characteristics of soil using standard effort (12,400 ft-lbf/ft3 (600 kN-m/m3)). ASTM International, West Conshohocken, PA. https://doi.org/10.1520/D0698-12R21
[22] ASTM D3080-04. (2012). Standard test method for direct shear test of soils under consolidated drained conditions. ASTM International, West Conshohocken, PA. https://doi.org/10.1520/D3080-04
[23] BS 1377:2A. (1990). Method of test for soils for civil engineering purposes. British Standard Institution, London, UK. https://allcivilstandard.com/wp-content/uploads/2019/02/BS-01377-7-1990-2010.pdf.
[24] Rangwala, H.M., Agrawal, L., Makhecha, V., Gondaliya, I. (2021). Improvement of strength reinforced by sugarcane fiber. In Proceedings of the Indian Geotechnical Conference 2019: IGC-2019 Volume III, pp. 873-878. https://doi.org/10.1007/978-981-33-6444-8_79
[25] Oderah, V. (2015). Shear strength behaviour of sugarcane bagasse reinforced soils. Master's thesis, University of Cape Town. http://hdl.handle.net/11427/20106
[26] Fuqua, M.A., Huo, S., Ulven, C.A. (2012). Natural fiber reinforced composites. Polymer Reviews, 52(3): 259-320. https://doi.org/10.1080/15583724.2012.705409
[27] Hejazi, S.M., Sheikhzadeh, M., Abtahi, S.M., Zadhoush, A. (2012). A simple review of soil reinforcement by using natural and synthetic fibers. Construction and Building Materials, 30: 100-116. https://doi.org/10.1016/j.conbuildmat.2011.11.045
[28] Head, K.H. (1980). Manual of Soil Laboratory Testing. London: Pentech Press.
[29] Bahurudeen, A., Santhanam, M. (2015). Influence of different processing methods on the pozzolanic performance of sugarcane bagasse ash. Cement and Concrete Composites, 56: 32-45. https://doi.org/10.1016/j.cemconcomp.2014.11.002
[30] Bhoi, A.K., Mandal, J.N., Juneja, A. (2020). Feasibility study of bagasse ash as a filling material. In Advancements in Unsaturated Soil Mechanics: Proceedings of the 3rd GeoMEast International Congress and Exhibition, Egypt 2019 on Sustainable Civil Infrastructures–The Official International Congress of the Soil-Structure Interaction Group in Egypt (SSIGE), pp. 81-94. https://doi.org/10.1007/978-3-030-34206-7_7
[31] Salim, N.M., AL-Soudany, K.Y., Ahmed, A.A. (2018). The impact of using recycled plastic fibres on the geotechnical properties of soft Iraqi soils. In IOP Conference Series: Materials Science and Engineering, 433(1): 012017. https://doi.org/10.1088/1757-899X/433/1/012017
[32] Al-Layla, M.T., AL-Obaydi, M.A. (1993). Lime stabilization of gypseous soils. In 5th Arab Conference on Structural Engineering, pp. 1001-1013.
[33] Muhauwiss, F.M. (2022). Influence of PPF on leaching and subsidence of Gypseaus soils. Eurasian Journal of Engineering and Technology, 11: 141-156. https://www.geniusjournals.org/index.php/ejet/article/view/2450.
[34] Oderah, V., Kalumba, D. (2017). Investigation of the use of sugarcane bagasse for soil reinforcement in geotechnical applications. Geotechnical Engineering, 48: 93-102.
[35] Bordoloi, S., Hussain, R., Garg, A., Sreedeep, S., Zhou, W.H. (2017). Infiltration characteristics of natural fiber reinforced soil. Transportation Geotechnics, 12: 37-44 https://doi.org/10.1016/j.trgeo.2017.08.007
[36] Al-Saray, N.A., Shafiqu, Q.S., Ibrahim, M.A. (2021). Improvement of strength characteristics for sandy soils by polypropylene fibers (PPF). In Journal of Physics: Conference Series, 1895(1): 012016. https://doi.org/10.1088/1742-6596/1895/1/012016
[37] Darvishi, A., Erken, A. (2018). Effect of polypropylene fiber on shear strength parameters of sand. In Proceedings of the 3rd World Congress on Civil, Structural, and Environmental Engineering (CSEE’18). https://doi.org/10.11159/icgre18.123
[38] Tang, C., Shi, B., Gao, W., Chen, F., Cai, Y. (2007). Strength and mechanical behavior of short polypropylene fiber reinforced and cement stabilized clayey soil. Geotextiles and Geomembranes, 25(3): 194-202. https://doi.org/10.1016/j.geotexmem.2006.11.002